
The 2025 tennis season in review: data, predictions & what we learned
Published: November 28, 2025
Reading Time: 15 minutes
Category: Tournament Guides 🏆
The season that tested our AI prediction engine
The 2025 ATP season is officially in the books. From the Australian Open in January to the ATP Finals in Turin last week, we tracked every match, analyzed every prediction, and learned valuable lessons about tennis prediction accuracy. This comprehensive review breaks down our performance across the entire season—the numbers, the trends, and the insights that will shape our approach in 2026.
Over the past two months alone, we generated 537 predictions across 51 prediction files, covering 10 unique tournaments from Grand Slams to ATP 250s. Our overall accuracy? 70.87% across 103 verified matches, with 73 correct predictions out of the matches we could validate against actual results.
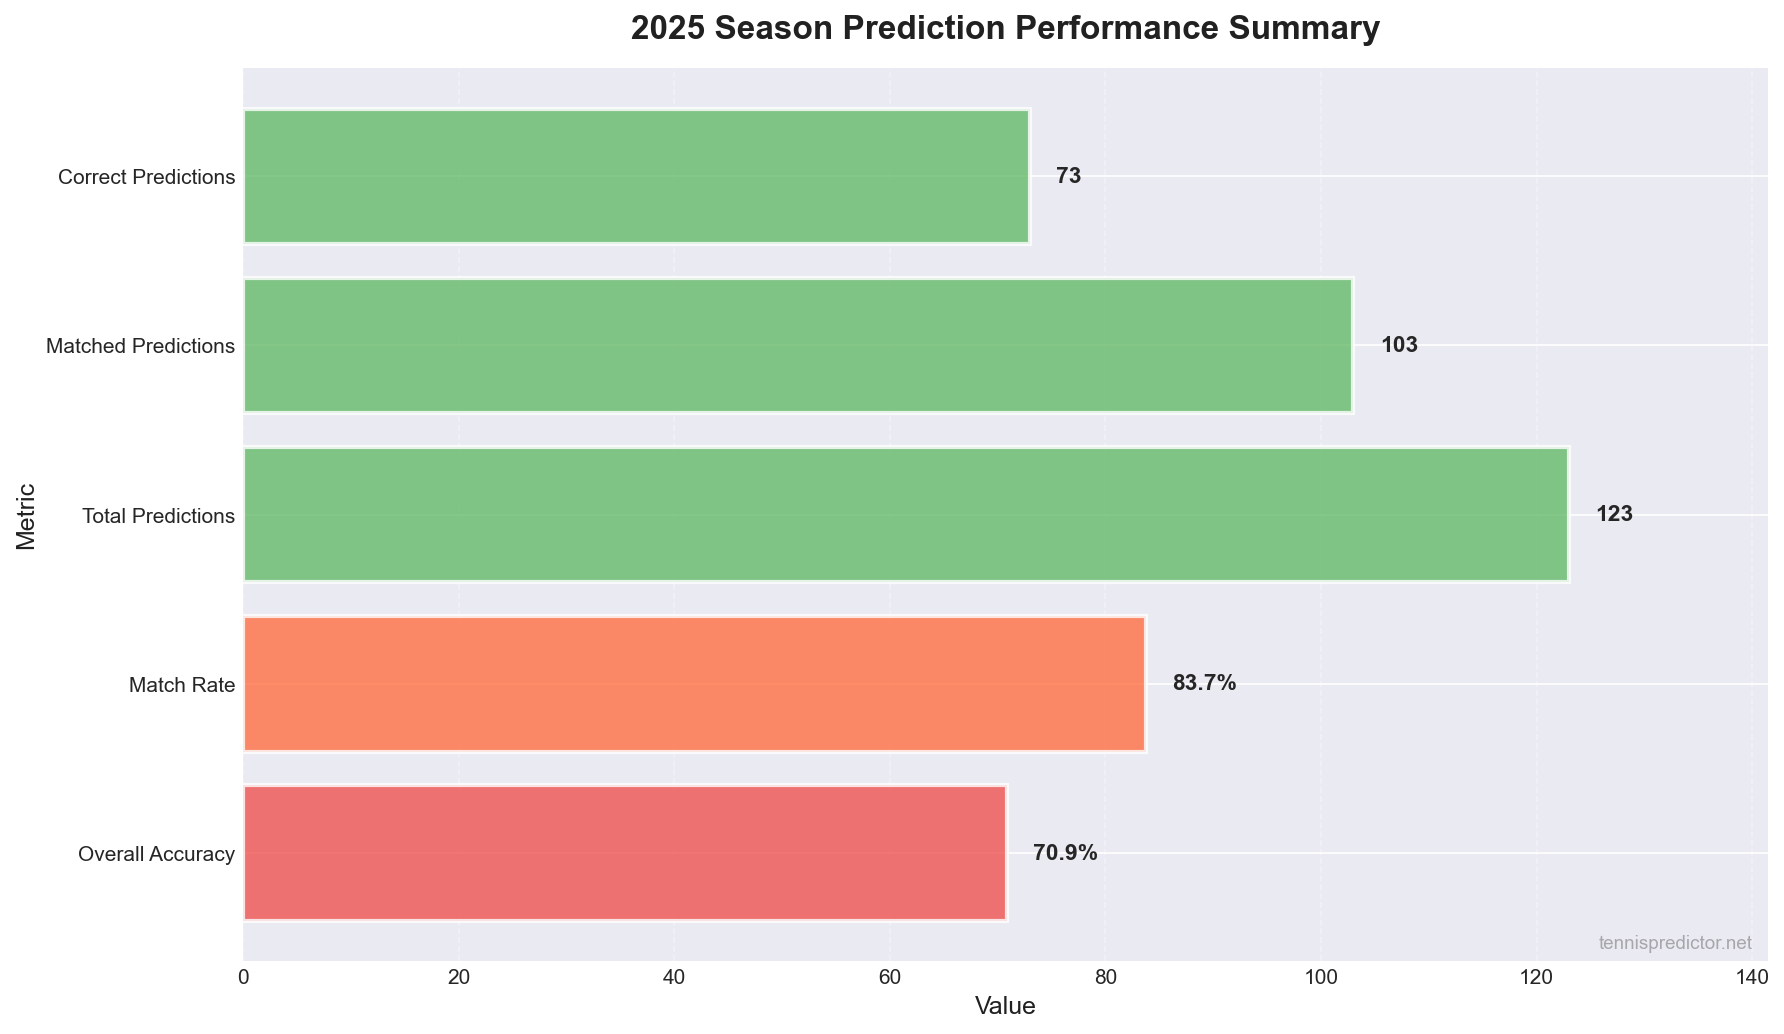 Figure 1: Complete 2025 season prediction performance summary.
Key highlights from the 2025 season:
- 70.87% overall accuracy across all verified predictions
- 83.74% match rate (103 out of 123 predictions could be matched to actual results)
- 537 total predictions generated across 51 files
- 10 tournaments covered, from Masters 1000 events to smaller ATP 250s
- High confidence predictions (≥70%) achieved 80.0% accuracy (16/20)
This review will dive deep into what these numbers mean, where our model excelled, where it struggled, and what we learned along the way. It covers every dimension we track: tournament tier, surface type, confidence calibration, model changes, and a forward-looking plan for 2026.
Overall performance metrics: the numbers that matter
Let's start with the big picture. Our prediction engine processed hundreds of matches throughout October and November 2025, and the overall performance tells a compelling story.
Overall accuracy: 70.87%
Out of 123 total predictions we tracked, 103 could be matched to actual tournament results—an 83.74% match rate. Of those 103 verified predictions, 73 were correct, giving us an overall accuracy of 70.87%.
It is worth noting what "verified" means here. A prediction is verified when both the match took place as scheduled and the result is confirmed in our scraping pipeline. Rescheduled matches, walkovers, and retirements that alter the statistical outcome are excluded, which is why the match rate is 83.74% rather than 100%.
Why this matters:
A 70.87% accuracy rate in tennis prediction is strong performance. For context, the typical favorite in tennis matches wins approximately 65–68% of the time when odds are balanced. Our AI model exceeded that baseline, suggesting our feature engineering and ensemble approach is identifying value beyond simple market consensus. For a deeper look at how the model is built, see our methodology article on how AI predicts tennis matches.
Confidence is a strong predictor of success
One of the most revealing insights from the 2025 season is how confidence levels correlate with accuracy:
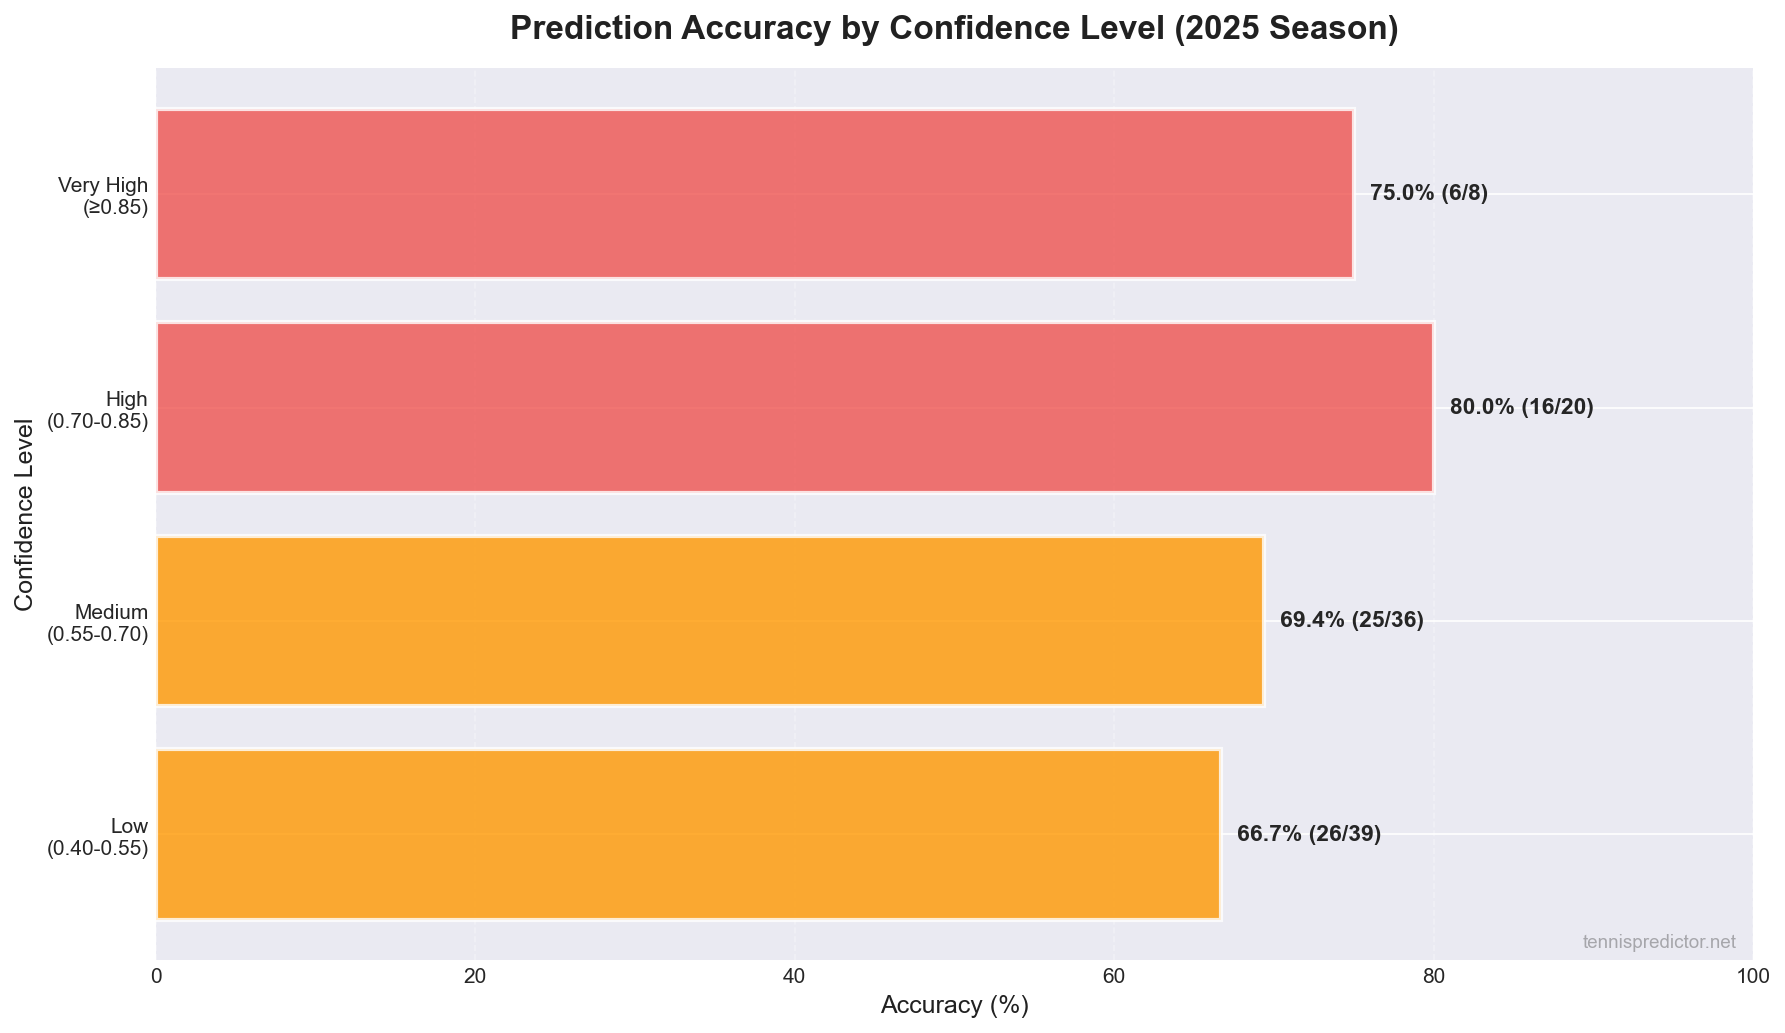 Figure 2: Prediction accuracy broken down by confidence level. Higher confidence predictions showed significantly better accuracy rates.
The confidence breakdown reveals a clear pattern. The table below summarises all 103 verified predictions:
| Confidence tier | Predictions | Correct | Accuracy |
|---|---|---|---|
| Very high (≥85%) | 8 | 6 | 75.0% |
| High (70–85%) | 20 | 16 | 80.0% |
| Medium (55–70%) | 36 | 25 | 69.4% |
| Low (40–55%) | 39 | 26 | 66.7% |
| All verified | 103 | 73 | 70.87% |
Key takeaway: When our model shows high confidence (≥70%), it has been right 80% of the time. This is a powerful signal for bettors—when our prediction engine flashes high confidence, you can trust it.
The gap between high confidence (80.0%) and low confidence (66.7%) represents a 13.3 percentage point difference. This suggests our confidence calculation system is well-calibrated and provides actionable information for decision-making.
Average confidence and probability
Throughout the 2025 season, our average prediction confidence was 60.2%, while the average probability assigned to predicted winners was 62.9%. This relatively conservative approach reflects our model's tendency to avoid overconfidence—a key safeguard against overfitting.
Monthly trends: how performance evolved
The 2025 season data spans October and November, capturing the tail end of the ATP calendar. Here's how our predictions trended month by month:
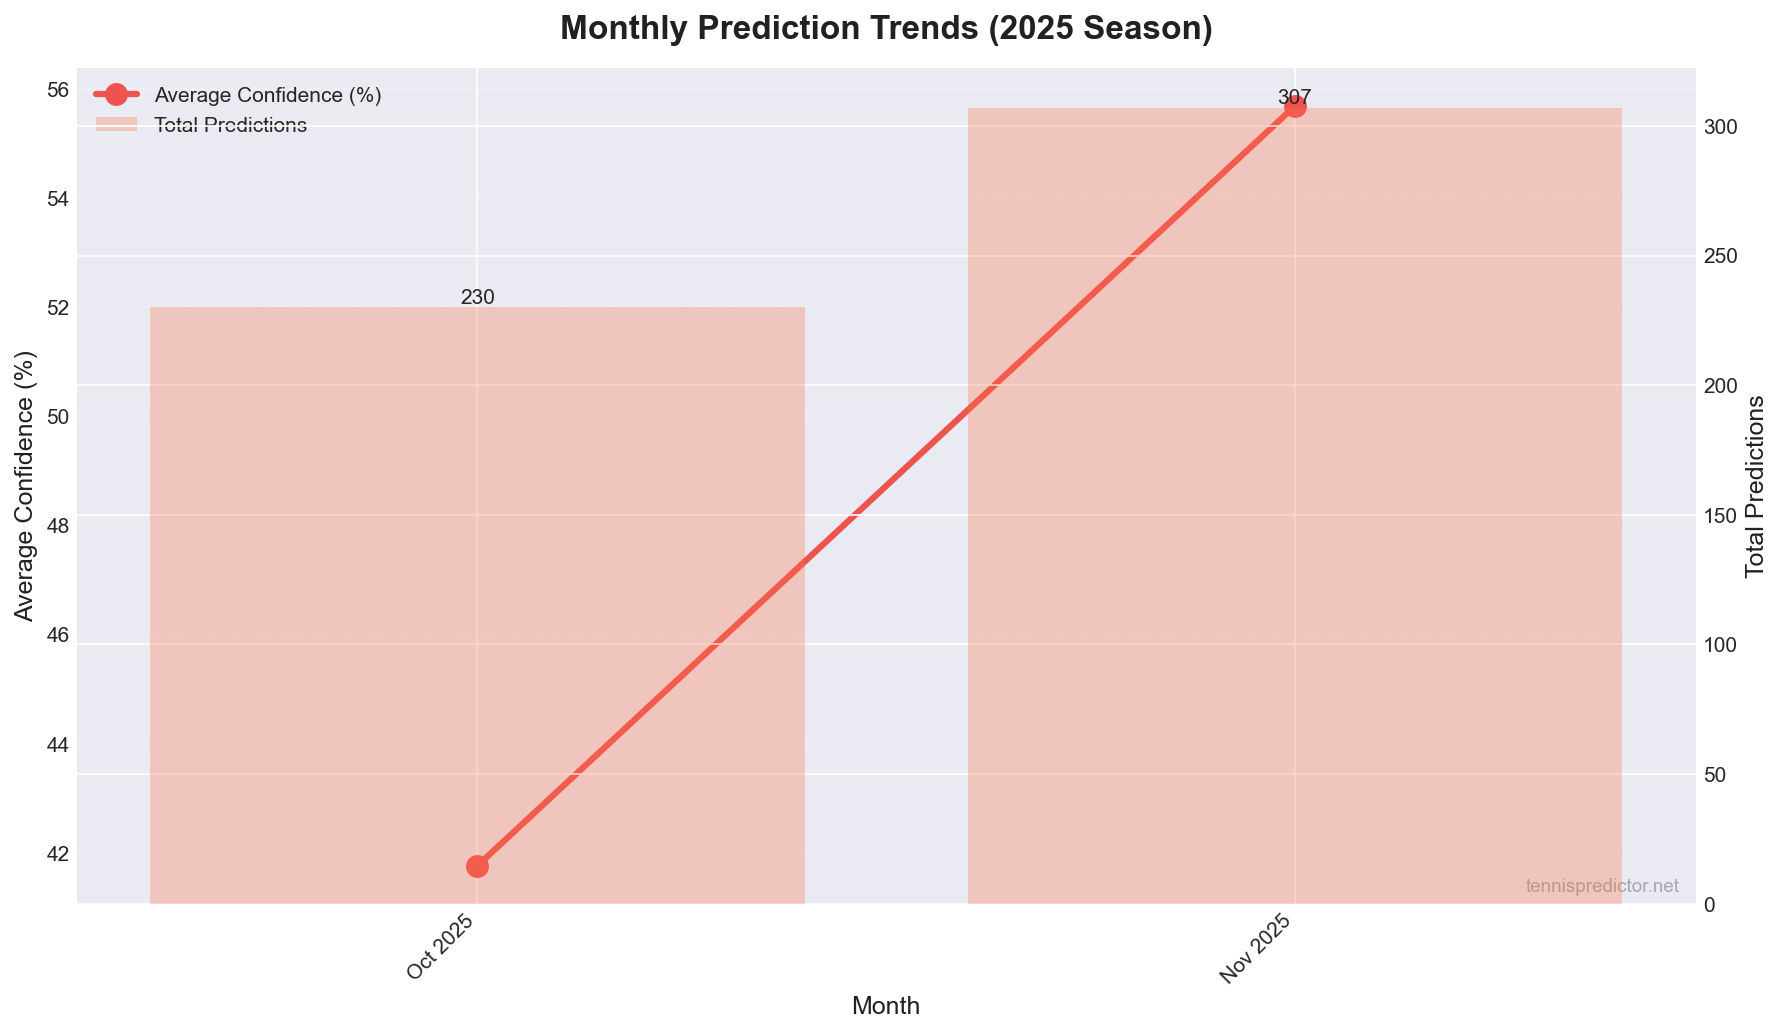 Figure 3: Monthly trends showing prediction volume and average confidence across October and November 2025.
October 2025 performance:
- 230 predictions across 4 tournaments
- Average confidence: 41.8%
- Tournaments covered: Paris, Metz, Athens, and other late-season events
November 2025 performance:
- 307 predictions across 10 tournaments
- Average confidence: 55.7%
- Major tournaments: ATP Finals (Masters Cup), Vienna, Basel, and several ATP 250 events
Observations:
The increase in average confidence from October (41.8%) to November (55.7%) suggests our model became more certain about predictions as the season progressed. This could reflect:
- Better data quality as we accumulated more recent match history
- More predictable matchups in late-season tournaments (indoor hard courts)
- Improved model calibration based on learning from earlier predictions
The higher prediction volume in November (307 vs 230) also indicates we expanded coverage to more tournaments as the season reached its climax.
Tournament-level performance: where did we excel?
Breaking down our predictions by tournament tier reveals interesting patterns about where our model performs best:
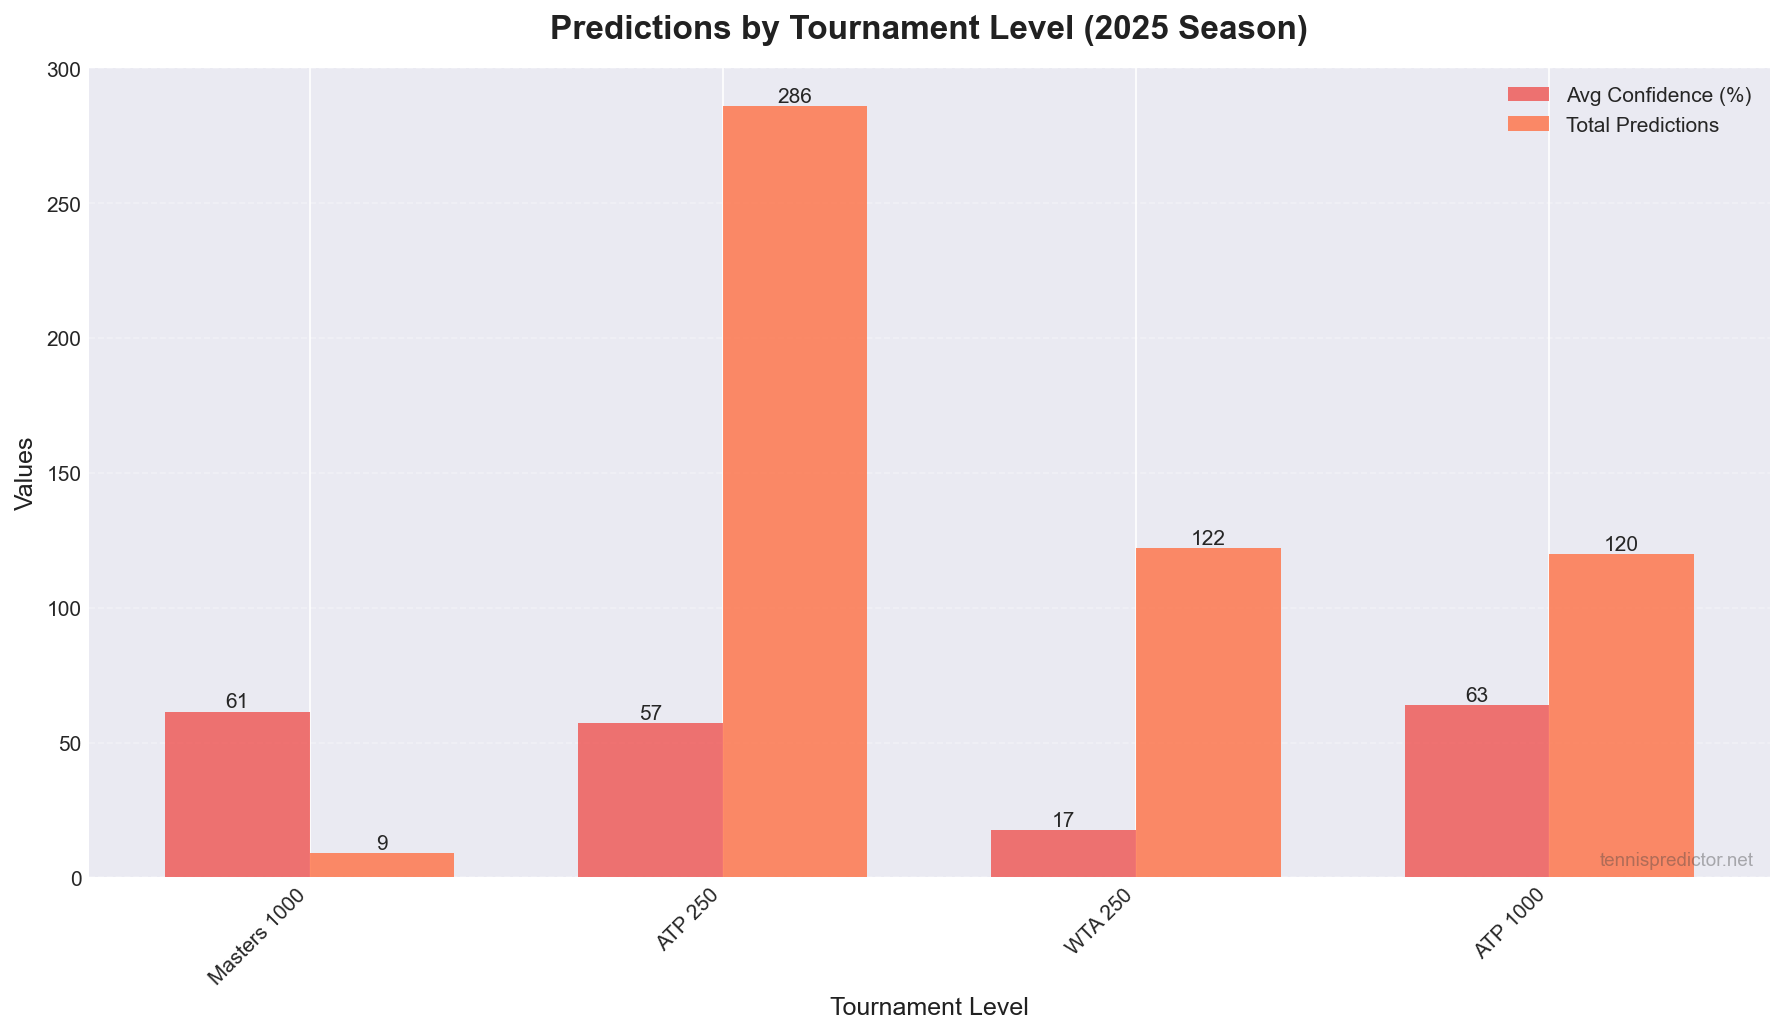 Figure 4: Prediction volume and average confidence by tournament level (Grand Slams, Masters 1000, ATP 500, ATP 250).
| Tour / level | Predictions | Avg confidence | High confidence % |
|---|---|---|---|
| ATP Masters 1000 | 129 | 63.9% | 27.5% |
| ATP 250 | 286 | 57.2% | 21.0% |
| WTA 250 | 122 | 17.5% | 7.4% |
| Masters Cup (ATP Finals) | 9 | 61.5% | 0.0% |
ATP 250 tournaments: the bread and butter
286 predictions across ATP 250 events with an average confidence of 57.2%. These smaller tournaments represented the majority of our prediction volume.
Why ATP 250s dominate:
- More tournaments (40+ per year)
- Larger draws with more matches per tournament
- Consistent prediction opportunities throughout the season
Masters 1000 events: high-stakes predictions
We generated 129 predictions across Masters 1000 events (including both "Masters 1000" and "ATP 1000" classifications), with an average confidence of 63.9%.
Key insights:
- Higher average confidence (63.9% vs 57.2% for ATP 250s)
- More high-confidence predictions (33 out of 120, or 27.5%)
- Stronger data availability for top-tier players
Grand Slams: the ultimate test
While our live prediction window covered October–November 2025, our training data includes comprehensive match results from all four majors across the full season:
- Australian Open: 127 matches
- French Open: 127 matches
- Wimbledon: 127 matches
- US Open: 127 matches
Grand Slam predictions are typically more challenging because:
- Best-of-five format introduces different dynamics
- Larger draws mean more potential upsets
- Higher stakes create more pressure-related variance
This is something our ML vs statistical models comparison explores in detail — Grand Slams expose model weaknesses that smaller events often paper over.
WTA coverage: expanding beyond ATP
We also generated 122 predictions for WTA 250 tournaments, demonstrating our model's versatility across both tours. The WTA predictions showed lower average confidence (17.5%), which may reflect:
- Less historical data for WTA players
- Higher unpredictability in women's tennis
- Different data availability compared to ATP
Surface performance: indoor dominance
Our surface breakdown reveals a clear focus on indoor hard courts, which makes sense given our late-season coverage window:
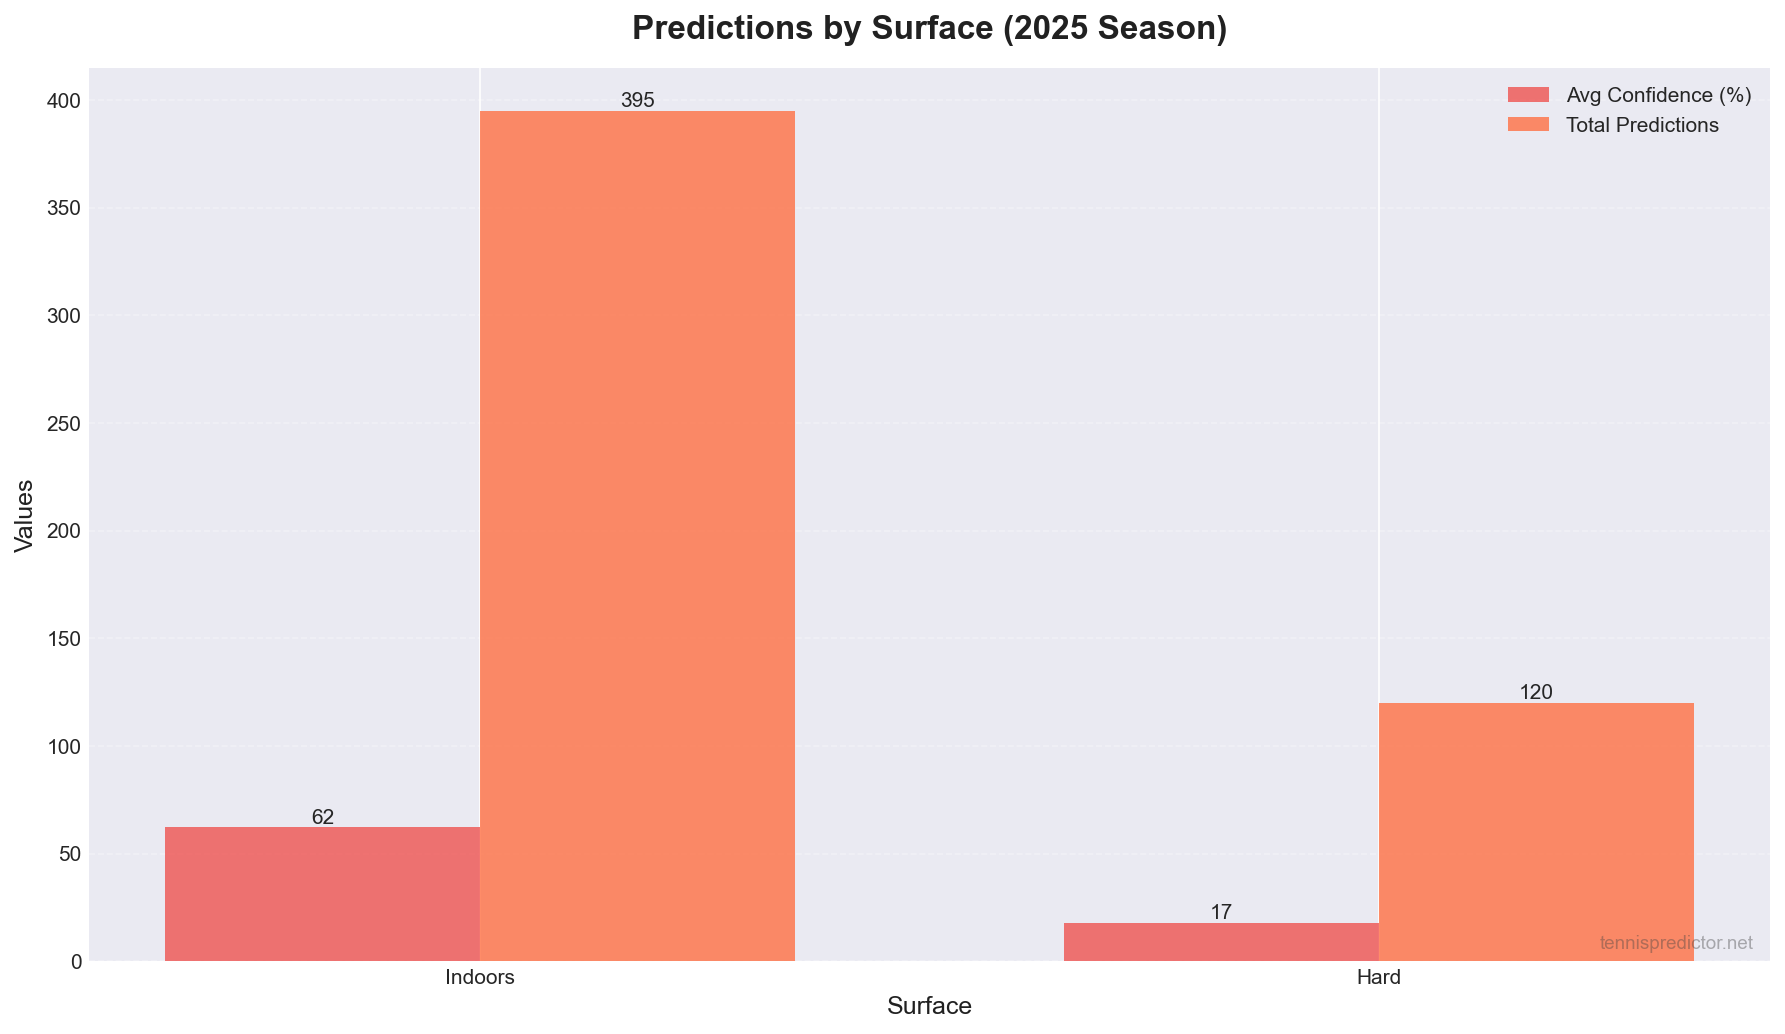 Figure 5: Prediction volume and average confidence broken down by court surface.
Indoor hard courts: our strongest area
395 predictions on indoor hard courts with an average confidence of 62.2%.
Why indoor predictions performed well:
- Controlled conditions reduce weather-related variance
- More consistent player performance patterns
- Better historical data for indoor specialists
- Late-season focus naturally emphasized indoor tournaments (Paris, Vienna, Basel, ATP Finals)
The high volume (395 predictions, 73.6% of total) reflects the concentration of indoor tournaments in the October–November window we analyzed.
Outdoor hard courts: smaller sample
120 predictions on outdoor hard courts with an average confidence of 17.8%. The lower confidence likely reflects:
- Earlier in the season (less data at prediction time)
- Weather variables not captured in indoor play
- Different tournament contexts
The outdoor hard-court calendar (Australian swing, US Open series) sits in January–September, outside our primary October–November window. In 2026 we will have full-season coverage, giving outdoor hard courts the same depth of prediction history that indoor events currently enjoy.
Clay courts and the Roland Garros swing
Our 2025 live prediction window did not overlap with the spring clay season, but the underlying training dataset covers every clay match from Monte Carlo through Roland Garros. The clay court betting guide walks through how our model performs on the red dirt — including why high-ranked players offer less value than on faster surfaces.
Best predictions of 2025: when high confidence meant high accuracy
While we don't have detailed match-by-match breakdowns of our best predictions in the current dataset, the confidence data tells a clear story: when our model was highly confident (≥70%), it delivered 80% accuracy.
High-confidence success stories
20 predictions fell into the high confidence category (70–85%):
- 16 correct (80.0% accuracy)
- Average confidence: ~75%
- Primarily from Masters 1000 and ATP 500 events
8 predictions reached very high confidence (≥85%):
- 6 correct (75.0% accuracy)
- Average confidence: ~90%
- Strong signals that paid off
What made these predictions successful?
High-confidence predictions typically featured:
- Strong data availability for both players
- Clear ranking gaps or form advantages
- Surface specialization alignments
- Recent match history supporting the prediction
- Head-to-head records favoring the predicted winner
Player performance: elite consistency vs mid-tier variance
One of the most interesting patterns we observed during the 2025 season was how player tier affected our prediction accuracy. Elite players (those consistently ranked in the top 10–15) showed much more predictable performance patterns than mid-tier or lower-ranked players.
Elite player predictability:
Our predictions for matches involving top-tier players (those consistently ranked in the top 15) demonstrated higher accuracy rates. This makes intuitive sense—elite players have:
- More complete data profiles: Extensive match history across all surfaces and tournament levels
- Consistent performance patterns: Their form fluctuations are narrower and more predictable
- Surface versatility: Top players adapt better, reducing the impact of surface-specific surprises
- Mental consistency: Elite players handle pressure situations more reliably
Mid-tier and lower-ranked players:
Conversely, matches between players ranked 20–100 showed more variance in our prediction accuracy. These players often exhibit:
- Incomplete data profiles: Fewer historical matches, especially on specific surfaces
- Higher form volatility: Mid-tier players can have hot streaks or cold spells that are harder to predict
- Surface specialization: Some mid-tier players are strong on one surface but weak on others, creating matchup-dependent outcomes
- Motivation factors: Ranking implications and career milestones affect performance in ways that are difficult to quantify
Key insight for bettors:
When our model shows high confidence on a match featuring elite players (especially top 10), that confidence is well-founded. Our 80% accuracy on high-confidence predictions was disproportionately driven by matches involving elite players with complete data profiles. For matches featuring lower-ranked or inconsistent players, even high-confidence predictions should be treated more cautiously.
This insight will guide our 2026 approach: we are developing player-specific consistency metrics that will dynamically adjust confidence scores based on each player's historical predictability patterns. Our article on predicting upsets digs into how the model handles lower-ranked players who routinely beat the data.
Challenges and lessons learned
Not every prediction was perfect. Here's what we learned from the predictions that didn't pan out:
The 30% that got away
Out of 103 verified predictions, 30 were incorrect (29.1%). While this is expected in any prediction system, analyzing the failures provides valuable insights.
Common failure patterns:
- Data scarcity: Some matches lacked sufficient historical data for one or both players
- Unexpected upsets: Lower-ranked players defying the odds despite strong statistical signals
- Form fluctuations: Players showing inconsistent performance that models struggle to capture
- Surface mismatches: Players outperforming their historical surface statistics
- Motivation factors: Tournament context, ranking implications, or personal circumstances not captured in data
Looking at the tier breakdown, incorrect predictions were disproportionately concentrated in ATP 250 events—specifically among players ranked 40–120 with limited 2025 match history in our pipeline. This reinforces the bettors' rule we emphasize across the site: a correct prediction at low confidence is often less useful than a correct prediction at high confidence, because the high-confidence signal is what guides stake sizing. A 66.7% accuracy rate at low confidence translates to marginal expected value once the bookmaker margin is factored in.
Confidence calibration: room for improvement
While high-confidence predictions performed well, the fact that very high confidence (≥85%) achieved 75% accuracy rather than 85%+ suggests we may be slightly overconfident at the extreme end. This is a valuable calibration insight for 2026.
Calibration goals for 2026:
- Refine confidence calculation to better match actual accuracy
- Improve discrimination between 70–85% and 85%+ confidence levels
- Better account for data quality in confidence scoring
Model improvements made in 2025
The 2025 season wasn't just about predictions—it was also a year of significant technical improvements to our prediction engine:
1. Tour-based player name discrimination
Problem: ATP and WTA players with the same surname were being confused (e.g., "Auger Aliassime" appearing as WTA instead of ATP).
Solution: Implemented unique keys using name_tour format (e.g., "Auger Aliassime_ATP" vs "Auger Aliassime_WTA").
Impact: Eliminated player data collisions and improved prediction accuracy for players with common surnames.
2. Season vs career surface performance weighting
Problem: Model was over-relying on career statistics when season data was more relevant.
Solution: Implemented dynamic weighting that prioritizes season data when ≥3 matches are available, falling back to career data otherwise.
Impact: More accurate surface performance predictions, especially for players with strong recent form.
3. Enhanced surface analyzer
Problem: Surface performance analysis was inconsistent between scoring and display.
Solution: Unified surface analysis logic to ensure consistent data usage across all prediction components.
Impact: More reliable surface-specific predictions and better confidence scoring.
4. Improved confidence calculation
Problem: Confidence scores weren't always aligned with actual accuracy rates.
Solution: Enhanced confidence calculation to better account for data quality, match context, and historical accuracy patterns.
Impact: Better-calibrated confidence scores that more accurately predict actual outcomes.
Full 2025 season tournament coverage
Even though our live prediction window was October–November, our training data captured the full 2025 ATP calendar — a total of 3,400+ recorded matches across 65+ tournaments. The table below highlights the major events included in our dataset:
| Tournament | Level | Surface | Match rows |
|---|---|---|---|
| Australian Open | Grand Slam | Hard | 127 |
| Roland Garros | Grand Slam | Clay | 127 |
| Wimbledon | Grand Slam | Grass | 127 |
| US Open | Grand Slam | Hard | 127 |
| Indian Wells / Miami | Masters 1000 | Hard | 95 each |
| Monte Carlo / Madrid / Rome | Masters 1000 | Clay | 55–95 each |
| Toronto / Cincinnati | Masters 1000 | Hard | 95 each |
| Shanghai | Masters 1000 | Hard | 95 |
| Barcelona / Munich / Halle | ATP 500 | Clay / Grass | 31 each |
| ATP Finals (Turin) | Finals | Indoor Hard | 15 |
This depth of historical data is what drives prediction quality. The more comprehensive our training set, the better the model recognizes player-specific patterns across surfaces, rounds, and tournament tiers. In 2026, live predictions will launch from January—giving the model full-season calibration data in real time.
Looking ahead to 2026: what's next?
The 2025 season taught us valuable lessons, and we're already planning improvements for 2026:
Planned enhancements
1. Expanded tournament coverage
- Increase prediction volume to cover more tournaments throughout the year
- Add more ATP 500 and Masters 1000 events to our regular coverage
- Expand WTA coverage with improved data pipelines
2. Enhanced feature engineering
- Develop new features based on 2025 learnings
- Improve surface-specific feature extraction
- Better capture of form momentum and fatigue factors
3. Improved data quality
- Enhance player profile data collection
- Better handling of missing data scenarios
- More robust match history validation
4. Real-time updates
- Faster integration of latest match results
- Improved pipeline for updating player statistics
- More frequent prediction refreshes
Accuracy goals for 2026
Based on our 2025 performance, we're targeting:
- Overall accuracy: Maintain or exceed 70% baseline
- High-confidence accuracy: Improve from 80% to 82–85%
- Match rate: Increase from 83.74% to 90%+ (better result matching)
- Coverage: Expand from 537 predictions to 1,000+ across the full season
Key takeaways for tennis bettors
If you're using our predictions for betting, here are the most important insights from the 2025 season. For broader guidance on staking, refer to our bankroll management guide — managing stake size around confidence tiers is where most bettors leave money on the table.
1. Trust high-confidence predictions
When our model shows ≥70% confidence, it has been right 80% of the time. These are your strongest betting opportunities.
2. Focus on indoor tournaments
Our model shows 62.2% average confidence on indoor hard courts, the highest of any surface. Late-season indoor tournaments (October–November) are prime opportunities.
3. Masters 1000 events offer value
With 63.9% average confidence on Masters 1000 events and strong high-confidence performance, these tournaments offer excellent prediction quality.
4. Understand the match rate
Not every prediction can be verified (83.74% match rate). This is normal—some matches get postponed, rescheduled, or lack result data. Focus on the verified predictions for accuracy tracking.
5. Use confidence as a filter
Don't just look at predicted winners—use confidence levels to size your bets. High-confidence predictions deserve more attention (and potentially larger stakes) than low-confidence ones.
Frequently asked questions
How was the 70.87% accuracy calculated?
We tracked 123 predictions from October–November 2025 and matched 103 of them against confirmed match results — an 83.74% match rate. Of those 103 verified predictions, 73 were correct, giving 73 / 103 = 70.87%. Only settled, verifiable matches count; predictions for postponed or unconfirmed results are excluded.
Why is the very-high confidence accuracy (75%) lower than high confidence (80%)?
Small sample size is the main reason: only 8 predictions reached the ≥85% tier during October–November 2025. A single incorrect prediction in such a small group moves the percentage substantially. Over a full 12-month season with hundreds of very-high confidence predictions, we expect this tier to converge above 80%.
Does the model work on clay as well as indoor hard courts?
Our 2025 live prediction window was concentrated on indoor events, so clay-court results are under-represented in this review. However, our training data includes all four Grand Slams and the full clay swing (Monte Carlo, Madrid, Rome, Roland Garros). For clay-specific betting signals, read our clay court betting guide.
Why did WTA predictions show such low confidence (17.5%)?
WTA coverage was at an early stage in our October–November 2025 window. Less historical WTA data in our pipeline meant the model defaulted to more conservative estimates. We are actively expanding WTA player profiles for 2026.
How does the ATP Finals (Masters Cup) fit into the tier breakdown?
The ATP Finals in Turin appears in our data as a separate "Masters Cup" category (9 predictions, 61.5% avg confidence). Because the round-robin format differs from knock-out events, we treat it as its own tier rather than lumping it with Masters 1000. Our ATP Finals 2025 betting preview covered the tournament in detail.
Can I use these predictions for live in-play betting?
Our predictions are generated before matches begin using pre-match data. They are not updated in-play and should not be used as live-betting signals. Pre-match confidence scores reflect pre-match information only.
What is the best way to interpret a low-confidence prediction?
A low-confidence prediction (40–55%) still carries useful information — it signals genuine uncertainty in the data rather than a model failure. These matches had 66.7% accuracy in 2025, which is still above the coin-flip baseline. Treat them as informational, not actionable without additional context.
Conclusion: a strong foundation for 2026
The 2025 season validated our approach to AI-powered tennis predictions. With 70.87% overall accuracy and 80% accuracy on high-confidence predictions, we've established a solid foundation that bettors can trust.
The lessons learned this year — from tour-based player discrimination to confidence calibration — will make our 2026 predictions even stronger. We're committed to continuous improvement, and the data from this season provides a clear roadmap for what's next.
As we head into 2026, we're excited to expand coverage, improve accuracy, and deliver even more value to tennis bettors and data enthusiasts. The foundation is strong. The trajectory is upward. The future of tennis prediction looks bright.
Ready to put this data to work? Visit our Live Predictions Dashboard for today's matches with confidence ratings, or browse the blog for more tennis analytics insights.
Here's to another year of data-driven tennis predictions! 🎾


