
ATP Finals 2025 betting preview: Turin data deep dive
Published: November 9, 2025
Reading time: 19 minutes
Category: Tournament guides
Why the year-end finals break normal indoor logic
Eight players, round-robin groups, then knockouts under lights. The Nitto ATP Finals in Turin is not “just another indoor 500.” The format forces three elite matchups in a few days, then a knockout path where market favourites behave differently by phase. Treating it like a single-week ATP 250 on fast hard courts is how bettors overpay for chalk early and miss structure late—especially when liquidity and narrative compress prices on the biggest names.
This guide uses reproducible cuts from our ATP training data and a 2022 Turin-era Masters Cup slice for phase-specific favourite behaviour. Numbers below come from the same stats audit we ship with this article (player rows: 1 January 2023 – 9 November 2025 unless noted). For how we turn rows into probabilities in general, see how our AI predicts tennis matches. For price versus probability, read value betting in tennis: a beginner’s guide.
Scope honesty: the 2025 entry list and exact round-robin draw were still moving when we froze this extract on 9 November 2025 (preview week). The player table therefore reflects likely Turin-calibre names from that race snapshot, not a guarantee that every row will match the final eight. The phase statistics are historical (2022 event window in-file). When you bet live, always prefer current odds and current injury news over any preview PDF.
Turin format: what actually changes the board
Round-robin means everyone gets multiple bites; a bad hour does not always end the week. Knockouts mean one flat day sends you home. Markets know this, but retail narratives often still price “name value” as if the whole event were one long knock-out.
Practical implication:
- Group nights can stay volatile even when both players are top ten—there is less “survival” pressure than Saturday night of a Slam.
- Once the bracket is single elimination, favourites historically stabilise in our Turin-era sample (details below).
That split is why we separate group-stage pricing instincts from semi-final and final pricing instincts.
Round-robin math for bettors: you are not solving a single elimination tree on Monday. You are solving conditional paths: a player can lose a match and still advance, or win twice and still depend on tie-break rules. Markets sometimes flatten those nuances into moneyline hype. Your job is to ask whether this price already embeds path risk—especially for players whose elite conversion is thin (see the big table).
Knockout math: once the weekend arrives, the event behaves more like a normal elite indoor tournament: one bad set can end the week. The 2022 phase split in our file (higher favourite hit rate in semis/final than in groups) is consistent with that shift in pressure—even though the sample is small.
Phase favourites: what the 2022 Turin-era rows show
We isolate Masters Cup ATP matches in our table that fall in the 2022 Nitto ATP Finals window. The slice is small (fifteen matches)—use it as directional, not as a law of large numbers.
| Metric | Value |
|---|---|
| Matches in slice | 15 |
| Calendar span (rows) | 13 Nov 2022 – 20 Nov 2022 |
| Market favourite win rate (all phases) | 53.3% |
| Round-robin “upset” rate (favourite lost) | 50.0% |
| Semi-final / final favourite win rate | 66.7% |
| Average implied-probability sum (overround proxy) | 1.048 (~4.8% overround) |
So: half of round-robin matches in that file saw the pre-match favourite lose—consistent with treating group nights as high-variance for chalk. In semis and finals, the same favourite label hit about two-thirds of the time. That pattern is exactly why bankroll discipline matters: paying heavy juice on short group favourites can still fail often enough to hurt once margin is included (bankroll management).
How to read the 53.3% “all-phase” favourite win rate: it is not the same as the group upset rate. It blends group, semi, and final rows together across fifteen matches—so it will not match either sub-phase rate exactly. Use the phase-specific lines (50% RR upset rate vs 66.7% SF/F favourite hit rate) when you tell yourself a story about which part of the week you are betting.
Margin reality: an average implied sum of 1.048 is a useful reminder that even “fair” prices are not offered at zero margin. Any edge you think you have must survive both randomness and vig.
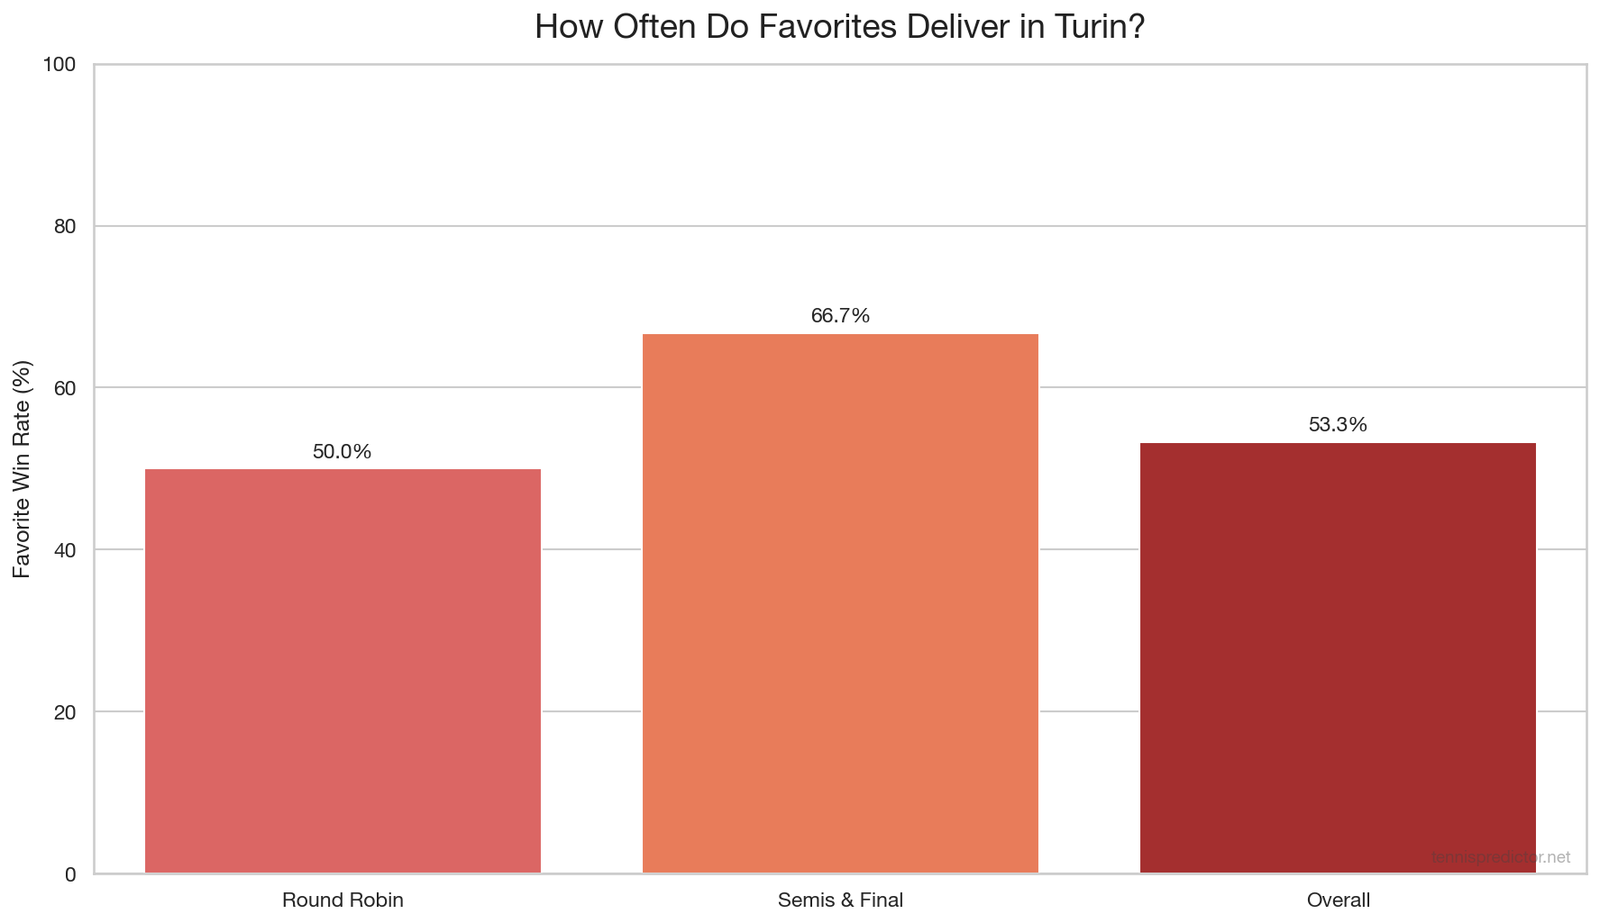
Figure 1: Favourite outcomes by tournament phase in our 2022 Masters Cup rows.
What this does not mean:
- It does not prove the 2025 draw will replicate 2022 bounce patterns point for point.
- It does mean “indoor hard + elite field + round-robin” is a different risk profile than a one-off indoor quarter-final.
Player dashboard: the 2025 field in one table
The table aggregates per-player statistics from our training extract for 2023 through the November 2025 pull date. Indoor counts can be thin for some players—when n is small, rank moves a few percentage points easily.
| Player | Matches | Win % | Indoor | vs top 10 | Late rounds | Avg rest (d) | First-set feature* |
|---|---|---|---|---|---|---|---|
| Alcaraz | 195 | 87.7% | 100.0% (5/5) | 80.0% | 80.0% | 5.47 | 0.788 |
| Sinner | 193 | 85.5% | 86.7% (13/15) | 70.5% | 72.9% | 5.66 | 0.702 |
| Djokovic | 132 | 81.8% | 73.7% (14/19) | 57.1% | 55.2% | 8.62 | 0.735 |
| Medvedev | 194 | 74.2% | 80.0% (8/10) | 53.1% | 52.9% | 5.53 | 0.702 |
| Zverev | 203 | 72.4% | 50.0% (1/2) | 32.3% | 40.6% | 6.12 | 0.606 |
| De Minaur | 176 | 70.5% | 73.3% (11/15) | 24.1% | 61.9% | 6.22 | 0.612 |
| Fritz | 185 | 70.3% | 60.0% (3/5) | 37.5% | 48.1% | 5.83 | 0.637 |
| Ruud | 156 | 66.7% | 71.4% (5/7) | 52.9% | 60.9% | 7.15 | 0.611 |
| Shelton | 158 | 62.0% | 60.0% (3/5) | 20.0% | 46.7% | 7.44 | 0.506 |
| Auger-Aliassime | 140 | 58.6% | 66.7% (10/15) | 40.9% | 47.1% | 7.68 | 0.536 |
*The first-set feature is a model-derived composite (0–1) averaged over the player’s rows—higher means stronger historical first-strike signals in our features. It is not the same thing as live win probability.
Reading indoor percentages carefully: indoor match counts range from 2 (Zverev) to 19 (Djokovic). A 50% indoor label on two matches is not comparable to 86.7% on fifteen. When indoor n is tiny, lean on hard-court and top-ten columns for stability, and treat indoor as supporting evidence only.
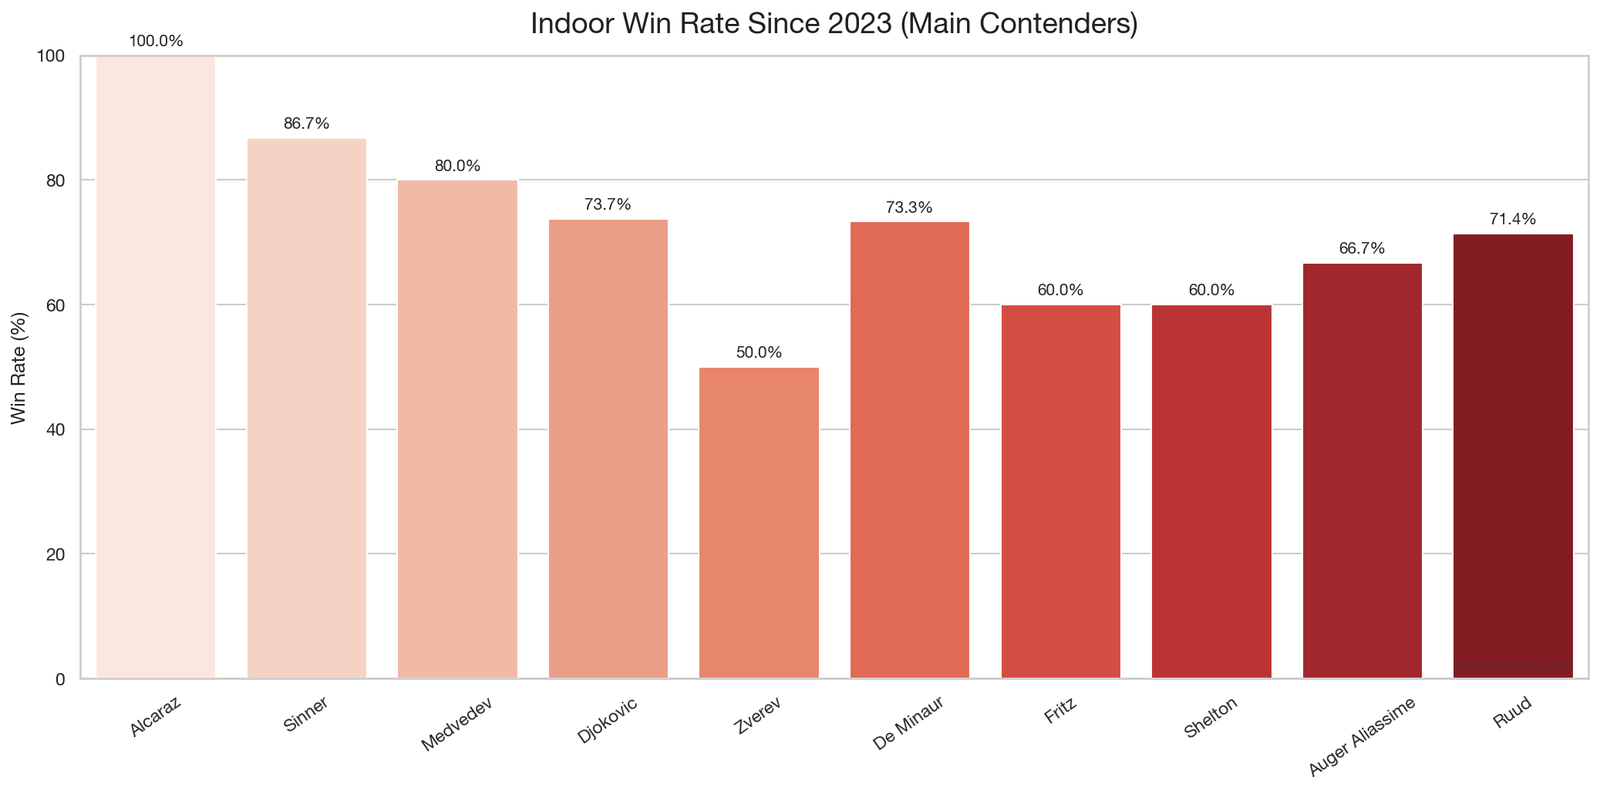
Figure 2: Indoor win percentage in the sample window (read counts from the table—small samples move fast).
How to read the tiers without fooling yourself
Elite conversion (vs top 10) is the column that usually matters most in Turin-style fields, because almost every session pairs two high-ranked opponents.
Upper band (roughly 70%+ vs top 10 in this window):
- Alcaraz and Sinner sit at the top of the overall win-rate stack; Alcaraz’s top-10 split is highest in the table. Sinner’s indoor volume (15 matches) is more informative than a tiny indoor sample.
- Djokovic combines respectable top-10 output with meaningful indoor volume (19 matches).
Mid band:
- Medvedev brings a strong indoor rate on 10 matches but a late-round win rate near 53%—useful context for “can he close a deep week?” questions.
- Zverev, De Minaur, and Fritz show top-10 rates under 40% in this extract. That does not make them “bad”; it means upset equity against the very best is the live question—exactly what round-robin exposes.
Lower band on elite hit rate:
- Shelton’s 20% vs top 10 on 20 tries is the cleanest “power without elite consistency” profile in the table—exciting for single matches, expensive for tournament-long narratives unless the draw cooperates.
We intentionally do not publish a fake “title probability %” here. The dashboard turns today’s prices and today’s features into numbers; a blog table is context, not a substitute for live calibration.
Sinner vs Alcaraz (how the table differs): Sinner leads on matches played and hard-court workload in this window; Alcaraz leads on top-ten conversion and the first-set composite. Neither line “wins” the article by itself—Turin matchups are head-to-head problems, not spreadsheet races. If they land in the same group, pricing will tighten; your edge, if any, comes from mispriced conditionals, not from chanting surface labels.
Medvedev and Djokovic as contrasts: Medvedev posts a strong indoor rate on 10 matches but a late-round win rate near 53%—useful when you ask whether a player’s week-long level holds. Djokovic’s top-ten rate is mid-pack here, but his indoor sample is larger than many—good for surface priors, not for automatic “pick Djokovic” buttons at any price.
Why top-10 conversion shows up everywhere in Turin previews
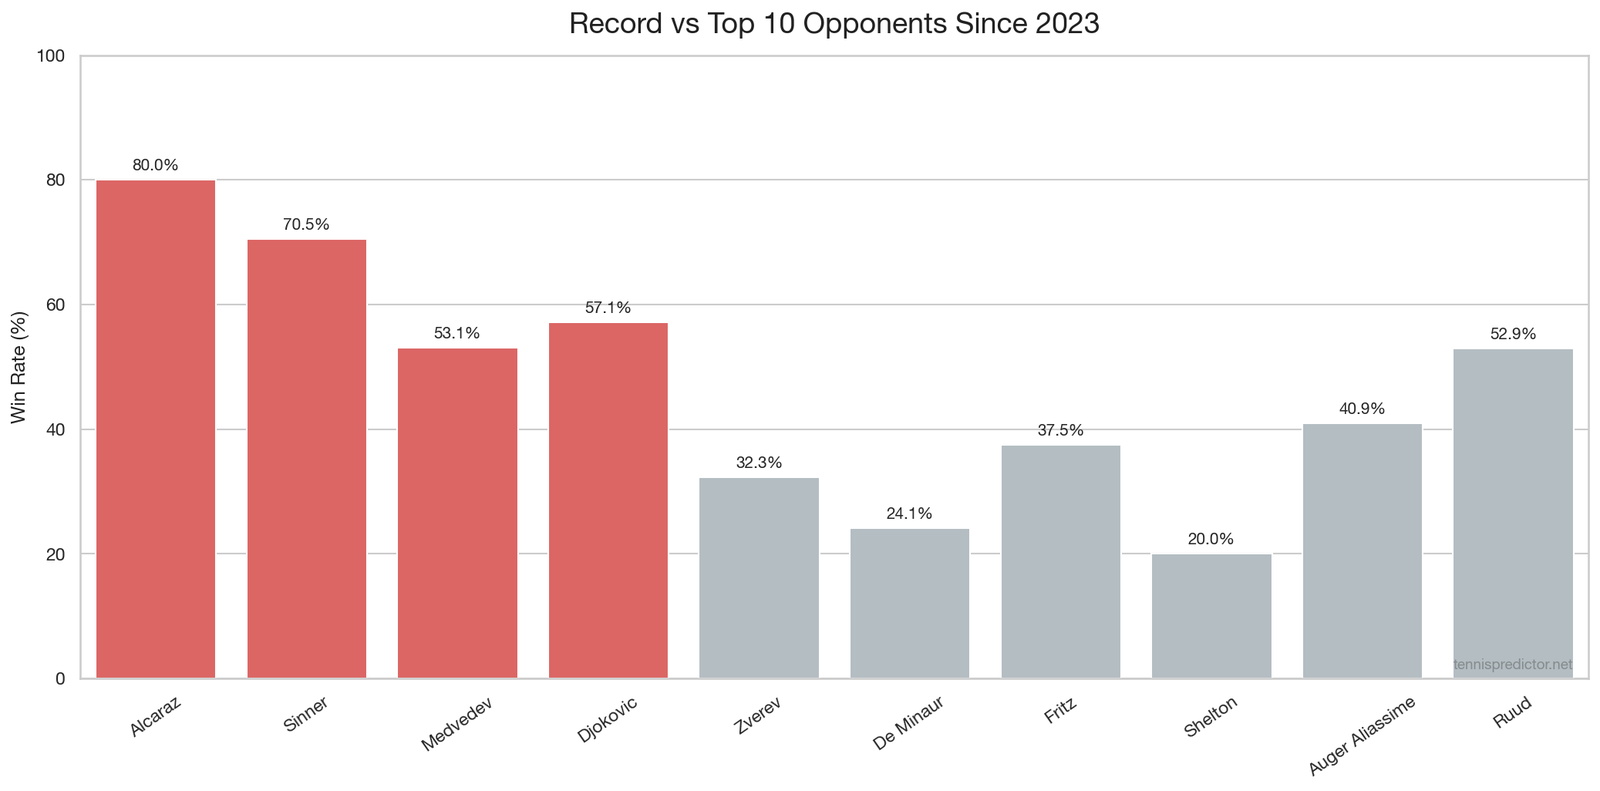
Figure 3: Win rate against top-10 opponents (same window as the table).
Group play schedules multiple top-ten collisions in a short window. If your outright story depends on a player who rarely beats top-ten opponents in the historical slice, you are not arguing with “haters”—you are arguing with conditional frequencies.
How we use the chart with pricing:
- Compare your fair win chance to implied odds—if you cannot explain why the gap exists, you probably do not have an edge (value betting primer).
- Treat tie-break variance as a separate risk: two players with similar top-ten rates can still produce high-variance scorelines indoors.
Common mistake: ranking players by overall win rate alone. In a YEC field, almost everyone has a strong overall record—they qualified. The more discriminating question is often who beats elites at a credible frequency, not who padded wins in February against lower-ranked opponents.
Rest, rhythm, and lead-in noise
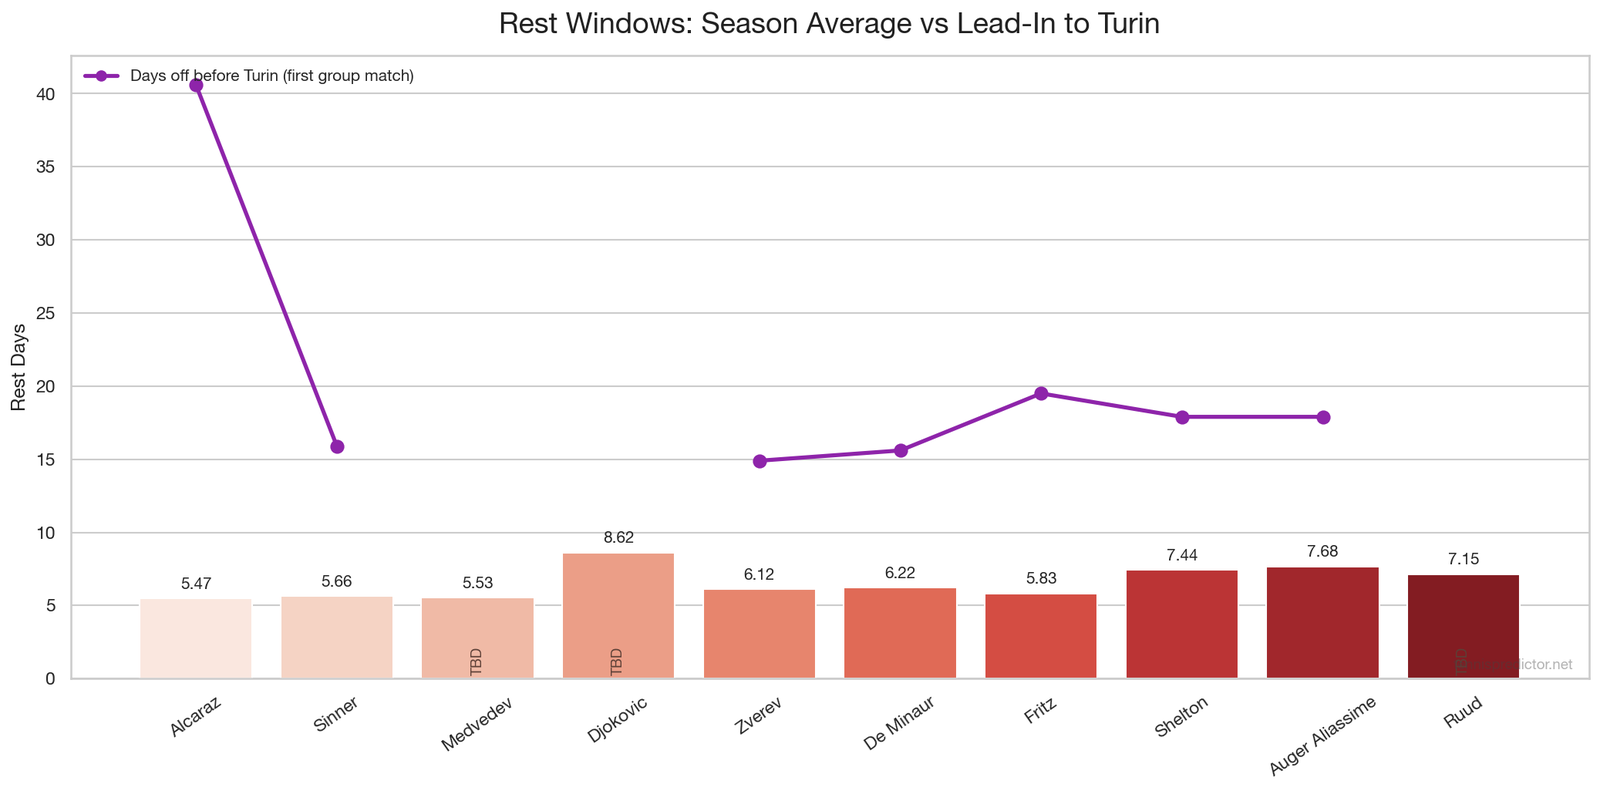
Figure 4: Average rest between matches (bars) and days before first scheduled Turin session where available (schedule snapshot at extract time).
Season-average rest (rolling days between matches) is not the same as “freshness.” A long average can mean fewer deep runs, not more spa days.
From the audit:
- Shelton has the longest average gap between matches (7.44 days)—often consistent with selective scheduling rather than guaranteed freshness.
- Alcaraz and Medvedev show the tightest typical spacing (~5.5 days)—common for players who routinely reach late rounds at big events.
- Lead-in to Turin (days since previous scheduled match in our feed) was 40.6 for Alcaraz and roughly 15–20 for several others in the November snapshot; some players were still TBD in the feed when we pulled data—do not treat stale schedule gaps as live injury signals.
Markets sometimes over-index “tired” narratives after Paris. Our data only supports a narrow point: extreme short turnarounds hurt; moderate gaps are normal at this level.
What we are not doing: we are not claiming a causal “rest regression” model in this article. Rest fields are descriptive inputs that modellers blend with form, opponent, and prices. If a player’s rest cell looks extreme, use it as a prompt to verify travel and practice reporting—not as a standalone bet signal.
First-set signals: composite feature, not a magic button
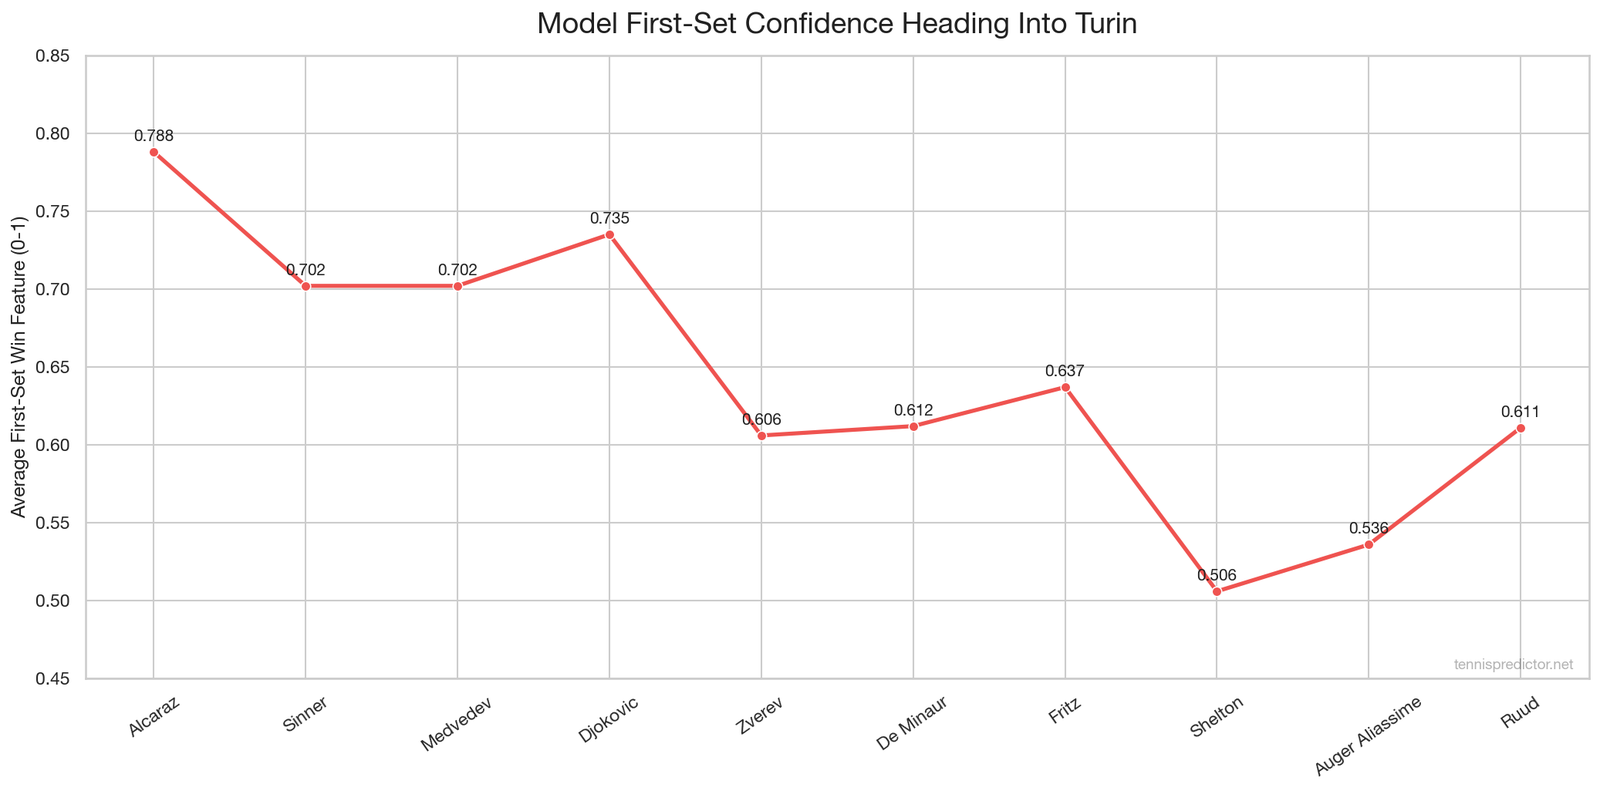
Figure 5: Average first-set-related feature strength (0–1) by player.
The first-set feature is an internal composite built from serve pressure, short-point tilt, and related history in our feature pipeline. Separately, tour-wide descriptive work shows that first-set winners often take the full match at a high rate in large ATP samples—see the discussion in best tennis markets to bet. That population fact is not the same as “this player’s first-set price is automatically value.”
Reading the chart with the table:
- Alcaraz and Djokovic lead the first-set feature averages; Sinner is close behind.
- Shelton is the only qualifier in this table below 0.55 on the composite—consistent with boom-or-bust indoor paths.
For a deeper market-by-market framing (including how first-set and match outcomes relate descriptively), use the markets article above rather than overstating any single scalar here.
Live betting discipline: if you trade in-play, decide in advance whether you are betting information (you saw something real) or adrenaline (you want action). The first-set scalar is a prior, not a live injury sensor.
A sane betting workflow for Turin
Before you click:
- Separate group-stage and knockout instincts using the phase table—do not import Wimbledon knockout habits wholesale.
- Check top-10 conversion before you ladder long-shot outrights—conditional elite performance matters more than generic “he’s improved” stories.
- Size down when you are really betting variance (tie-breakers, tiny indoor samples) rather than edge.
Outrights versus match-by-match: pre-event winner markets can be efficient because liquidity is high and narratives are loud. Match markets sometimes offer cleaner mispricings because they reset nightly with new information. You do not have to choose one approach forever—but you should know which question you are answering with each ticket.
During the week:
- Re-check prices against updated health and schedule facts—our numbers are frozen to the extract date in this article.
- Prefer process over story: if you cannot write down why the price is wrong, you are usually trading entertainment for EV.
What serious bettors still do:
- Keep a stake cap per session—Turin’s schedule packs prime-time matches back-to-back, which encourages tilt after a bad beat (bankroll management).
- Write down one sentence of thesis per bet: which input disagrees with the market—form, matchup, surface, or price?
- Avoid correlated parlays that duplicate the same uncertainty (for example stacking multiple heavy favourites without understanding dependence).
Frequently asked questions
Is the 2022 Turin slice large enough to trust?
It is small (15 matches). It is useful for illustrating phase effects (group vs knockout) inside our data model, not for claiming exact 2025 percentages. Think of it like a weather radar still: directionally informative, not a millimetre-accurate forecast for next Tuesday.
Why do you show both 2022 phase stats and 2023–2025 player stats?
Different questions. Phase stats address tournament structure in one Nitto week. Player stats address who arrives with what recent elite form in our training window. Mixing them blindly is how social-media graphics accidentally compare apples (event mechanics) to oranges (season-long form).
Which column should I weight for outrights?
There is no universal answer. Most bettors overweight overall win rate and underweight vs top 10 in elite-only events—so start by stress-testing your pick against the top-10 column. If your outright story cannot survive that column, it is usually a narrative bet, not a pricing bet.
Alcaraz is 100% indoor in the table—is he “invincible” indoors?
No. It is 5–0 in the window—tiny. The more important numbers are often volume on hard and top-ten results, not a five-match indoor streak. A short undefeated stretch can flip to one bad indoor week the moment sample variance catches up.
What does the first-set feature actually measure?
A weighted blend of first-strike-related inputs in our model—not a published ATP stat, not a guarantee for live betting. It is best read relative to the rest of the field (who sits higher on the composite) rather than as a literal “0.788 means 78.8% to win set one.”
What does “upset rate 50%” in 2022 groups mean?
Among the round-robin rows in our 2022 Masters Cup file, the pre-match favourite lost half of those group matches. That is descriptive of that slice, not a forecast for a future draw. Favourite labels also depend on which book line you treat as canonical.
How should I use the overround number?
An implied-probability sum of 1.048 means roughly 4.8% total margin baked into the average price set in that slice—you still need per-match prices for real trading. Overround also varies by book and market; the table is a single-number summary, not a substitute for shopping lines.
Does TennisPredictor publish live Turin probabilities?
The predictions dashboard is the place for current outputs. This article is a static snapshot tied to the November 2025 extract. If you are reading after the event, treat tables as historical context unless you regenerate them from a newer training pull.
Why are some “rest before Turin” fields null?
The schedule feed did not yet pin every player’s first Turin session when we pulled data—null means “not available in the extract,” not “infinite rest.” Always verify official scheduling if rest is central to your thesis.
Can I copy these percentages into my spreadsheet as true probabilities?
No. They are historical summaries and feature averages. Convert odds to implied probabilities, compare to your model or a disciplined heuristic, then decide (value betting guide). Copy-pasting win rates as if they were fair prices is one of the fastest ways to confuse skill with story.
Where do I read more about first-set markets?
Start with best tennis markets to bet and the dedicated first-set piece linked from there.
Why is Zverev’s indoor rate 50% on two matches?
Because two indoor matches is not a stable estimator. The table is honest about sample size; your brain should be too. Lean on hard and top-ten lines for Zverev unless you have a separate indoor-specific process.
Does a high late-round win rate guarantee a deep Turin run?
No. Late-round here means semi-finals and finals of tournaments in the extract window—it is not identical to “ATP Finals knockout success.” It is a rough stamina and closers proxy, not a crystal ball.
What changed between this article and an older Turin preview?
If we refreshed text, the publication date in the site’s article metadata should remain the original first publish unless we are correcting an error—see project audit rules. Content can be revised without pretending the piece was “born yesterday.”
Nitto ATP Finals: what the event rewards (and what it punishes)
The Finals reward consistency across different elite matchups more than a single heroic win. A player who can split sets with three different top-ten styles in four days is often more valuable to a round-robin path than a player who crushes weaker opponents but stalls when returning against compact defence or elite depth.
Serve-plus-one indoor tennis still matters: short points reduce exposure to extended rallies where return quality shows up. But returning at a tour-average level is rarely enough when every opponent serves well enough to force tie-break maths. That is why top-ten conversion and late-round performance show up so often in serious previews—they proxy problem-solving against the best versions of the sport.
Psychology is real but not quantified here. Our tables do not include a “clutch” column because unforced definitions become storytelling. If you believe a player’s mental edge is underpriced, you still need to translate that belief into a number (even a wide interval) and compare it to implied odds—otherwise you are doing fan fiction with a spreadsheet nearby.
Correlation warning: several columns in the player table move together—overall win rate and late-round performance are not independent. That is fine for human scouting, but it is why you should not “sum edges” naively across correlated signals as if they were separate bets.
If you only remember one lesson from this piece, make it this: Turin is a small-data event in places (phase sample, thin indoor counts), but a big-decision event for bankrolls. Use tables to discipline stories, not to replace today’s prices—and when samples are tiny, widen your uncertainty bands before you widen your stakes.
Related articles
- How our AI predicts tennis matches with 70%+ accuracy
- Value betting in tennis: a beginner’s guide
- Bankroll management: the key to long-term betting success
- Best tennis markets to bet: match winner vs set betting vs games
Data transparency
Player aggregates: January 1, 2023 through November 9, 2025, from our ATP training extract (same pipeline as site models). Masters Cup phase metrics: 2022 Nitto ATP Finals dated rows in that extract. Charts: generated from the companion stats audit for this article; watermarks on all figures. Djokovic indoor wins: verification notes a manual cross-check against ATP logs where the raw table under-counted indoor events—indoor totals in the audit reflect that correction.
Favourite labels in phase stats use the model’s player1 side implied probability versus player2 in each training row; “favourite” means higher implied probability in-file, not necessarily the ATP seed line you remember from TV.
Rounding: percentages in prose may differ by 0.1 from a strict division on raw counts due to rounding—when in doubt, trust the published audit counts and recompute.
If you refresh the training extract in a future season, re-run the stats pipeline and regenerate figures so tables and images stay aligned. Until then, treat this page as a frozen November 2025 reference, not a live trading terminal.


