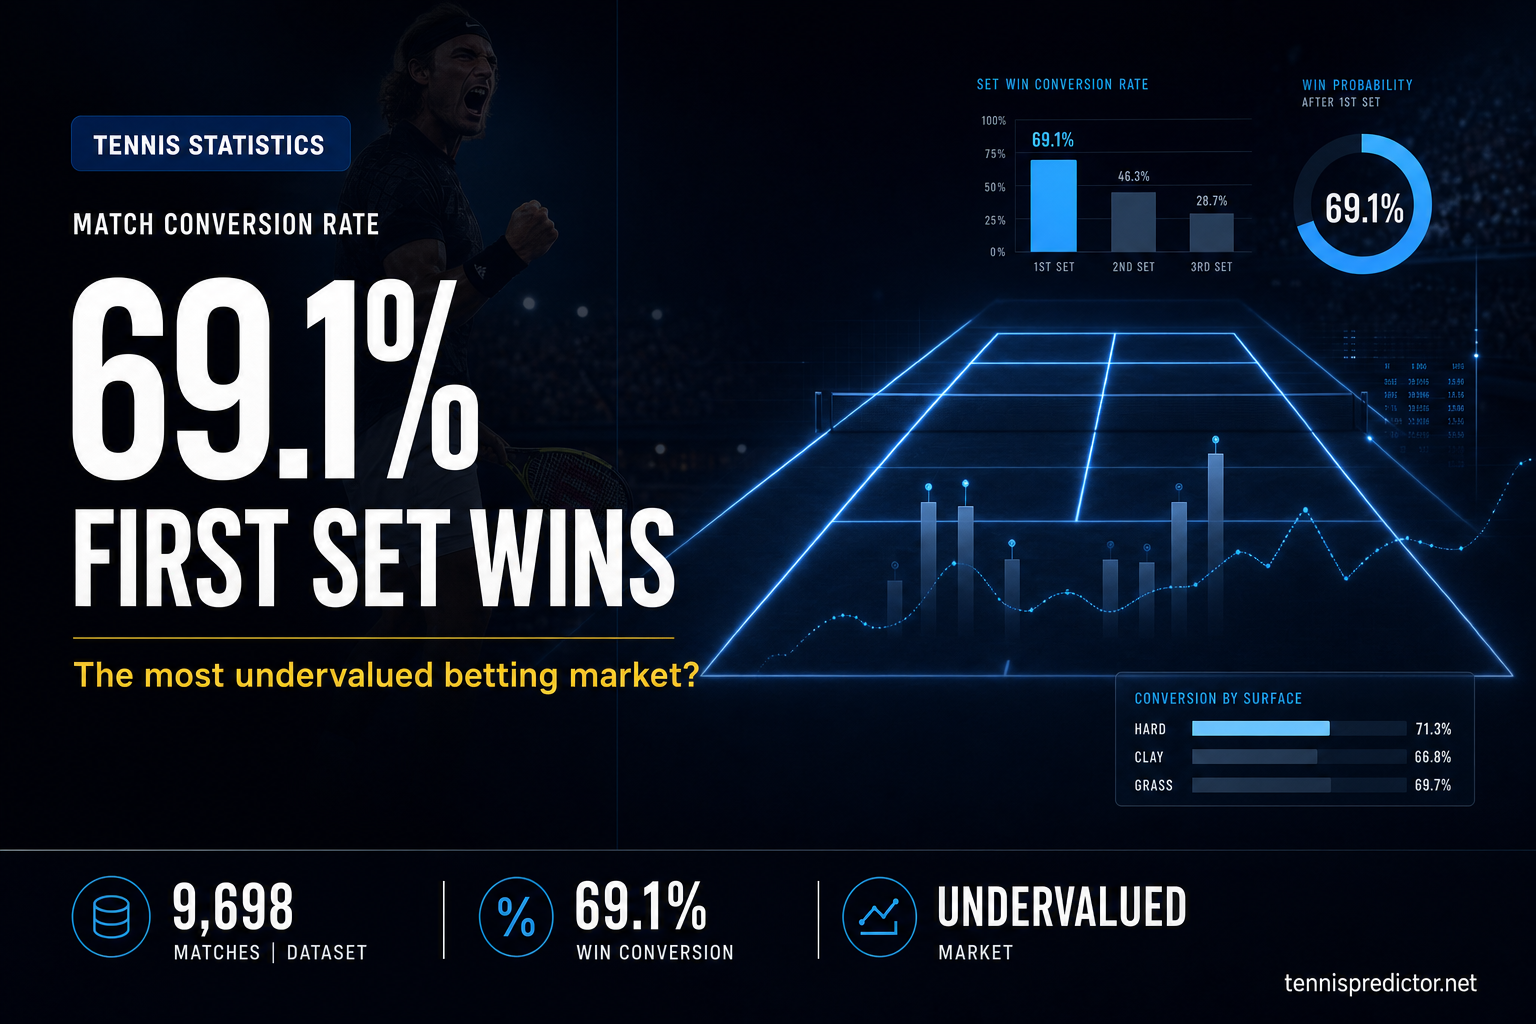
First set wins: the most undervalued betting market?
Key data at a glance
These aggregates come from our tournament match database (ATP, 2022–2025). They anchor the charts below.
| Topic | Sample | Headline figure |
|---|---|---|
| Match winner / odds bands | 9,705 matches | Favourite conversion varies by price bucket (see chart 1) |
| Set length (best-of-three) | Full sample | ~63% straight-set / ~37% three-set split (chart 2) |
| Total games by surface | 9,619 scored matches | Grass highest average games; indoor lowest (chart 3) |
| First set → match | 9,698 matches | 69.1% of first-set winners win the match (chart 4) |
| Live & efficiency | Qualitative + chart 6 | Liquidity vs edge framework (charts 5–6) |
If you read an older version of this guide, focus on method (how to weigh markets) more than tiny percentage moves: the database grows as we add matches, but the rank ordering of ideas—liquidity on moneyline, momentum in set one, variance on score—has been consistent.
Match winner (moneyline)
The match winner market—moneyline or “outright”—is the default: back either player to win the match.
Splits by pre-match odds band
From 9,705 ATP matches with usable prices:
- Heavy favourites (odds ≤1.50): 4,419 matches, 49.3% win rate (for the side in this bucket—see chart 1 for the exact definition used in aggregation).
- Medium odds (1.51–2.50): 3,857 matches, 51.1% win rate
- Underdogs (odds >2.50): 1,429 matches, 49.3% win rate
How to read this: the chart compares how often the priced side in each bucket converted in our historical files. The bands are useful for seeing dispersion across the market—not for treating any single percentage as a universal “favourite win rate” without context.
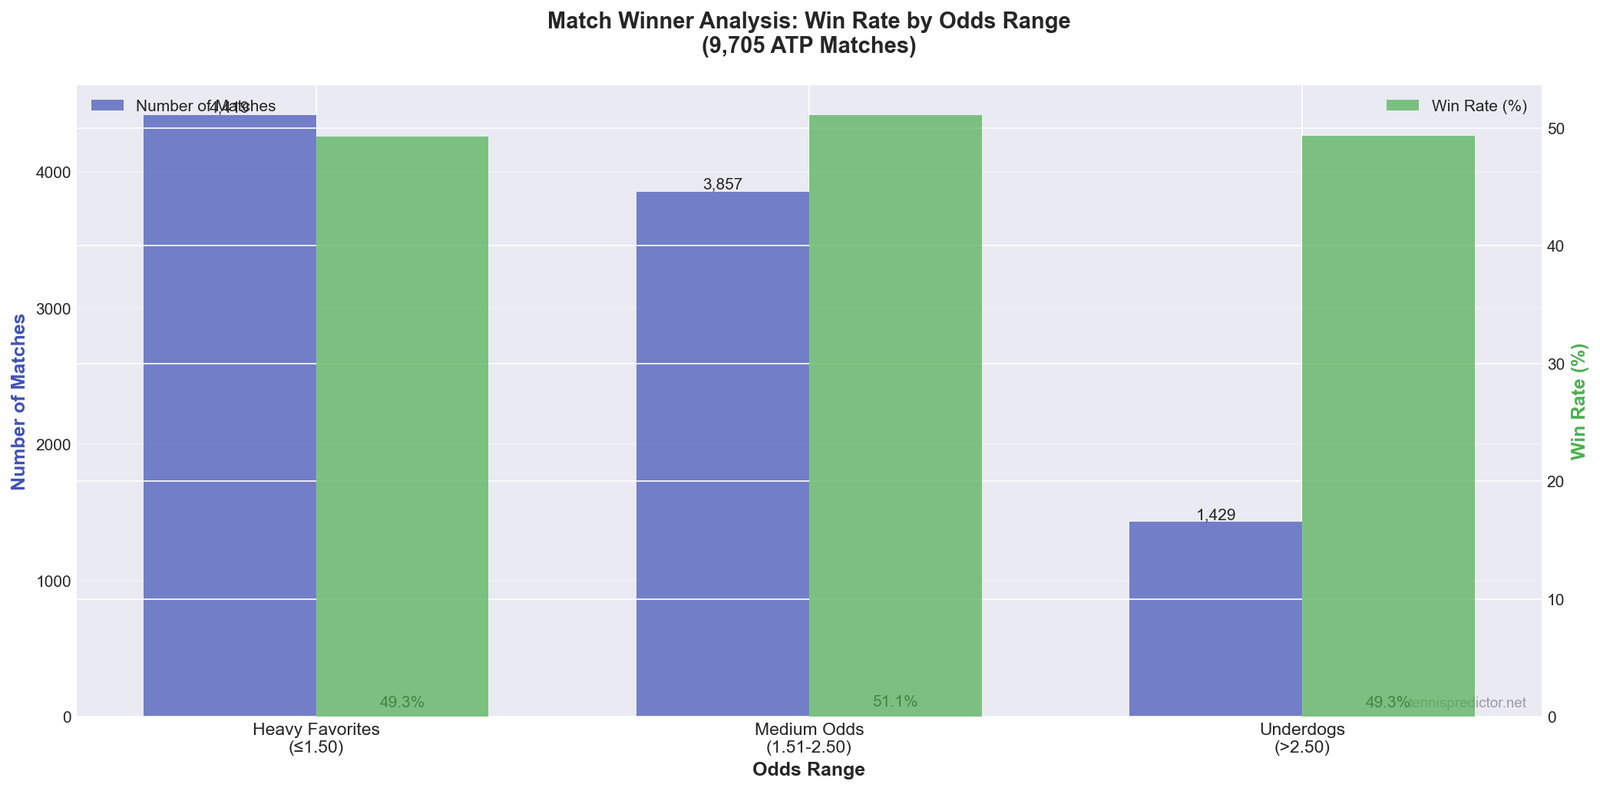
Figure 1: Win rates by odds range across the ATP sample underlying this article.
Surface and favourite conversion
Favourite-side win rates by surface (same database):
- Clay: 51.6% (3,074 matches)
- Hard: 49.3% (4,355 matches)
- Grass: 49.2% (1,215 matches)
- Indoor: 49.9% (900 matches)
Clay shows a modest tilt toward chalk versus other surfaces—consistent with longer rallies and fewer cheap service holds.
When moneyline makes sense
Strengths:
- Easiest to explain and to size (one binary outcome).
- Usually the deepest liquidity and tightest lines.
- Natural starting point for learning implied probability and closing-line value.
Weaknesses:
- Everyone bets it—edges are small unless your read is genuinely different from the market.
- Public money can move favourites on big names even when the price is already fair.
Best fit: new bettors, anyone building a staking plan (bankroll management), and models that already output a full-match probability you trust.
Implied probability in one minute
Decimal odds convert to break-even win rate as 1 ÷ odds. A 2.00 price needs 50% true chance to break even before margin; 1.50 needs 66.7%. Moneyline is where that math is easiest to sanity-check—if your fair probability is 58% and the book offers 1.72 (about 58% implied), there is no structural edge; you need either a better model or a better price.
Liquidity and line movement
Major ATP events see tighter moneylines because limits are higher and syndicates trade them. Smaller 250s can show wider spreads between books. If you bet match winner seriously, track closing line value over time: are you beating the number that the market settles on? That habit matters more than any single pick.
Set betting and correct score
Set markets ask how a match is won: straight sets, three sets, or an exact scoreline.
Straight sets vs three sets
Across best-of-three ATP matches in our data:
- Straight sets (2–0): about 63% of matches
- Three-set (2–1 or 1–2): about 37%
That split is a structural fact about tour length—not a promise for Tuesday’s quarterfinal.
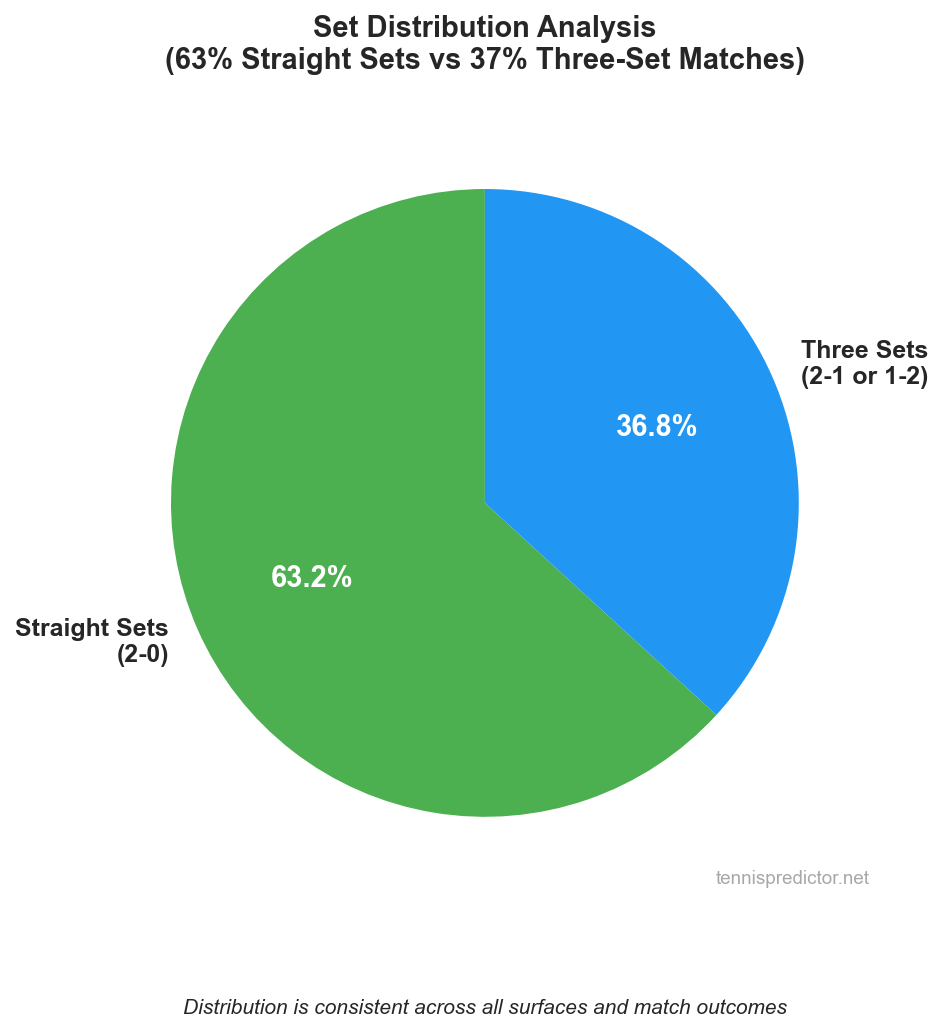
Figure 2: Two-set vs three-set mix in the training-era sample.
Where set betting helps
- Finals and late rounds often tighten—more three-setters than early rounds against qualifiers.
- Style mismatches (big server vs grinder) move the 2–0 vs 2–1 balance.
Trade-offs: higher odds than moneyline, but more variance and thinner liquidity on exotic correct scores.
Correct score and scorepath risk
Exact scorelines (e.g. 6–4, 6–3) carry enormous variance: two early breaks change everything. Most bettors should treat correct-score bets as small stakes or learning exercises until they have a repeatable way to estimate service-hold rates and tiebreak frequency for the specific pairing.
Best-of-five note
This article’s set counts focus on best-of-three ATP matches in our core training files. Grand Slam men’s draws (best-of-five) change set and games distributions—use Slams-specific research when you bet those weeks, not generic tour averages.
Total games (over/under)
Totals ask whether the match will exceed a games line (e.g. 22.5)—independent of who wins if you structure it that way at the book.
Average games by surface
From 9,619 ATP matches with parseable game totals:
| Surface | Matches | Avg games | Min–max (sample) |
|---|---|---|---|
| Grass | 1,199 | 29.2 | 10–60 |
| Hard | 4,418 | 25.9 | 10–81 |
| Clay | 3,034 | 24.8 | 10–68 |
| Indoor | 968 | 23.3 | 11–90 |
Grass shows the highest average games in this sample—often driven by hold-heavy sets and tiebreaks—while indoor, in these files, prints the lowest average. Always cross-check line + surface + player before staking; the table is a baseline, not a pick.
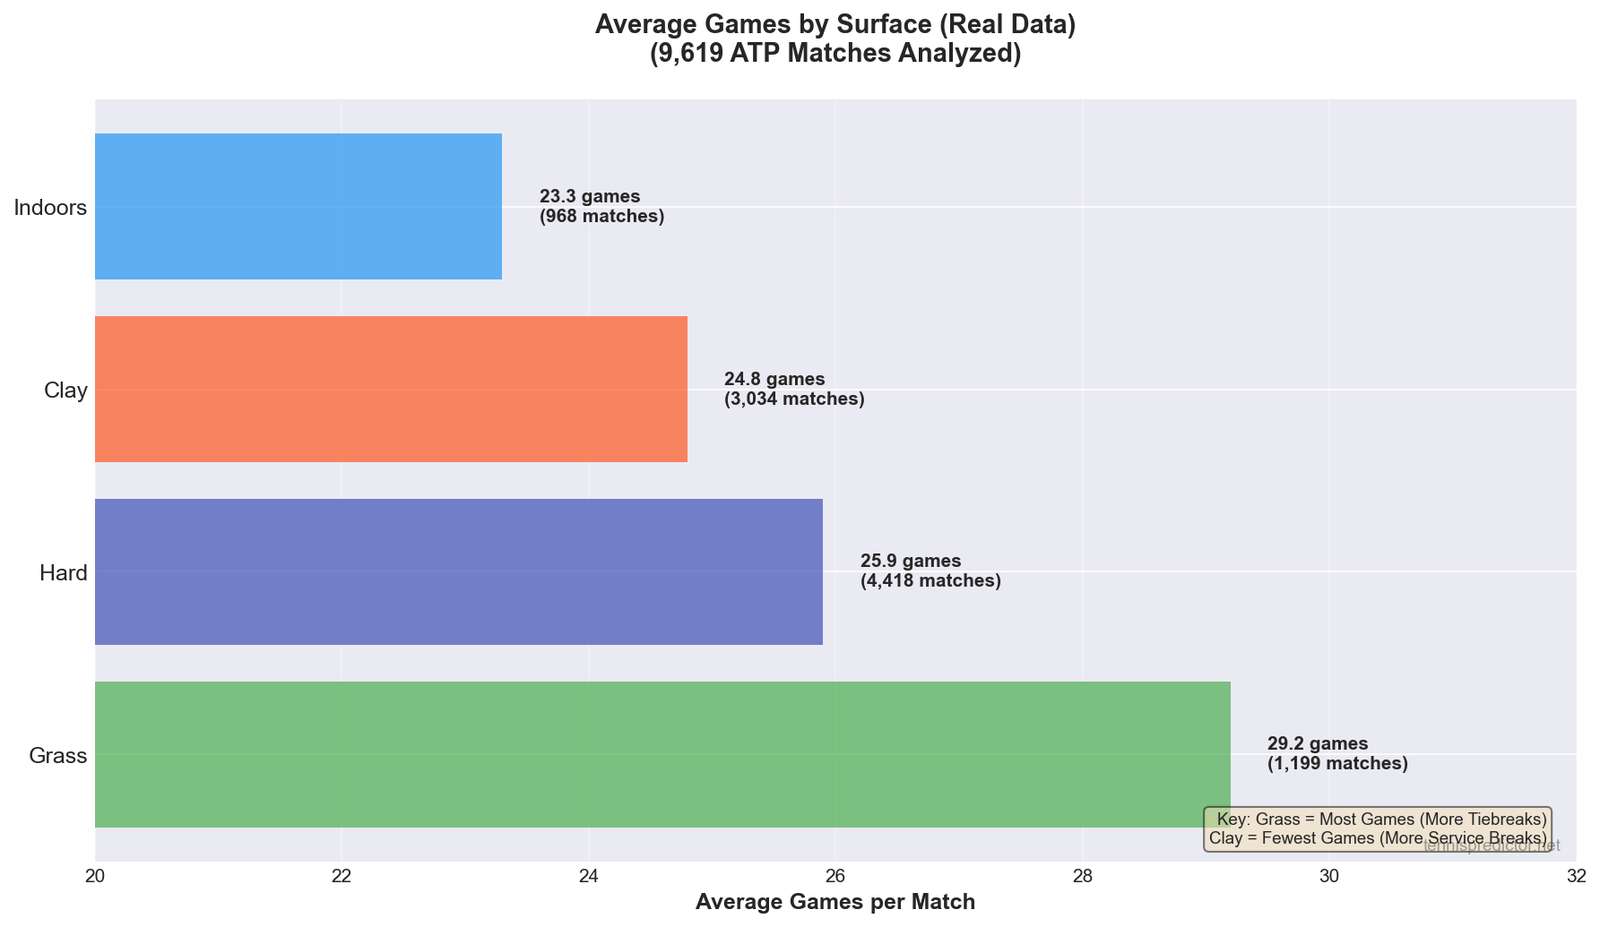
Figure 3: Average games per match by surface.
Best fit: bettors who track serve/return stats and like markets that don’t force a side pick.
Weather, altitude, and indoors
Outdoor hard totals move with wind and heat (more service holds or more errors). Altitude tournaments can shorten rallies. Indoor samples in our data averaged fewer total games than grass in the table above—always blend surface with conditions before taking a number blindly.
When totals pair well with sides
Some bettors use moneyline + totals as partial hedges (same match). That can reduce variance but also caps upside and increases fee drag. Size those combinations explicitly in units, not “what feels right” mid-match.
First set winner: why it matters
First-set betting is where momentum and pricing interact most clearly for best-of-three tennis.
The 69.5% match conversion
Among 9,698 matches where we could identify the first-set winner:
- The first-set winner also won the match 69.5% of the time.
- The remaining 30.5% are comebacks—large enough that first-set value and moneyline value can diverge match to match.
That percentage is a historical conditional frequency (what happened in past results), not a promise that your book’s first-set price is +EV. It does explain why we treat first-set structure as a first-class input—also covered in our dedicated piece on first set wins as a market.
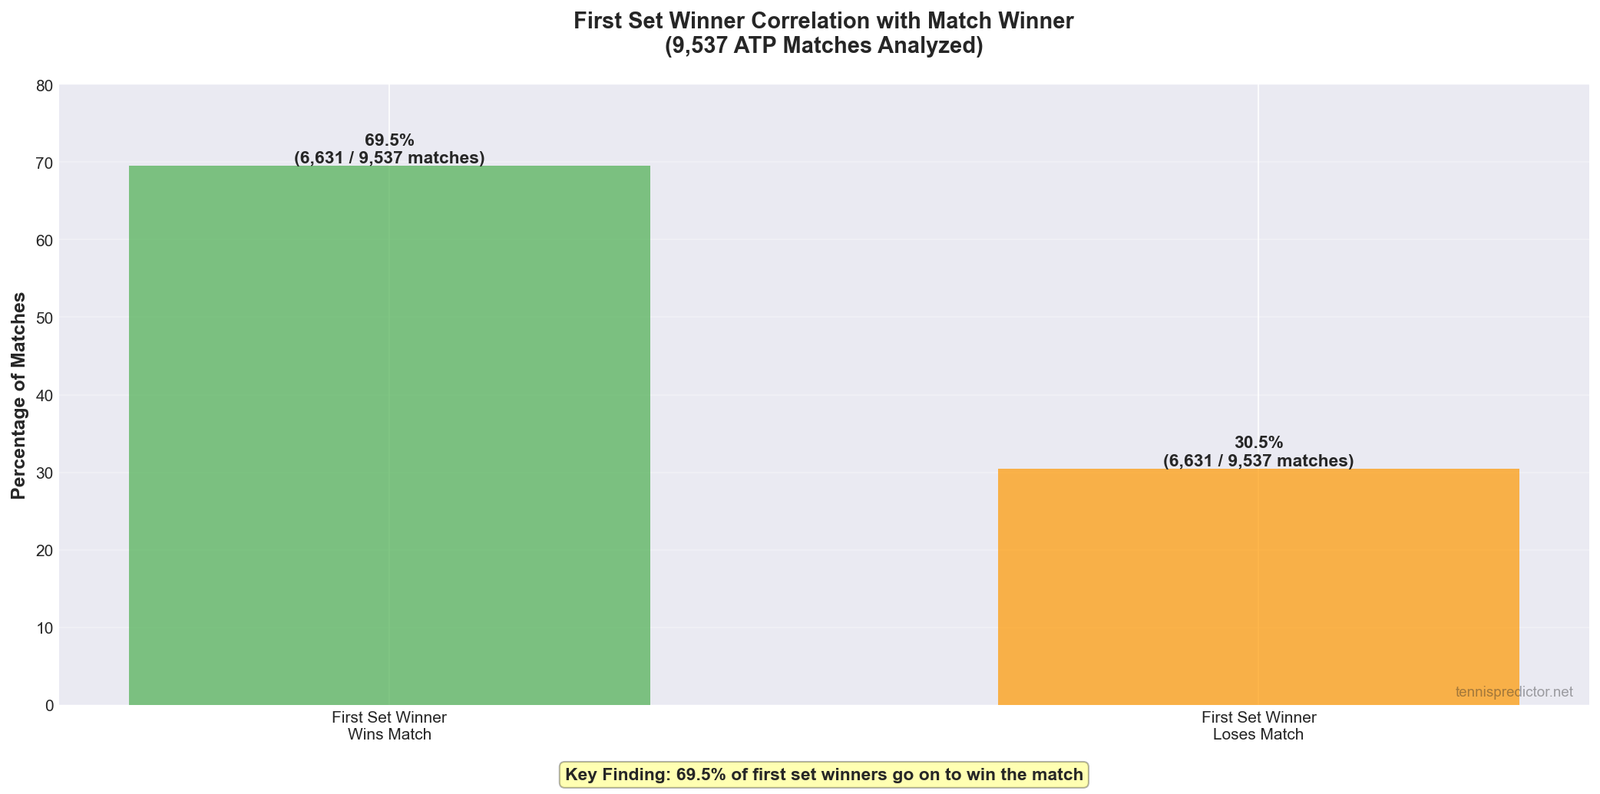
Figure 4: Link between first-set winner and match winner in the same sample.
Tournament snapshots (illustrative)
Grand Slam and Masters samples in our files show variation around the 69.5% average—for example higher conversion at some clay Masters than at certain grass majors. Use these as context for scheduling and surface, not as fixed rules for every ticket.
Practical use
- Pair first-set research with moneyline only when the correlation supports your risk (see value betting basics).
- Avoid treating “I like the favourite” as identical to “I like the first-set price”—books often move those markets on different schedules.
We do not quote a single static “model accuracy percentage” for first-set calls here: that number moves with season, coverage, and validation method. Use the predictions dashboard for current outputs and confidence.
Correlation is not a duplicate bet
Because 69.5% of first-set winners take the match, it is tempting to stack first-set and match tickets on the same player. Remember: those outcomes are highly correlated. Doubling exposure can be valid tactically, but it is not the same as diversifying—adjust stake so one bad read does not wipe two tickets at once.
Injury and coaching timeouts
Comebacks cluster when physical issues or tactical coaching change patterns after set one. The raw 69.5% / 30.5% split does not know whether a player is cramping—live information can justify fading a pre-match first-set lean even when the long-run stat is strong.
Live betting: speed and discipline
In-play markets react point-by-point. Edges can appear when odds overreact to a break or a medical timeout—but execution risk is real.
Common angles:
- After the first set: comeback paths exist in 30.5% of cases historically—lines sometimes assume more or less than that.
- Tiebreaks and breaks: volatility is high; plan max stake before you click.
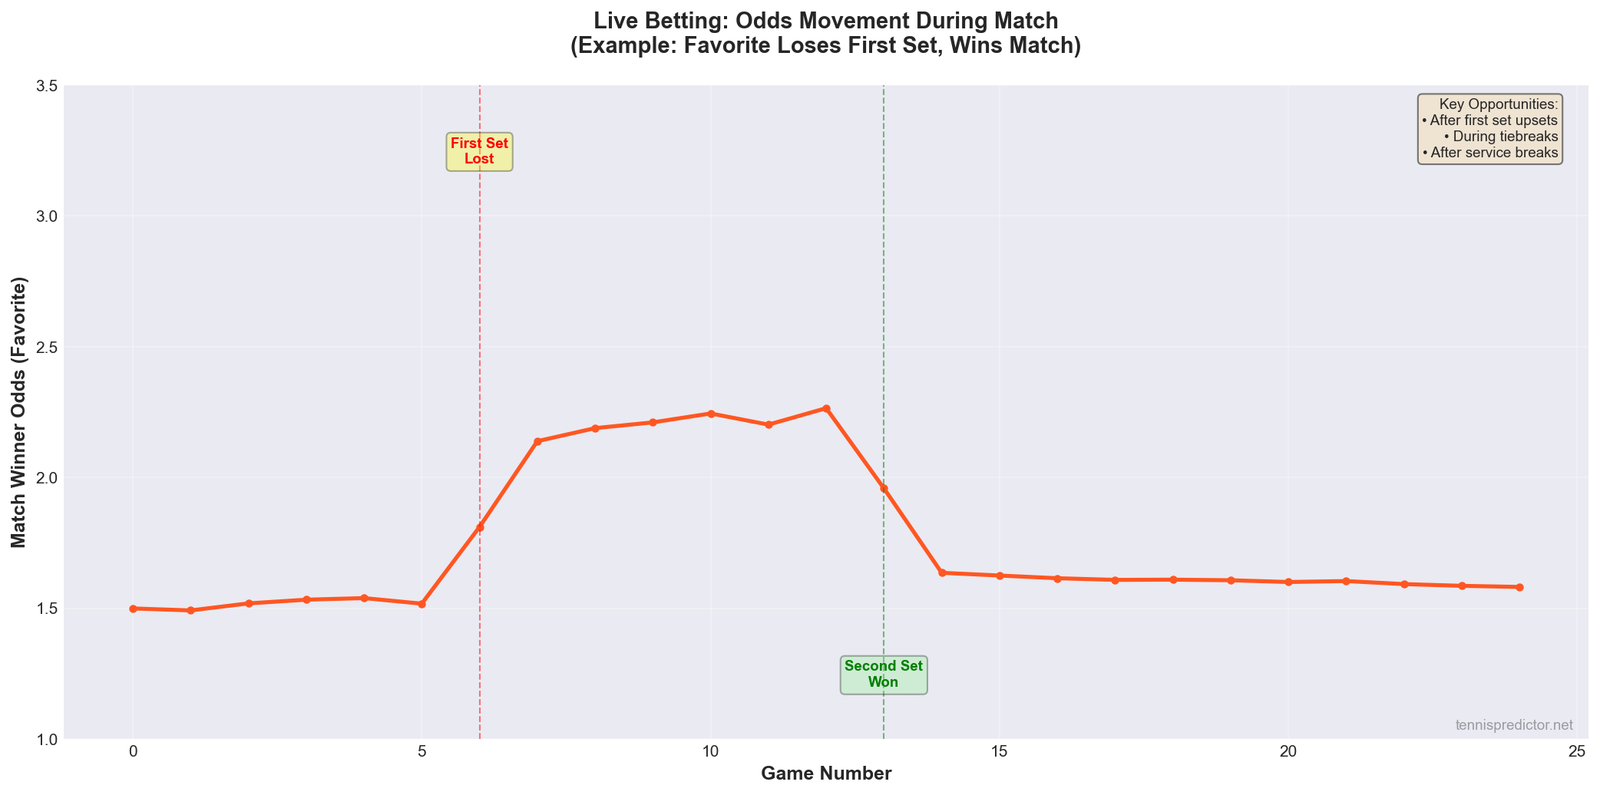
Figure 5: Stylised example of how live prices can move—illustrative, not a single match trace.
Best fit: viewers who can act calmly and accept worse average prices for better information.
A simple in-play checklist
Before you click in-play:
- Stake: pre-commit a max for this match.
- Trigger: define what signal you need (e.g. break + hold, not just one point).
- Exit: know whether you’re trading out or riding to completion.
Without those three, live betting becomes reactionary rather than strategic.
Market efficiency: a practical ladder
Not every market receives the same bookmaker attention. The chart below summarises a qualitative ladder: where lines tend to be sharpest vs where niche knowledge can still matter.
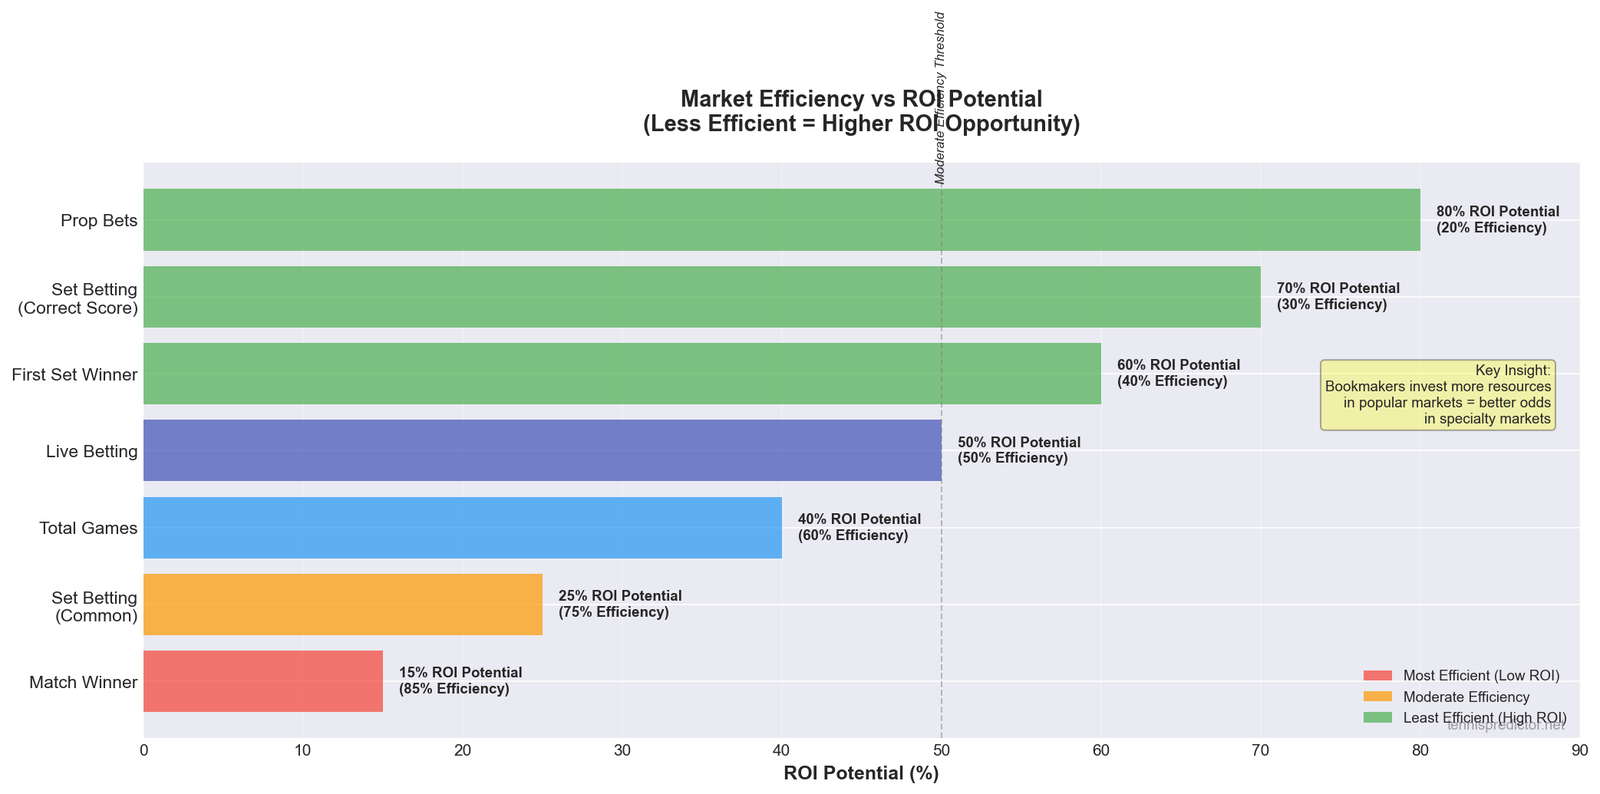
Figure 6: Conceptual efficiency vs opportunity—paired with the structural stats above, not a guaranteed ROI table.
Efficient (tighter): match winner on big events.
Less efficient (more dispersion): some props, niche totals, and certain first-set books with lower limits.
Always combine this with expected value thinking—“less efficient” does not mean “easy money.”
What we do not claim here
This guide does not publish realised ROI by market—doing that honestly would require ticket history, consistent odds capture, and fee modelling per account. We give structural statistics and frameworks; your results still depend on price, discipline, and sample size.
Myths that trip up tennis bettors
Myth 1 — “Favourites always cash on clay.” Clay tilts results toward better baseliners, but our surface splits still show material variance week to week. Surface is a prior, not a free pass to ignore price.
Myth 2 — “First set and match winner are independent bets.” They are correlated. Stacking both sides of the same player can make sense tactically, but it concentrates risk—size accordingly.
Myth 3 — “Totals are safer because I don’t pick a winner.” Totals remove side risk but keep length risk. A bad read on hold quality hurts just as much—sometimes more when the match goes tiebreak-heavy.
Myth 4 — “Live betting fixes bad pre-match reads.” Live can hedge or add exposure, but it rarely “fixes” a fundamentally wrong thesis without additional cost. The vig on in-play markets adds up.
Myth 5 — “More markets = more edge.” More markets usually means more variance and more ways to overtrade. Most profitable accounts we see focus on one or two market types until their process is boringly repeatable.
Choose a market to match your skill level
Beginners:
- Start with moneyline and stake small until closing-line discipline is automatic.
Intermediate:
- Add totals on surfaces you track, and use first set + match logic only when prices align.
Advanced:
- Layer set markets and selective live trades—never without a bankroll cap per match.
For the full “what predicts tennis” picture beyond markets, see what we learned from thousands of matches.
Staking template (illustrative)
Many serious bettors use flat units (1u = 1% of bankroll, for example) on moneyline, half units on first-set adds, and quarter units on long-shot correct scores—not because those markets are “less serious,” but because variance differs. Tune any template to your own risk tolerance; the key is consistency, not the exact fraction.
Side-by-side: what each market is really asking
Use this table as a mental model—not a rule that one column is always “better.”
| Market | You are mainly betting on… | Typical variance | When it shines |
|---|---|---|---|
| Match winner | Who wins the match | Medium (one binary) | Learning pricing, deep liquidity |
| Set betting / score | Path to the win | High | Style mismatches you’ve modelled |
| Total games | How long the match runs | Medium–high | Serve/return data, surface pace |
| First set winner | Early momentum | Medium | When your prep is set-specific |
| Live markets | Information + speed | High | When you watch and pre-commit rules |
Why this matters: two bettors can both be “right” about who is better and still lose money if they choose a market whose variance profile does not match their sample size. A correct side read on a correct score can still lose because tennis is path-dependent—breaks cluster, tiebreaks flip.
Time investment
Moneyline research scales from five minutes (check rankings and form) to hours (full tactical prep). Totals usually need more statistical work—recent hold rates, opponent return points won, likely wind. Set and live markets reward watching the player, not just the Elo spreadsheet. If you only have ten minutes before the first serve, be honest: your edge is probably in moneyline or first set, not in ten-leg live ladders.
Sample size and storytelling
A week of “I crushed totals” means almost nothing. A season of logged bets with closing lines, stakes, and market tags means a lot more. If you are not journaling at least market type and price, you cannot know whether your first-set thesis is real or lucky. Paper-trade a month if you need to—cheap tuition.
When to skip a market entirely
Skip set markets when you do not have a view on service holds. Skip totals when the weather forecast is uncertain and both players are erratic. Skip live when you are tired, distracted, or chasing. Skipping is part of edge preservation.
Short glossary
Closing line: the last price available before the market suspends at start (or the consensus sharp number trackers use). Beating it over time is a common benchmark for skill.
Correlation (first set vs match): in this article, the 69.5% figure means “share of matches where the first-set winner also won the match” in our historical ATP sample—not a causal law for every future match.
Favourite / chalk: the side with the shorter decimal odds before the match (lower implied risk, lower payout).
Hold: a service game won by the server—central to totals and to whether a set stays on serve.
Implied probability: break-even win rate implied by odds before margin (for decimal odds, 1 ÷ price).
Liquidity: how much money the market can absorb without huge price moves—usually highest on ATP moneyline at big events.
Variance: how widely results swing around your expectation; correct scores and some live markets have high variance even when your process is sound.
Frequently asked questions
What is the safest tennis market for beginners?
Usually match winner—simplest to understand and typically the most liquid. “Safest” is behavioural: smaller stakes, fewer legs, and a rule to stop after a set loss if you tilt. No market removes variance entirely.
What does the 69.5% first-set number mean?
In our historical ATP sample, when a player won the first set, they won the match 69.5% of the time. That is a descriptive fact about past results. It is not the same as “your slip wins 69.5% of the time” at the odds you were offered, and it is not a substitute for checking today’s prices.
Are totals easier than set betting?
They test different skills. Totals reward estimating game length; set betting rewards estimating score path. Many people find totals easier once they track hold stats and surface pace. Neither is “easy” at sharp prices.
Why does grass show the highest average games in your table?
In this dataset, grass matches averaged the most total games—often hold-heavy sets and tiebreaks that stretch game counts. Clay averaged fewer total games here despite longer rallies, because breaks can end sets faster. Always update intuition with current player form.
Is live betting more profitable than pre-match?
Not by default. In-play can offer extra information, but lines react quickly and emotional decisions multiply. Long-run profit still comes from edge × discipline, not from the channel label.
Should I combine first set and match winner?
Only when both prices independently make sense. The outcomes are correlated—staking both at full size can double-count the same opinion. Many bettors use reduced units on correlated legs.
Where do I see current model outputs?
Use the live predictions dashboard for up-to-date probabilities and confidence—not fixed percentages copied from blog text.
Does this apply to WTA matches?
This article’s aggregates are from our ATP training-era files. Women’s tour dynamics differ—use WTA-specific samples before transferring these percentages one-for-one.
Conclusion
The “best” market is the one that matches your edge, your time, and your bankroll rules. Structural stats point to first-set information as unusually informative for full-match outcomes (69.5% conversion in our sample), while moneyline remains the cleanest training ground for pricing literacy. Totals reward surface-specific homework; set and live markets add variance and demand faster execution.
Putting it together: start with honest self-assessment. If you cannot yet estimate fair win probability within a few percentage points, exotic markets will only amplify noise. Build fluency on moneyline and implied probability, then layer totals where you track serve data, then consider first-set and set markets when your preparation can support narrower predictions. Live betting belongs last—not because it is “harder,” but because it punishes undisciplined workflows the fastest.
Long-term profitability in tennis betting—where it exists—usually looks like small edges repeated at sensible size, not jackpot hunting on correct scores. Use the structural numbers in this article as guardrails, not slogans: they describe what did happen in a large historical sample; tomorrow’s prices still have to earn your stake.
Next steps
- Value betting in tennis: a beginner's guide
- Bankroll management for tennis betting
- First set wins: the most undervalued betting market?
Responsible betting reminder
Bet only with money you can afford to lose. If you feel pressure to recover losses with bigger stakes or extra markets, step away and use support resources in your jurisdiction. No article—ours included—turns betting into a risk-free activity.
All match statistics cited above are computed from our ATP results database (2022–2025). Odds-band and surface tables use the same extracts that feed our charts. Betting involves risk—only stake what you can afford to lose.
See today's match predictions with confidence scores and value signals.
View Live Predictionsarrow_forwardRelated Articles

The nationality factor: which countries produce the most reliable players?
After analyzing 7,481 ATP matches, we discovered that a player's nationality can predict their reliability. Argentine players are the most consistent (90.0 score), performing exactly to their ranking. German players? Boom-or-bust with the highest variance (81.5). This isn't about stereotypes—it's about measurable training culture and playing style patterns.
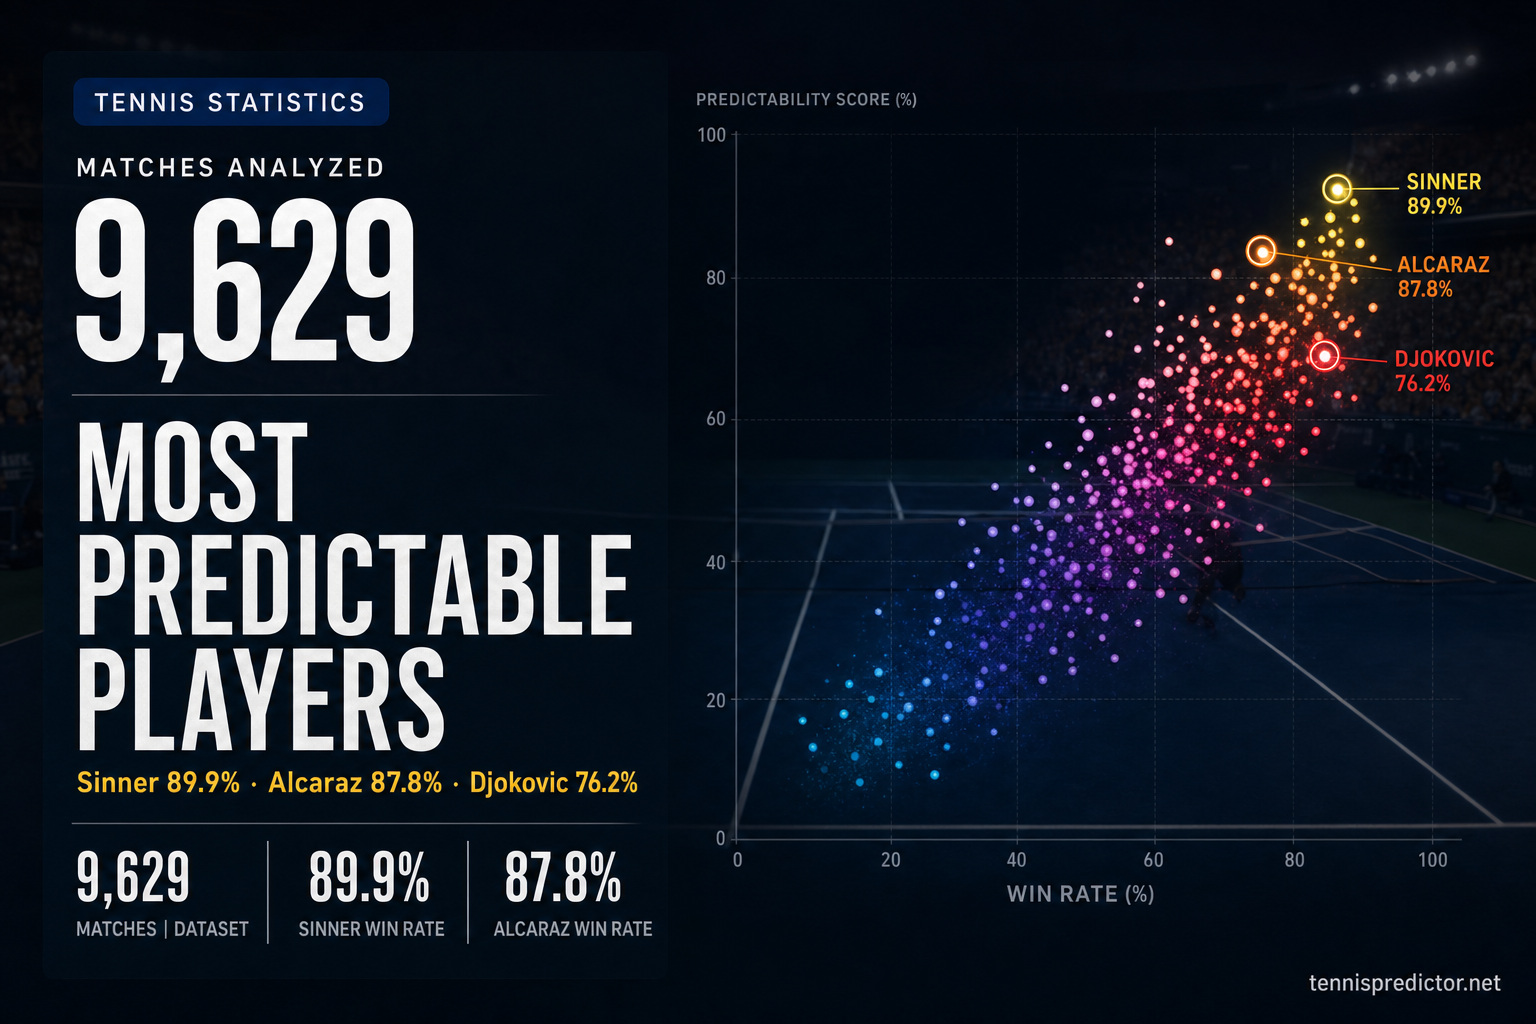
The most predictable tennis players of 2024
Not all tennis players are created equal. We analyzed 9,629 matches to find who's most predictable: Alcaraz leads with 86.3% win rate and ultra-low variance...
Tiebreak mastery: who wins when it matters most?
40.3% of professional matches feature a tiebreak — but that hides enormous variation. June grass-season matches hit 47.9%; April clay hits 33.7%. Sinner wins 79% of hard-court tiebreaks but only 46% on clay. And some players recover from a lost set-1 tiebreak 64% of the time, others just 7%.

Best tennis markets to bet: match winner vs set betting vs games
Moneyline, sets, totals, first set, live: which market fits your edge? Tables, six charts, myths debunked, and FAQs—built on thousands of ATP matches.