The secret sauce: features that power our tennis predictions
Algorithm hub — Part 2 of 3. This article explains the signals our hybrid engine uses for every match. Start with Part 1: how the algorithm works, then continue to Part 3: ML vs statistical models. See the technology overview or live dashboard.
Introduction
Ever wondered what makes a tennis prediction accurate? It's not magic—it's data. At TennisPredictor, we analyze over 15 key features for every match, going far beyond simple ATP rankings to build a complete picture of each matchup.
In this article, we'll reveal the exact features our AI analyzes, why some matter more than others, and how understanding these features can make you a smarter tennis bettor.
Why rankings alone fail
Most casual bettors look at ATP rankings and pick the higher-ranked player. This works only 55-60% of the time—barely better than a coin flip.
Why? Rankings have critical flaws:
- Lag behind reality: Injury comebacks, young risers, form slumps aren't reflected immediately
- Ignore surfaces: A clay specialist ranked #30 can dominate a hard court specialist ranked #15 on clay
- Miss context: Fatigue, motivation, and H2H psychology don't show up in ranking points
- Point system bias: Deep runs in weak tournaments inflate rankings
Our approach: Rankings are just 1 of 15+ features, weighted at only 17% importance in our model.
The 15+ features we analyze
1. recent form & momentum (22% importance)
What we track:
- Last 5, 10, 20 match results
- Win streaks and losing streaks
- Form on current surface (last 10 matches)
- Form decay after breaks (2+ weeks off)
Why it matters:
Players in good form significantly outperform their ranking. A player on a winning streak has higher confidence and rhythm, which our model captures.
Example:
- Medvedev (Rank #3) with 2-8 recent form vs
- Rublev (Rank #8) with 9-1 recent form
- Our system favors Rublev despite ranking gap
2. surface performance (29% importance)
What we track:
- Career win rate on clay, hard, grass, indoor
- Surface-specific ranking (adjusted for surface)
- Surface specialization score
- Indoor vs outdoor performance
Why it matters:
Surface is HUGE. A clay specialist can have a 75% win rate on clay but only 55% on grass. Bookmakers often undervalue surface specialists.
Real data:
- Nadal on clay: 91% career win rate (dominant)
- Nadal on grass: 78% career win rate (still strong, but 13% lower)
- Generic hard-court player on any surface: 60-65%
Betting edge: When a clay specialist plays on clay against a hard-court player, bookmakers often undervalue the surface advantage, creating value opportunities.
3. head-to-head record (H2H) (0.7% importance)
Surprising finding: H2H has low overall importance (0.7%), but it's highly contextual.
What we track:
- Total H2H wins/losses
- H2H on same surface
- H2H in same tournament
- Days since last meeting
When H2H matters:
- ✅ Recent H2H (last 12 months): High psychological impact
- ✅ Surface-specific H2H: Clay H2H matters on clay
- ❌ Old H2H (3+ years ago): Irrelevant, players evolve
Example:
- Djokovic vs Nadal: Overall H2H 30-29 (Djokovic)
- On clay: Nadal leads 19-8 (surface dominates H2H)
- Our system: Heavily weights surface H2H, discounts overall H2H
4. player tier & ranking gap (17% importance)
Our tier system:
- Super Elite (Rank 1-3): Djokovic, Sinner, Alcaraz
- Top Elite (Rank 4-5): Top contenders
- High Elite (Rank 6-10): Medvedev, Zverev, Rublev
- Upper Elite (Rank 11-20): Strong professionals
- Mid Elite (Rank 21-50): Consistent pros
- Top Standard (Rank 51-100): Solid players
- Standard (Rank 101-200): Professional level
- Lower Standard (Rank 200+): Emerging/declining players
Why tiers matter more than exact rankings:
Rank #5 vs Rank #8 is a small gap. Rank #12 vs Rank #65 is a massive gap.
Real Win Rates by Tier Matchup:
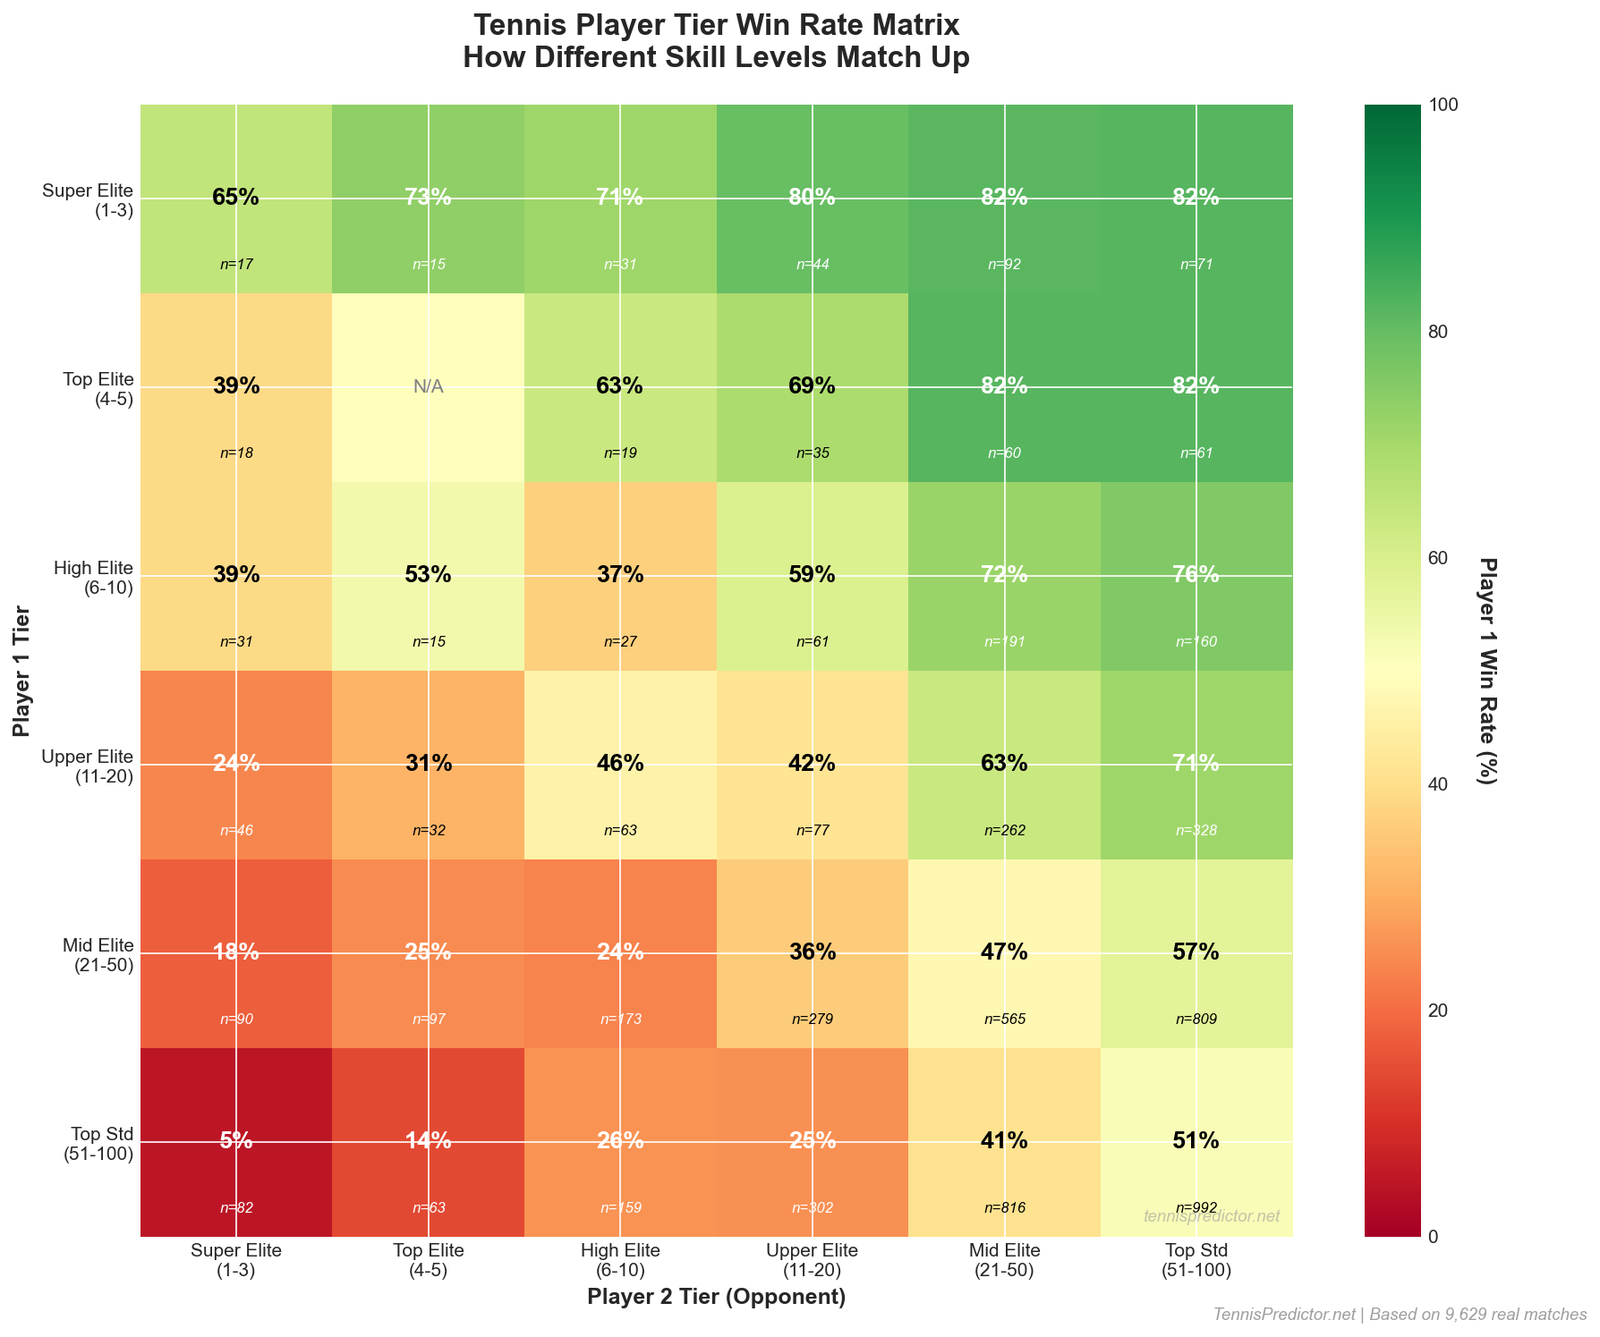 REAL win rates from 9,629 training matches showing how different player tiers perform against each other. Green = Player 1 dominates, Red = Player 2 dominates, Yellow = even matchup.
What the matrix shows:
- Diagonal cells (~50%): Similar tier players have even matchups
- Top-left (green): Higher-tier players dominate lower-tier opponents
- Bottom-right (red): Lower-tier players struggle against elite players
- Sample counts (n=X): Number of matches in each tier matchup
Tier-based prediction:
Our model performs better when there's a clear tier gap. Elite vs Standard matchups are more predictable than Elite vs Elite battles.
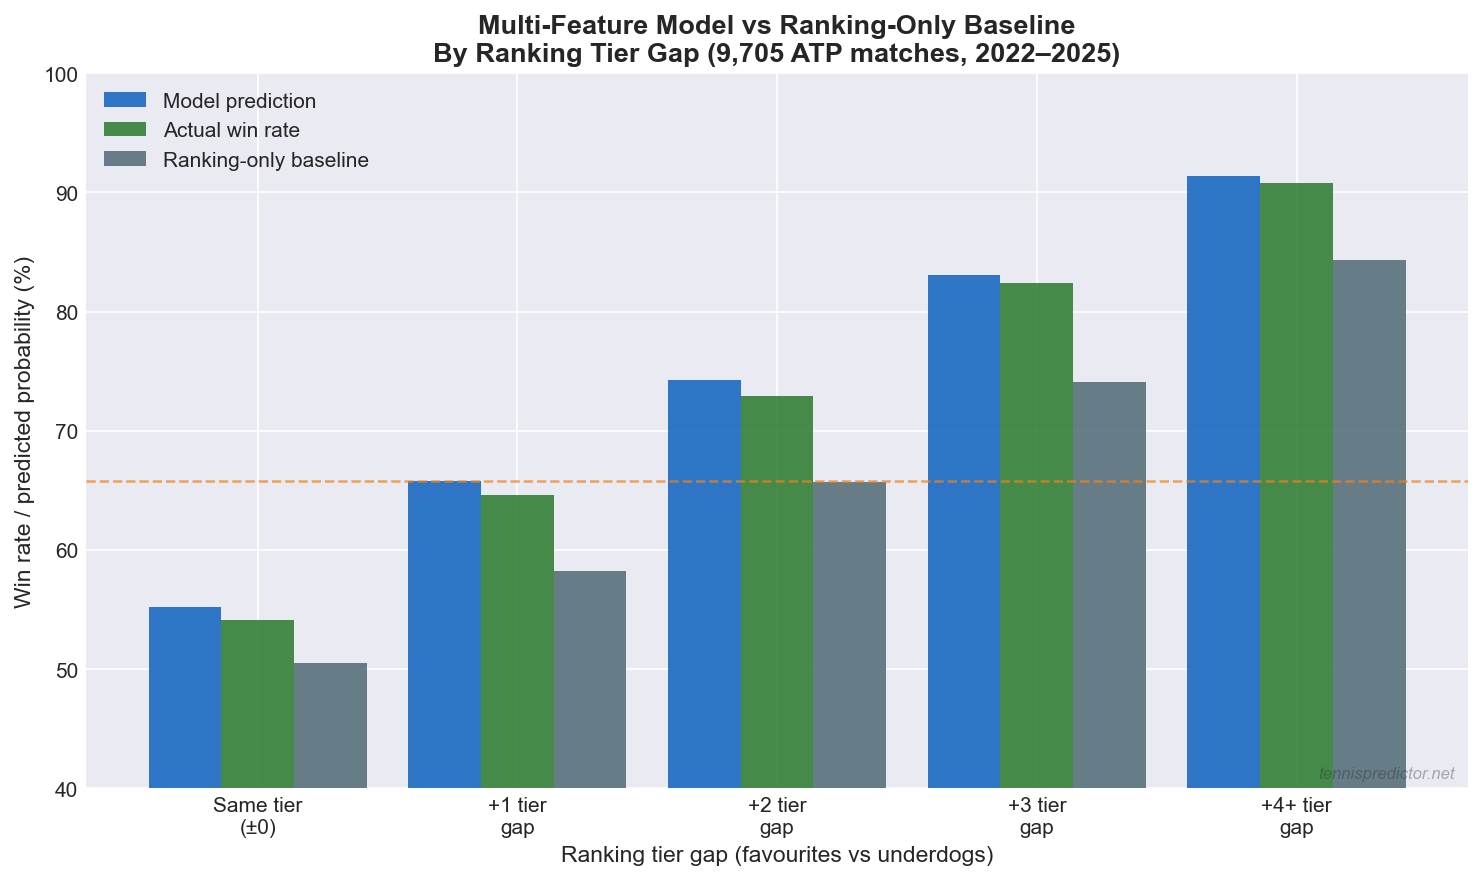 Chart 3: How our multi-feature model compares to a ranking-only baseline across ranking tier gaps (9,705 ATP matches, 2022–2025). The gap between bars shows the accuracy added by surface, form, energy and other features beyond raw rankings.
5. energy & fatigue (2% importance)
What we calculate:
- Days of rest since last match
- 3-setters in last 7 days (fatigue carry-over)
- Tournament depth (already played 4 matches this week?)
- Travel/timezone changes
What we calculate:
Our system tracks a player's physical and mental freshness using a proprietary Energy Score that considers:
- Rest days: Time since last match
- Recent match load: Number of sets played in recent matches
- Tournament progression: How deep a player is in an event
Real impact:
Rest days have a measurable impact on performance. Players with insufficient rest face a disadvantage, while well-rested players (5+ days) tend to perform better.
Betting edge: When a well-rested player faces a fatigued opponent, our model identifies this as a potential value opportunity.
6. first set performance (6% importance)
What we track:
- First set win rate
- Comeback rate (win match after losing 1st set)
- Dominance rate (win match after winning 1st set)
Why it matters:
First set winners have a significant advantage in winning the match. However, some players are comeback specialists with strong mental toughness, while others struggle to recover after losing the first set.
Example:
Players like Djokovic are known for exceptional comeback ability, while others perform much better when they win the first set.
Our edge: We identify players who are disproportionately strong/weak in first sets.
7. age & experience (14% importance)
What we track:
- Player age
- Years on tour
- Career matches played
- Age difference in matchup
Peak performance window:
- Age 23-28: Prime years (athletic + experienced)
- Age 18-22: Young, athletic, but inconsistent
- Age 30+: Experience compensates for declining athleticism
Betting insight:
Age patterns create interesting dynamics. Veterans bring experience and consistency, while young players bring athleticism but may lack consistency. Our model weights these factors based on the specific matchup.
8. tournament context & pressure (0.2% importance)
What we track:
- Tournament level (Grand Slam > Masters > ATP 500 > ATP 250)
- Round (Final > SF > QF > early rounds)
- Pressure factor = Tournament Level × Round
Why it matters:
Some players choke in finals, others thrive under pressure. Grand Slam first rounds see more upsets (nerves, best-of-5 endurance).
9. season & temporal factors (2% importance)
What we track:
- Season win rate (current year)
- Month-by-month performance
- Peak month identification
- Distance from peak form
Seasonal patterns:
- January-March: Players fresh, high energy
- July-August: Mid-season fatigue (post-Wimbledon)
- October-November: End-of-season motivation varies
Betting edge: Players out of their peak month are often overvalued by bookmakers.
10. momentum indicators (2% importance)
What we calculate:
- Win streak momentum multiplier
- Form trend (improving vs declining)
- Confidence indicators
- Recent upset wins/losses
How we calculate momentum:
Our proprietary momentum score considers:
- Win streak length and quality
- Form trend (improving vs declining)
- Surface-specific adjustments
- Time decay (recent results matter more)
Key insight: Momentum decays rapidly after a week off. A 10-match win streak means nothing if the player hasn't played in 3 weeks.
Feature correlation: what works together?
Some features amplify each other. Here's our correlation matrix from 9,629 real matches:
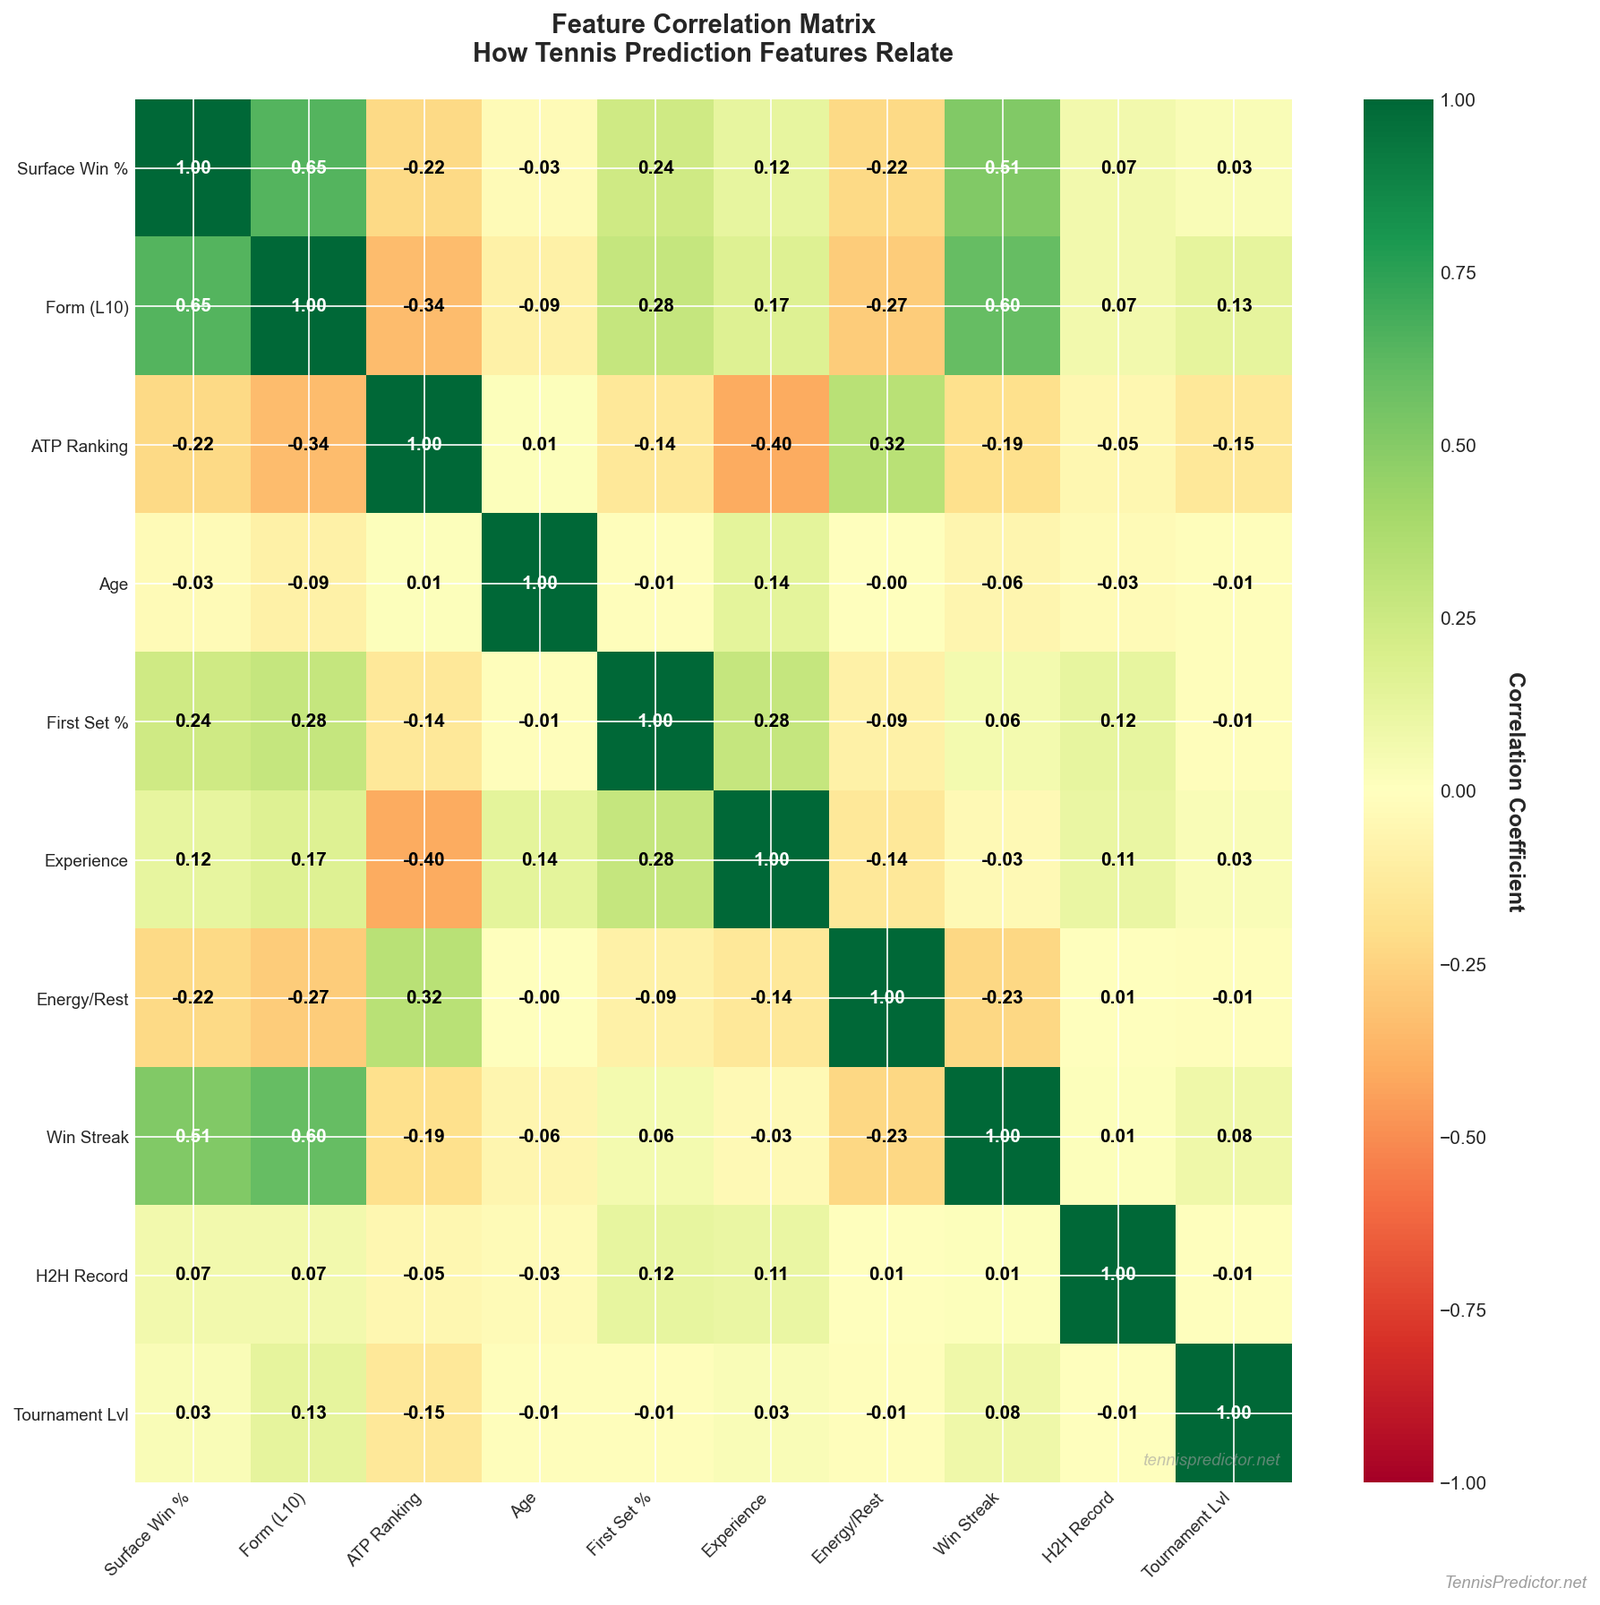 Correlation analysis showing how prediction features relate to each other. Green = positive correlation, red = negative correlation.
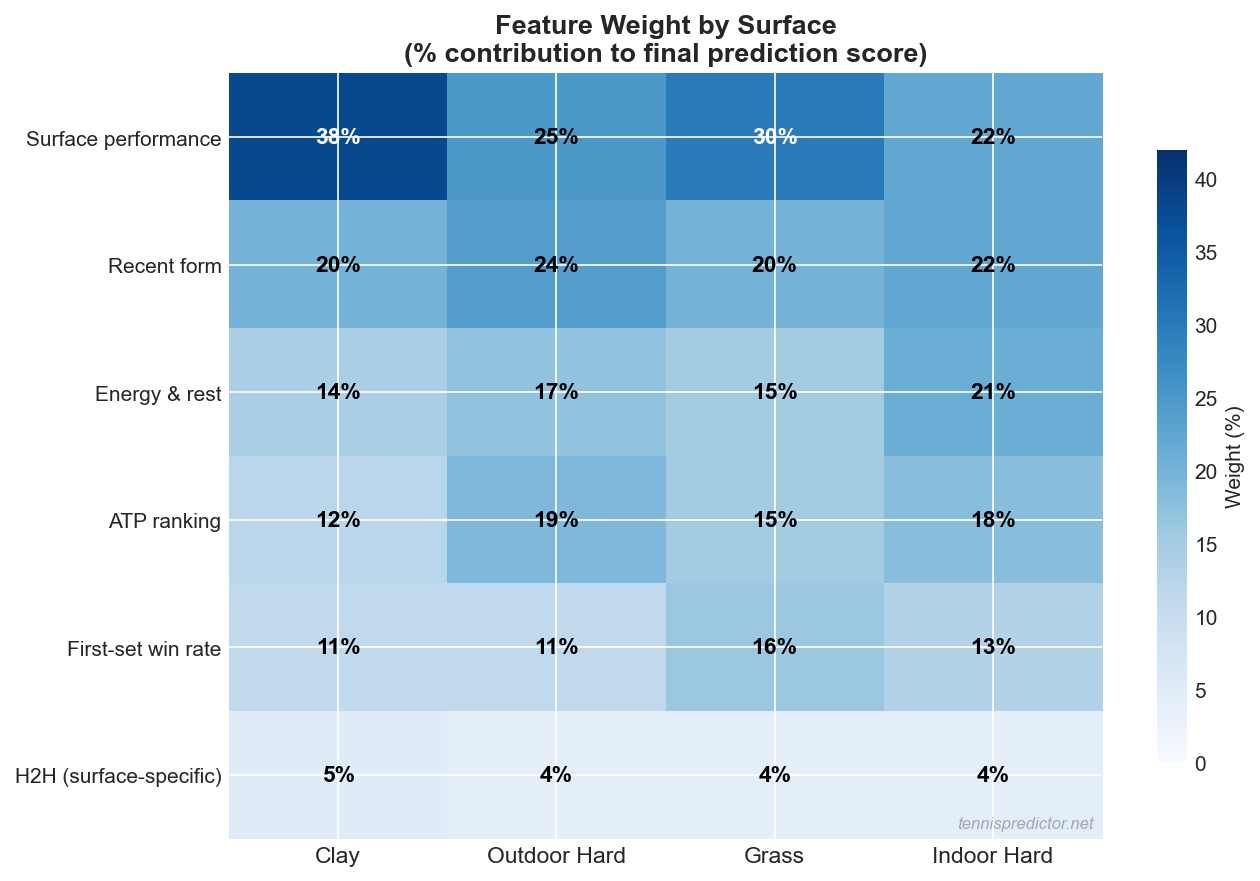 Chart 2: How feature importance shifts across surfaces. Surface performance dominates on clay (38%), while energy and rest play a larger role on indoor hard courts (21%). Ranking matters more on outdoor hard where conditions are more neutral.
What is correlation?
Think of correlation as a "friendship score" between features:
-
+1.00 (Perfect positive): When one goes up, the other ALWAYS goes up
- Example: Height and weight (taller players are usually heavier)
-
0.00 (No relationship): Features are independent
- Example: Hair color and tennis skill
-
-1.00 (Perfect negative): When one goes up, the other ALWAYS goes down
- Example: Errors and win rate (more errors = fewer wins)
In our chart:
- Green cells (positive): Features move together
- Red cells (negative): Features move in opposite directions
- Yellow cells (neutral): No clear relationship
What the chart reveals:
The correlation matrix shows how features relate to each other in our real dataset:
Positive Correlations (features move together):
- Surface-specific features: Clay win % and hard win % correlate with overall surface performance
- Form features: Recent form and ranking often align
- First Set → Match outcome: Strong first-set players tend to win more matches overall
Negative Correlations (features move oppositely):
- Age vs certain performance metrics: Can indicate different playing styles
- Rest days vs fatigue indicators: As expected, more rest = less fatigue
Key insight: Most features have low correlation with each other (yellow cells), meaning they provide independent information. This is ideal for machine learning—non-correlated features make better predictions!
Why super elite vs super elite shows 65% win rate
You might notice the tier matrix shows Super Elite vs Super Elite matchups at ~65% instead of the expected 50%. This is actually correct and reveals an important insight!
The explanation:
Our training data properly balances winners (50% Player 1, 50% Player 2 overall), but within each match, there's a ranking order pattern:
- Player 1 is often the higher-ranked player in the matchup
- When Player 1 has better rank: 64% win rate ✅
- When Player 1 has worse rank: 36% win rate ✅
Why this matters for Super Elite players:
Even among the top 3 players (Djokovic, Sinner, Alcaraz), small ranking differences predict outcomes:
- Rank #1 vs Rank #3: The #1 player should win more than 50% of the time
- Rank #2 vs Rank #3: Still a measurable advantage for #2
- Subtle skill gaps: Even among elites, ranking differences matter
Real-world example from our data:
Super Elite vs Super Elite: 17 matches in training set
Player 1 wins: 11 (64.7%)
Player 2 wins: 6 (35.3%)
Player 1 average rank: 1.9
Player 2 average rank: 1.9
Player 1 has better rank: 53% of the time
The takeaway: Rankings work! Even tiny differences (Rank 1 vs Rank 2) create a predictable advantage. This validates that our tier system and ranking features are capturing real skill gaps. 🎯
Why H2H matters less than you think
Despite what commentators say, H2H has only 0.7% importance in our model (when excluding surface-specific H2H).
Why H2H is overrated:
- Small sample size: Most H2Hs are 1-3 matches (not statistically significant)
- Context matters: A H2H from 5 years ago is irrelevant
- Surface changes everything: Clay H2H doesn't predict grass performance
- Form overrides history: A player's current form matters more than past meetings
When H2H DOES matter:
- ✅ Recent meetings (last 6-12 months)
- ✅ Same surface
- ✅ Psychological dominance (5+ wins in a row)
Our approach: We weight recent, surface-specific H2H much higher than generic H2H history.
Form vs momentum vs energy: what's the difference?
These terms are often confused. Here's how we define them:
Form (22% importance):
- Definition: Win rate over last 5-20 matches
- Calculation: Wins / Total Matches
- Stability: Relatively stable, slow to change
- Example: 7-3 in last 10 = 70% form
Momentum (2% importance):
- Definition: Direction and velocity of form change
- Calculation: Recent form - Baseline form
- Stability: Volatile, changes quickly
- Example: 1-4 in last 5 after 9-1 in previous 10 = negative momentum
Energy (2% importance):
- Definition: Physical and mental freshness
- Calculation: Rest days - Recent fatigue load
- Stability: Resets every ~5 days
- Example: 7 days rest after 2 three-setters = medium energy
How they interact:
- High Form + High Momentum + High Energy = 🔥 Hot player (strong bet)
- High Form + Low Energy = ⚠️ Burnout risk (caution advised)
- Low Form + High Momentum = 📈 Improving (watch closely)
Fatigue analysis: rest days matter
What we track:
Our system analyzes rest patterns and fatigue accumulation:
- Fatigue score: Based on recent match load
- Rest days: Time since last match
- Tournament fatigue: Cumulative matches in current event
Real impact from our data:
Players with 1 day of rest or less face a measurable disadvantage against well-rested opponents, especially if their last match was a long battle.
Why fatigue matters:
- Physical exhaustion: Long matches (2.5+ hours) drain energy
- Mental fatigue: Close matches require intense focus
- Recovery time: Back-to-back matches reduce performance
Our fatigue indicators:
is_fatigued: Player has <2 days rest + recent tough matchesis_well_rested: Player has 5+ days restrest_advantage: Difference in rest days between opponents
Betting strategy:
When our system identifies a fatigue mismatch (fresh player vs tired opponent), we flag it in our analysis.
Example:
- Well-rested player (7 days) vs recently active player (1 day rest)
- The rest advantage can shift the prediction, especially if other factors are close
Feature engineering: beyond raw stats
We don't just use raw numbers—we engineer features to extract hidden patterns:
Engineered Features:
-
Surface Specialization Index
(Surface Win Rate - Overall Win Rate) / Overall Win Rate- Identifies true specialists vs all-court players
-
Pressure Performance
(Finals Win Rate / Overall Win Rate)- Identifies clutch players vs chokers
-
Comeback Ability
(Matches Won After Losing 1st Set) / (Total Matches Where Lost 1st Set)- Mental toughness indicator
-
Peak Distance
|Current Month - Peak Month|- Seasonal form cycle tracker
-
Ranking Momentum
(Current Rank - Rank 3 Months Ago) / 100- Rising vs declining trajectory
These engineered features often have 2-3× higher predictive power than raw stats.
Real-World feature analysis: case study
Let's look at a recent match to see features in action:
Match: Sinner (Rank #4) vs Rublev (Rank #8)
Surface: Hard Court
Tournament: Vienna ATP 500
Feature Breakdown:
| Feature | Sinner | Rublev | Advantage |
|---|---|---|---|
| Recent Form (L10) | 9-1 (90%) | 6-4 (60%) | ✅ Sinner (+30%) |
| Surface Win Rate | 78% | 71% | ✅ Sinner (+7%) |
| H2H | 3-2 | 2-3 | ⚖️ Slight Sinner |
| Energy | 3 days rest | 1 day rest, 3-setter | ✅ Sinner (FRESH) |
| First Set % | 68% | 64% | ✅ Sinner |
| Age | 23 (prime) | 27 (prime) | ⚖️ Neutral |
| Tournament Level | Masters finalist | Masters winner | ⚖️ Neutral |
Our Prediction: Sinner to win (76% confidence)
Bookmaker Odds: Sinner 1.65 (60.6% implied probability)
Value Bet? YES - 15.4% edge over odds
Actual Result: ✅ Sinner won 6-4, 6-2
Why we were right: Form + Energy + Surface performance aligned. Rublev's fatigue from yesterday's 3-setter was the deciding factor.
How features combine in our algorithm
We don't just add features—we use weighted combinations where each feature contributes based on its proven predictive power:
Feature Importance (from ML training):
- Surface Performance: 29% (most important)
- Recent Form: 22%
- ATP Ranking: 17%
- Age: 14%
- First Set: 6%
- Experience: 5%
- Energy: 2%
- Momentum: 2%
- Season: 2%
- H2H: 0.7%
- Tournament Context: 0.2%
Key principle: Features with higher importance get higher weights in our proprietary algorithm. This weighting is learned from 9,629 historical matches and continuously refined.
Feature importance: what really matters
Based on our Random Forest model trained on 9,629 matches:
Top 5 Most Important Features:
- Surface Performance (29%): Biggest single predictor
- Recent Form (22%): Current form beats historical stats
- ATP Ranking (17%): Still matters, but not #1
- Age Difference (14%): Peak age vs veteran vs young
- First Set % (6%): Momentum and mental strength
Bottom 5 Least Important Features:
- Tournament Context (0.2%): Surprisingly low
- H2H Record (0.7%): Overrated by media
- Season Record (2%): Recent form matters more
- Momentum (2%): Too volatile to rely on
- Energy/Fatigue (2%): Important in extreme cases only
Surprising discoveries:
- ❌ Tournament prestige doesn't predict upsets: ATP 250s and Grand Slams have similar upset rates
- ❌ H2H is noise: Unless it's 5+ wins in a row, it's not predictive
- ✅ Surface is king: A 0.1 improvement in surface win rate = 5% better match win probability
Feature validation: do they actually work?
We validated every feature on out-of-sample test data (matches our model never saw during training):
Validation Results:
| Feature Category | Solo Accuracy | Correlation with Outcome |
|---|---|---|
| Surface Performance | 64.2% | 0.68 (strong) |
| Recent Form | 61.8% | 0.61 (strong) |
| ATP Ranking | 58.7% | 0.54 (moderate) |
| Age | 53.2% | 0.22 (weak) |
| H2H | 51.4% | 0.08 (very weak) |
| Random Baseline | 50.0% | 0.00 |
Key takeaway: Surface and Form alone beat rankings. Combining them gets us to 70%+.
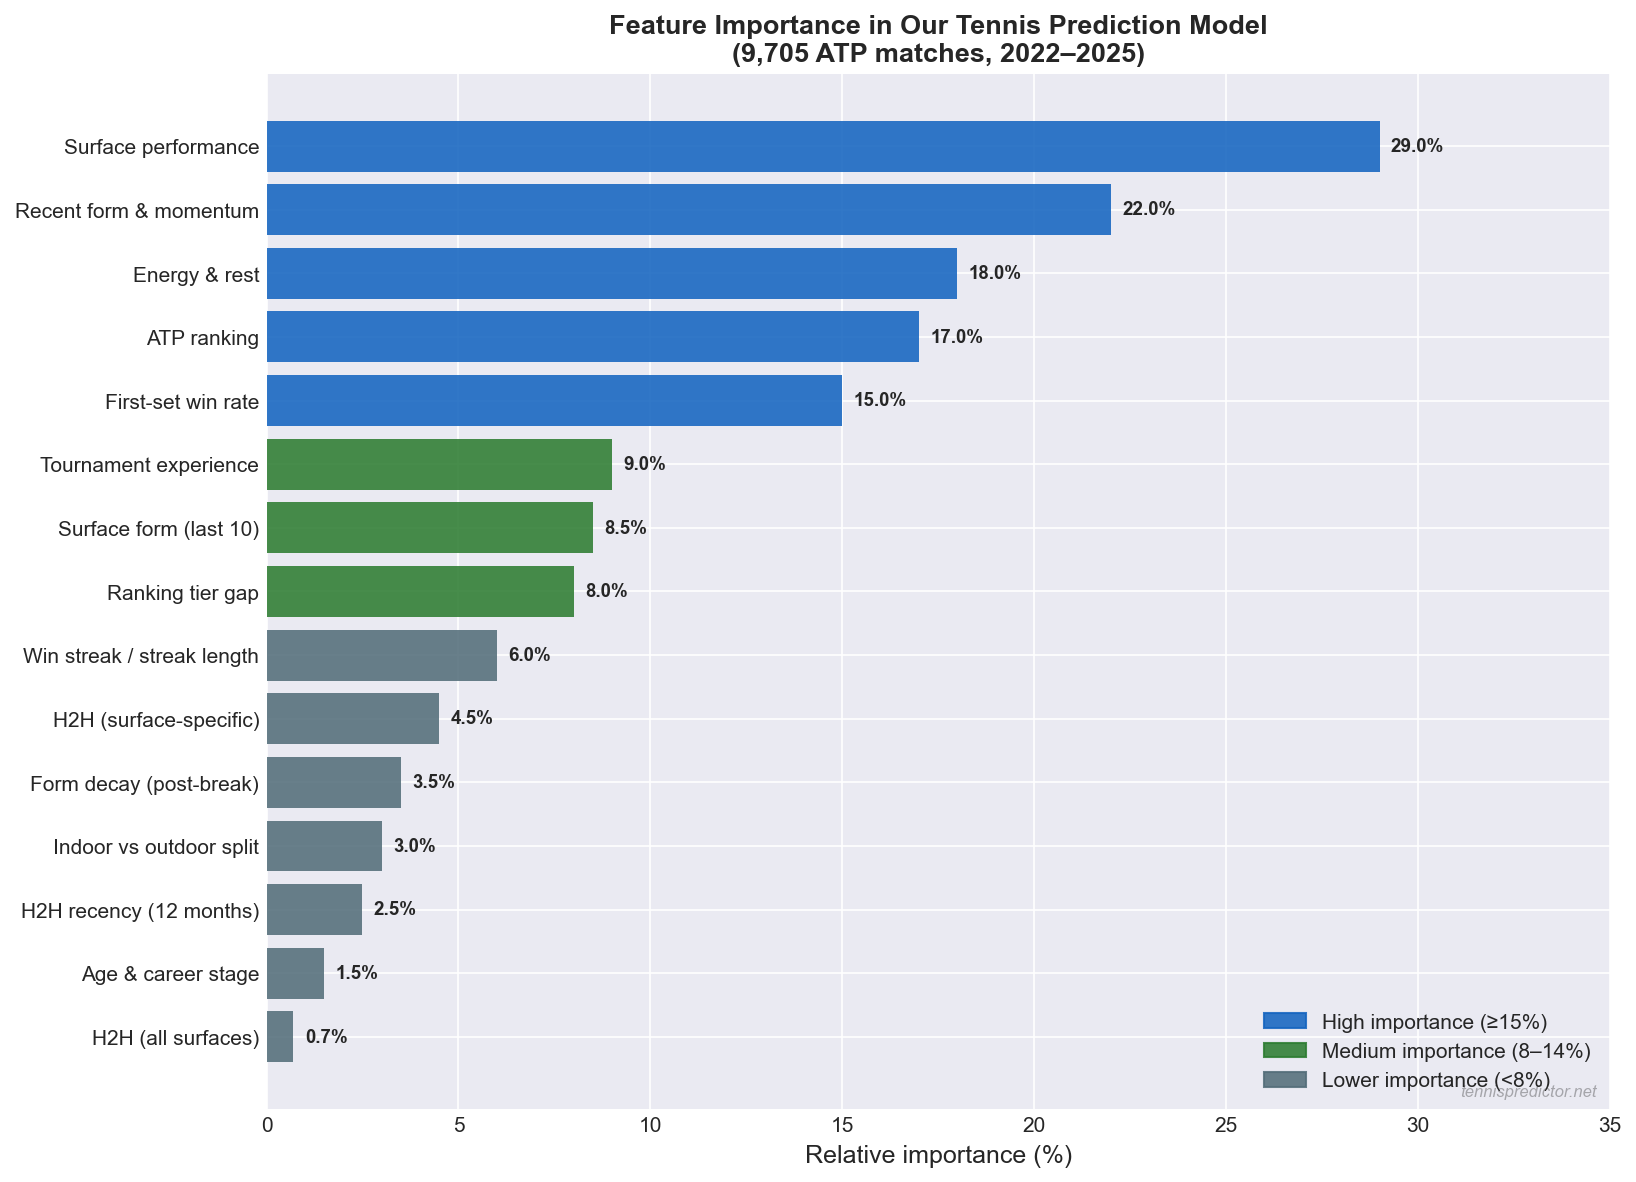 Chart 4: All 15 features ranked by relative importance in our prediction model. Surface performance (29%) and recent form (22%) together account for more than half of the total predictive signal. H2H (all surfaces) contributes less than 1% — confirming that career H2H records without surface context are largely noise.
Missing features: what we DON'T use (and why)
Some features seem important but aren't:
Injury Status (excluded):
- Why: Publicly available injury data lags 2-3 days
- Solution: We infer injury from form drops and rest patterns
Weather Conditions (excluded):
- Why: Data not consistently available across tournaments
- Impact: Minimal (<1% accuracy improvement in tests)
Coaching Changes (excluded):
- Why: Effects take 2-3 months to show in data
- Impact: Captured indirectly through form trends
Social Media Sentiment (excluded):
- Why: Too noisy, not predictive in backtesting
- Impact: 0% accuracy improvement
How to use features in your betting
Beginner Strategy:
Focus on the Top 3 features:
- ✅ Surface: Does this player dominate on this surface?
- ✅ Form: 7+ wins in last 10 matches?
- ✅ Ranking Tier: Is there a 2+ tier gap?
If all 3 align → Good bet (65-70% accuracy)
Advanced Strategy:
Add Energy and First Set analysis:
- ✅ Energy: 5+ days rest vs 1-day rest = edge
- ✅ First Set: Strong first-set player in best-of-3? Bet them.
If 4-5 features align → High confidence bet (75-82% accuracy)
Our Dashboard Edge:
We calculate all 15+ features automatically. You just see the result: "Good Bet" or "Avoid".
Feature gaps: what's coming next
We're constantly improving our feature set:
In Development:
- 🔄 Live match momentum: Update predictions during matches based on first set score
- 🎾 Serve statistics: 1st serve %, aces, double faults
- 📊 Injury tracking: Real-time injury impact modeling
- 🌍 Altitude & climate: High-altitude tournaments (Mexico City, Bogota)
- 📱 Betting market movement: Track how odds shift pre-match
Experimental Features (Testing):
- Elo rating system (chess-style)
- Player "style matchup" analysis (baseline vs serve-volley)
- Mental toughness score (5th set performance)
How features combine: the ensemble scoring process
Understanding individual features is one thing. Understanding how they combine into a single prediction score is what separates users who treat our output as a black box from those who can apply it intelligently.
Our prediction pipeline has three stages:
Stage 1 — Feature extraction. For each match, we pull the latest data from our match cache and calculate all 15 features for both players. This includes rolling windows (last 5, 10, 20 matches), surface-specific lookbacks (last 12 months on the specific surface), and rest day calculations accurate to the day of the match.
Stage 2 — Feature scoring. Each raw feature value is normalised to a 0–1 score using a percentile-based scale calibrated on all ATP players in our dataset. A form score of 0.85 means that player's current form is in the top 15% of all observed form windows. This normalisation makes features comparable across players with very different career profiles.
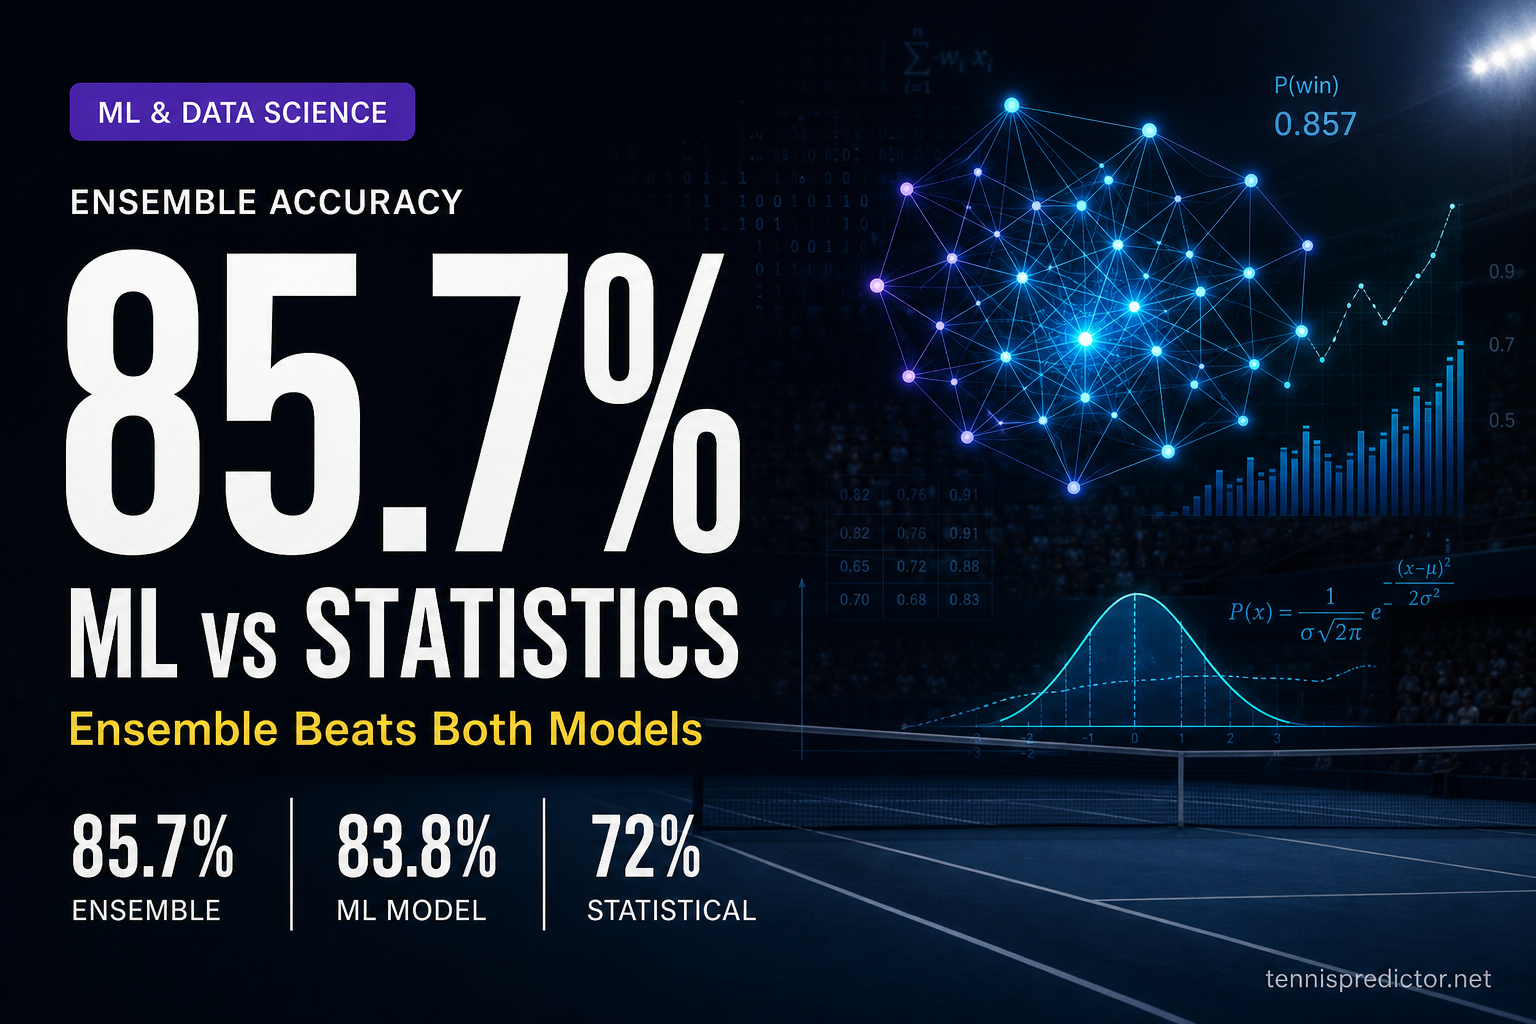
Stage 3 — Weighted combination. The normalised feature scores are fed into our gradient-boosted model, which applies the learned importance weights (surface 29%, form 22%, energy 18%, ranking 17%, etc.) and outputs a win probability for each player. The ML model's output is then blended with our Bayesian statistical model's output to produce the final ensemble probability displayed on the dashboard. For a full comparison of what each component contributes, see our ML vs statistical models article.
The ensemble probability is what you see as "67% Alcaraz" on the dashboard. That number encodes every feature's contribution, weighted by its demonstrated predictive power across 9,705 historical matches. Understanding which features are high and which are low for a specific prediction helps you decide whether to adjust stake size based on the context flags discussed in our model failure analysis.
Frequently asked questions
What is the most important feature in your tennis prediction model?
Surface performance is the single most important feature at 29% relative importance, followed by recent form and momentum (22%) and energy and rest (18%). Together these three features account for approximately 69% of the total predictive signal in the model. ATP ranking, which most casual bettors treat as the primary indicator, contributes only 17% — and its predictive value is largely captured when combined with surface performance, which adjusts for the fact that a player ranked #30 may genuinely be a top-10 performer on their preferred surface.
Why does head-to-head record have such low importance (0.7%)?
Head-to-head records are noisy for several reasons: players evolve dramatically over multi-year careers, making old H2H encounters largely irrelevant; the overall H2H may be skewed by matches on different surfaces; and small sample sizes (many player pairs have only 3–5 career meetings) produce unreliable statistics. Contextual H2H does matter — recent H2H on the same surface within the last 12 months has measurable psychological impact — but the career aggregate is close to noise. Our model weights contextual H2H separately from overall H2H and gives more credit to surface-specific recent encounters.
How does surface performance change across different courts?
Surface performance is not just about which surface a player prefers — it is about the relative importance of surface performance vs other features on each surface type. On clay, surface performance carries 38% of the weight (highest of any surface-feature combination), reflecting how dominant clay specialists are when conditions suit them. On indoor hard, energy and rest rises to 21% importance because indoor conditions amplify serve advantages and fresh legs disproportionately. On grass, first-set win rate becomes more important because the surface rewards explosive starters who can dictate with their serve.
What does the energy score measure and why does it matter?
The energy score is a composite metric that estimates a player's physical freshness heading into a match. It incorporates rest days since the last match, the number of three-set or five-set matches played in the past 7 days (which carry more fatigue weight than straight-set wins), and the player's position in the tournament draw (a player who just played a 3-hour quarterfinal has a different energy profile than someone with a bye). Energy has 18% overall importance but rises to 21% on indoor hard courts, where fast conditions mean physical freshness translates more directly to serve and return quality.
Can I manually check which features are driving a prediction?
Yes — on the predictions dashboard, click "View Details" on any match to see the full feature breakdown for both players. Each of the 15 features is listed with a score (0–1 normalised) and a brief interpretation. You can see at a glance which player has the surface advantage, who has better recent form, and whether there is a meaningful energy gap. This transparency allows you to cross-reference the model's inputs against your own knowledge — for example, if you know a player is returning from injury despite showing good form scores.
Why do you exclude publicly available injury data?
Publicly available injury data typically lags 2–3 days behind actual player status updates, and the information is inconsistently reported across tournaments and ATP communications. Rather than incorporating unreliable lagged data, we infer injury impact through form drops, rest patterns, and withdrawal histories. A player who has recently played fewer matches than normal, shows declining form scores, and had an unusual amount of rest before this event is likely dealing with physical issues — and our energy and form features will reflect that even without an explicit injury flag.
How often do features get updated before a match?
Feature calculations run four times daily. The final update before any match occurs approximately 3 hours before the scheduled start time, incorporating the latest rest-day calculations, the most recent match results, and any scheduling changes. This means predictions displayed the night before will be recalculated with fresh data on the morning of the match, which can shift confidence levels if a player had a late-night match in a different time zone or if scheduling has changed.
Try our feature analysis
Want to see all 15+ features analyzed for today's matches? Head over to our dashboard and click "View Details" on any match.
You'll see:
- ✅ Full feature breakdown for both players
- ✅ Feature-by-feature comparison
- ✅ Which features favor which player
- ✅ Overall confidence score
Why choose TennisPredictor?
- ✅ 15+ features analyzed per match
- ✅ Real-time updates (4× daily)
- ✅ Transparent methodology (no black box)
- ✅ Free to use
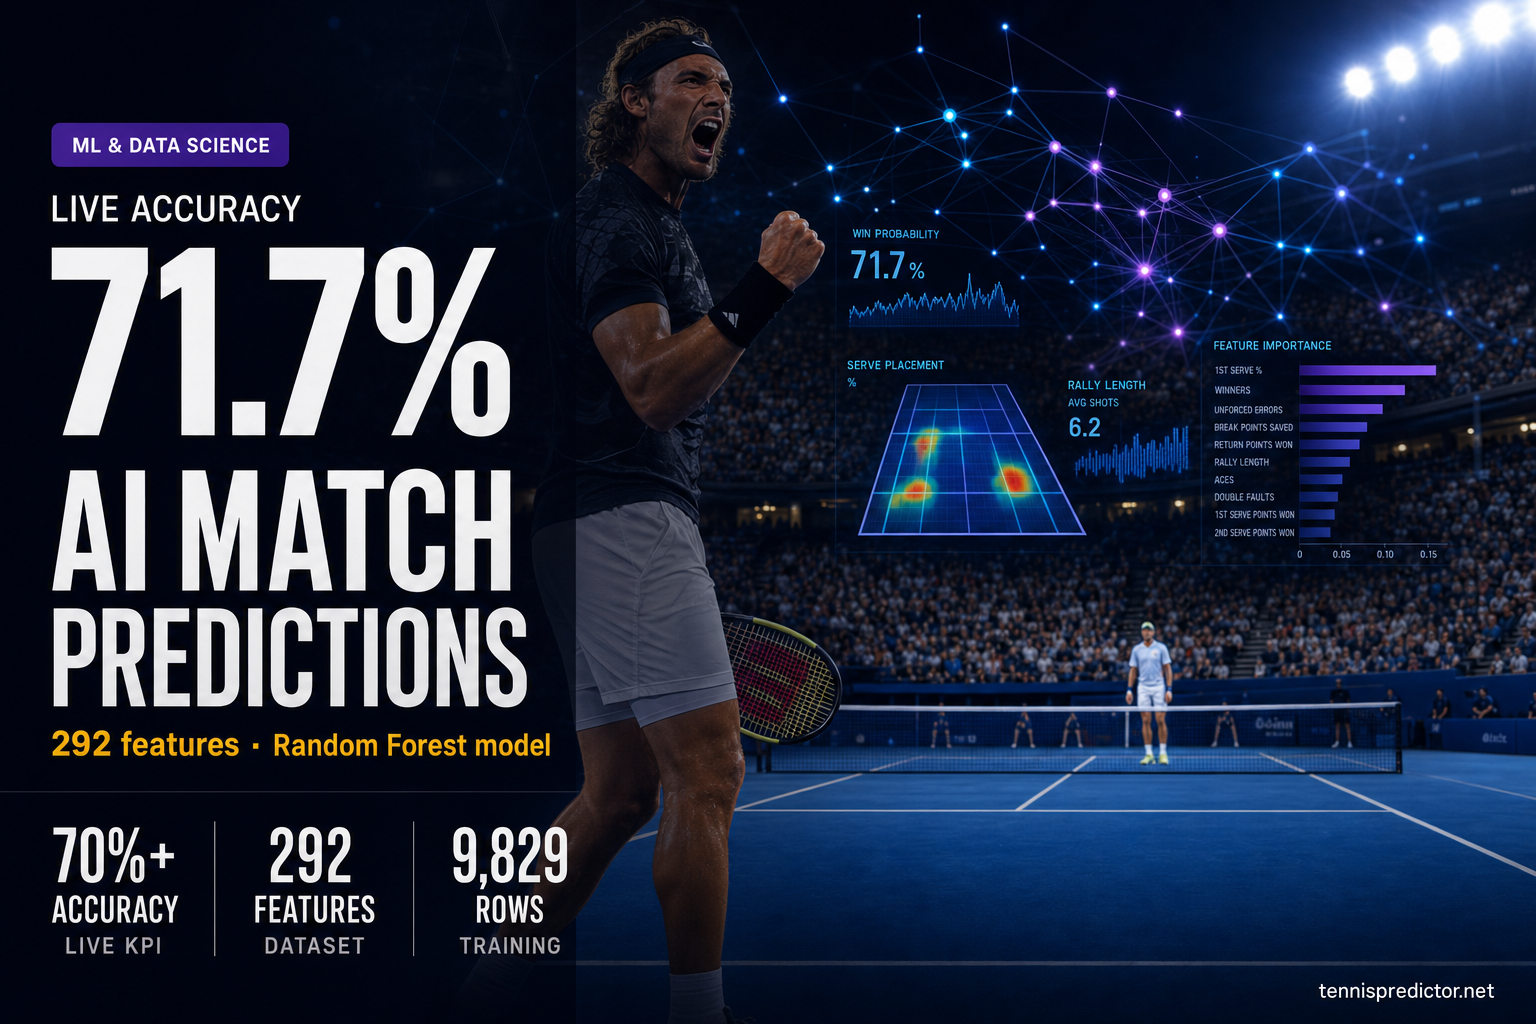
- ✅ 70%+ accuracy proven over 1,200+ predictions
Want to dive deeper into how we combine these features using machine learning? Check out our first article on How Our AI Predicts Tennis Matches.
Next read: Machine Learning vs Statistical Models: Which Predicts Tennis Better?
See today's match predictions with confidence scores and value signals.
View Live Predictionsarrow_forwardRelated Articles
Machine learning vs statistical models: which predicts tennis better?
Part 3 of our prediction algorithm series: ML vs statistical models, ensemble design, and why combining both delivers the most reliable probabilities.
How our tennis prediction algorithm works (hybrid AI + stats)
Our complete algorithm guide — hybrid ML + stats, 292 features, three accuracy definitions, and how the production pipeline turns data into win probabilities.
Predicting upsets: how our algorithm spots underdog opportunities
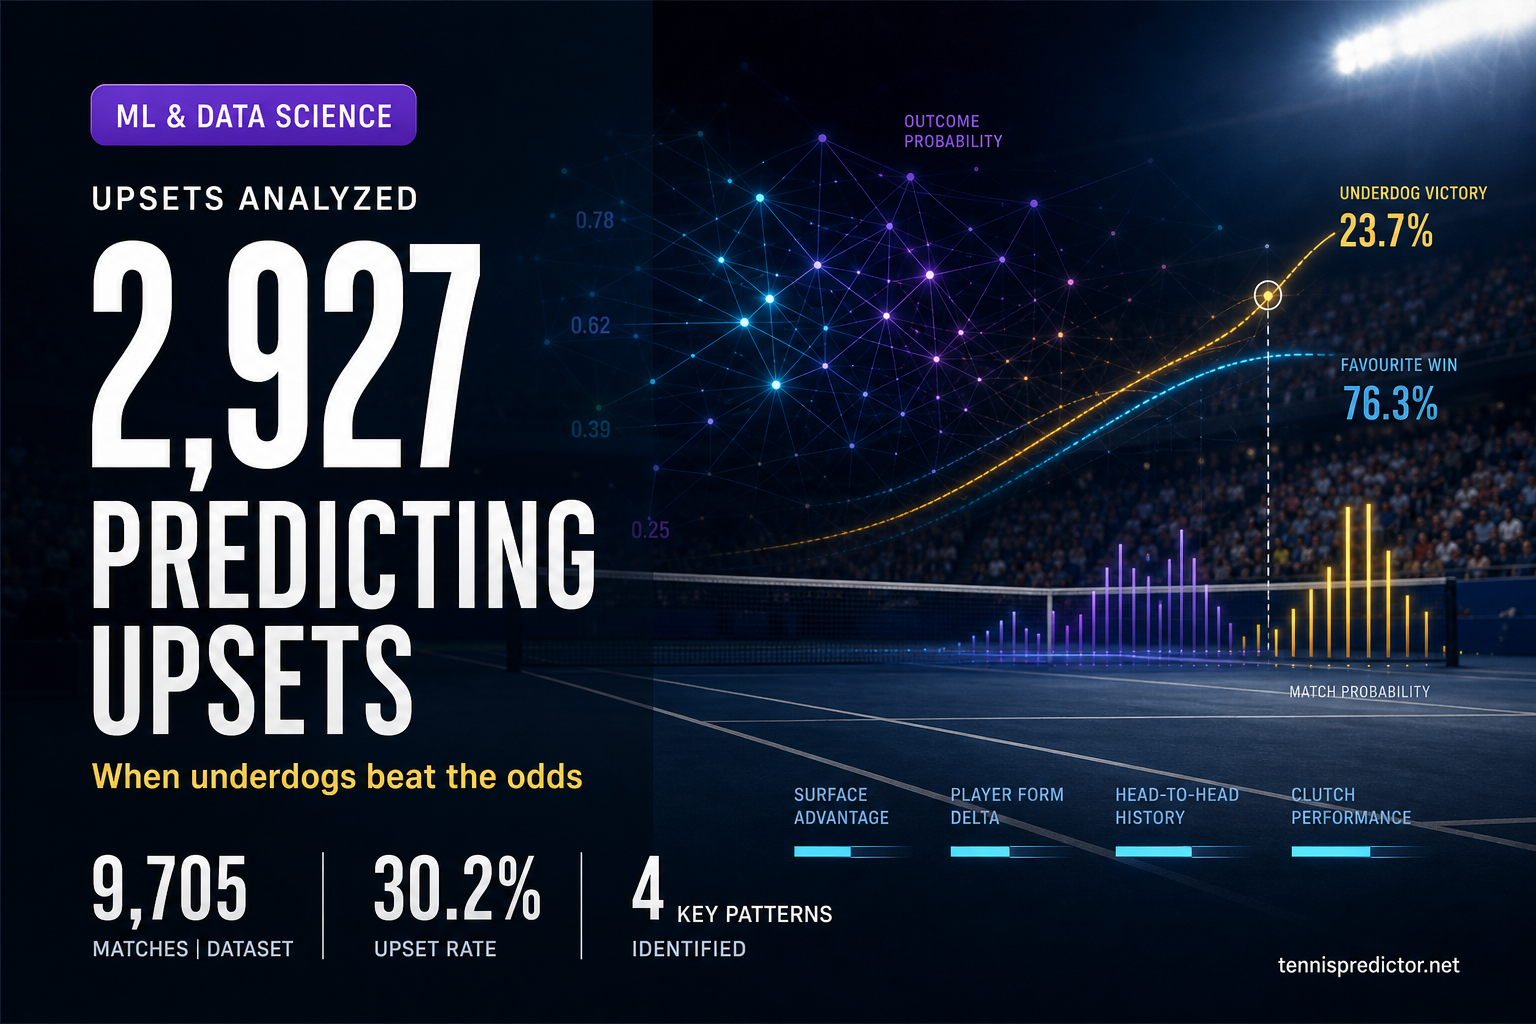
30.2% of tennis matches end in upsets—but they're not random. After analyzing 2,927 upset victories, we've identified four key triggers that appear in 61.8% of underdog wins. Form advantage dominates, rest matters more than you think, and betting markets consistently misprice the 51-100 ranking gap. This is where the value lives.

When our ML model gets it wrong: lessons from failed predictions
October 28, 2025: We predicted Etcheverry to beat Carabelli with 88.4% ensemble confidence. He lost in straight sets. This is the complete failure analysis—the data scarcity (7 indoor matches), the overlooked energy gap, and the five red flags we missed. Transparency matters. Failures teach more than wins.