Alexander Zverev: the consistent threat who defies betting markets
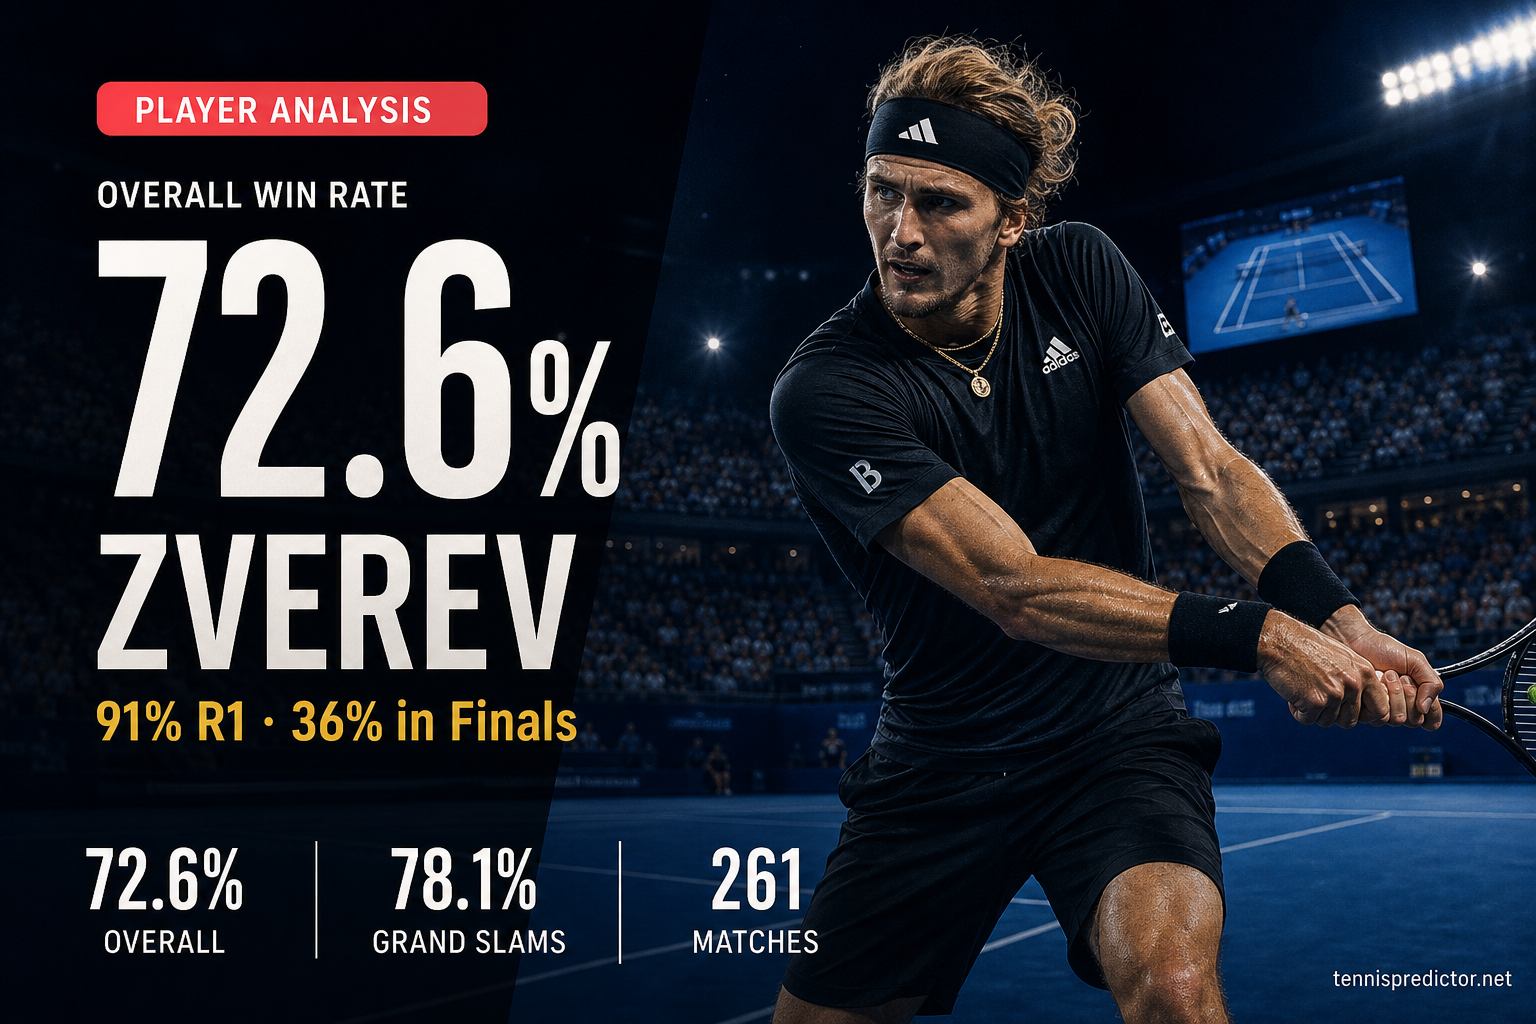
Alexander Zverev ranks inside the world's top three and has played 234 ATP matches in our dataset from 2022 to 2025. His 72.2% overall win rate makes him a reliable favourite in most matchups — and yet the market consistently misprices him at the critical stages where he has earned his reputation for late-round collapses. This article maps every surface, round, and rivalry in his profile, and builds an honest betting guide from what the data actually shows.
Key metrics at a glance
| Metric | Value |
|---|---|
| Overall win rate | 72.2% |
| Dataset rank (end of period) | 3 |
| Matches analysed | 234 (2022–2025) |
| Best surface | Clay — 75.3% |
| Grand Slam win rate | 78.1% |
| Worst surface | Indoors — 66.7% |
| As market favourite | 81.7% |
| As underdog | 40.7% |
Zverev's year-by-year record
The trajectory is the most important context for any current Zverev analysis.
| Year | Matches | Wins | Win rate |
|---|---|---|---|
| 2022 | 15 | 12 | 80.0% |
| 2023 | 32 | 21 | 65.6% |
| 2024 | 34 | 24 | 70.6% |
| 2025 | 33 | 19 | 57.6% |
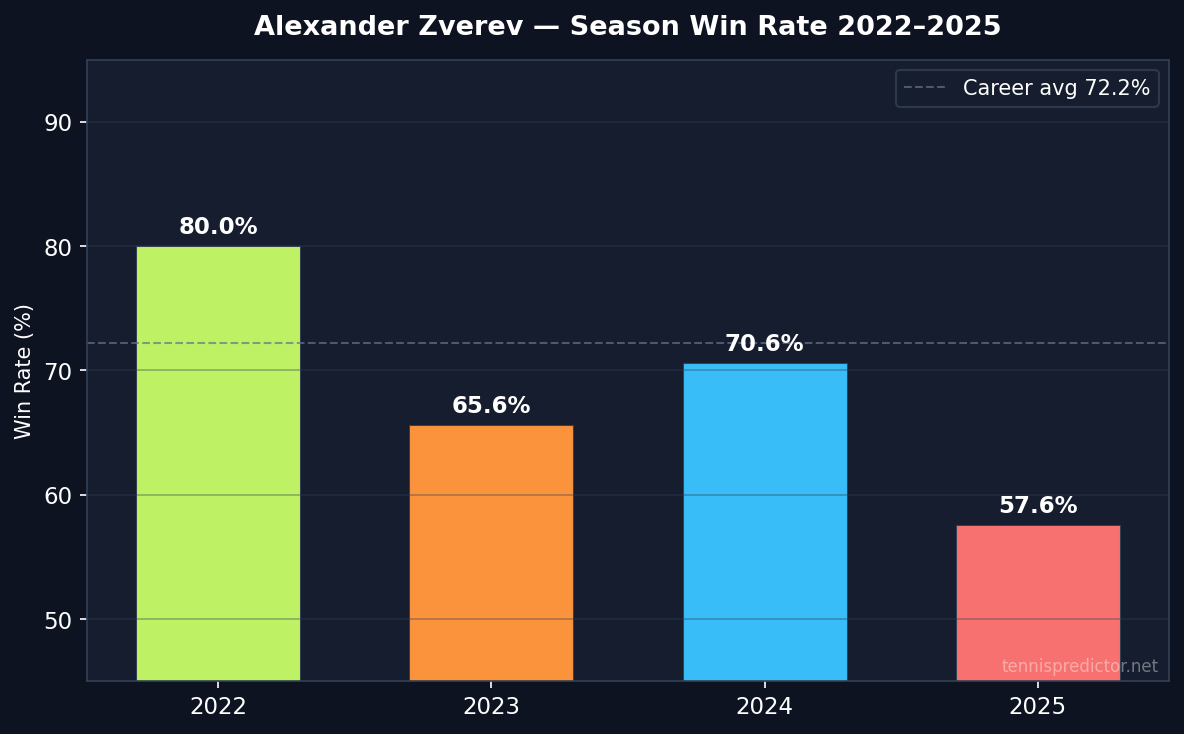
Win rate by season, Alexander Zverev, 2022–2025. Source: ATP match data via tennispredictor.net
Zverev's career trajectory over this period runs in the opposite direction to Sinner's. In 2022 he was at peak dominance (80.0% win rate, 15 matches captured before his Roland Garros ankle injury ended the season early). The 2023 comeback year produced a softer 65.6% across 32 matches — understandable given he was returning from serious ligament damage. The 2024 rebound to 70.6% suggested stabilisation, but 2025 has brought a further decline to 57.6% across 33 matches, driven by inconsistency against top-ten opposition and a run of narrow losses in deciding sets.
The key question for 2025 and 2026 betting: is the declining trend a form cycle that will reverse, or a structural plateau? The H2H data below gives some indication.
Surface breakdown: clay is his home
Unlike most hard-court-first players at the top of the rankings, Zverev's best surface is clay, and the gap is meaningful.
| Surface | Matches | Win rate |
|---|---|---|
| Clay | 97 | 75.3% |
| Grand Slam | 64 | 78.1% |
| Grass | 24 | 70.8% |
| Hard | 106 | 69.8% |
| Indoors | 6 | 66.7% |
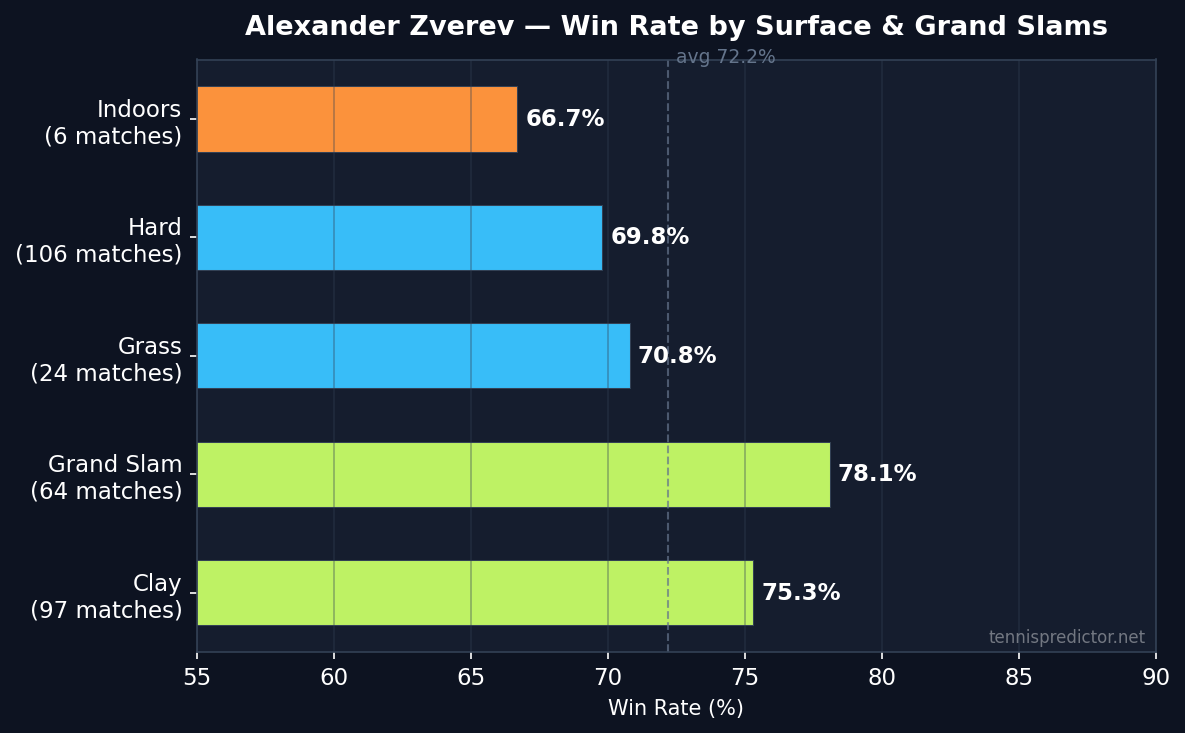
Win rate by surface, Alexander Zverev, 2022–2025. Source: ATP match data via tennispredictor.net
Zverev's 75.3% on clay (97 matches — the largest surface sample in his dataset) is 5.5 percentage points above his hard-court rate of 69.8%. That gap is large enough to be exploitable: when Zverev faces a hard-court specialist on clay, the surface premium is real and often underpriced by the market.
His Grand Slam figure of 78.1% (64 matches) is notably the highest category, sitting 5.9 points above his overall average. Unlike Sinner where the Grand Slam premium is partly explained by hard-court Slam dominance, Zverev's figure holds across all four majors including Roland Garros (clay) and Wimbledon (grass). Best-of-five tennis appears to suit his physical game — he has exceptional stamina and a serve that becomes more dominant in longer matches.
Grass at 70.8% is respectable given he is not a serve-and-volley player. The indoors figure (66.7%, 6 matches) is the weakest in the table, but the sample is too thin to draw firm conclusions.
For betting purposes: Zverev's clay premium is the most consistent surface signal in his profile. When the market prices him at rough parity with a hard-court opponent on clay, the data consistently supports taking his side.
The round ceiling: the most distinctive feature in Zverev's data
No section of this analysis tells a clearer story than round-by-round performance. Zverev's late-round collapse is not myth — it is a measurable, persistent statistical pattern.
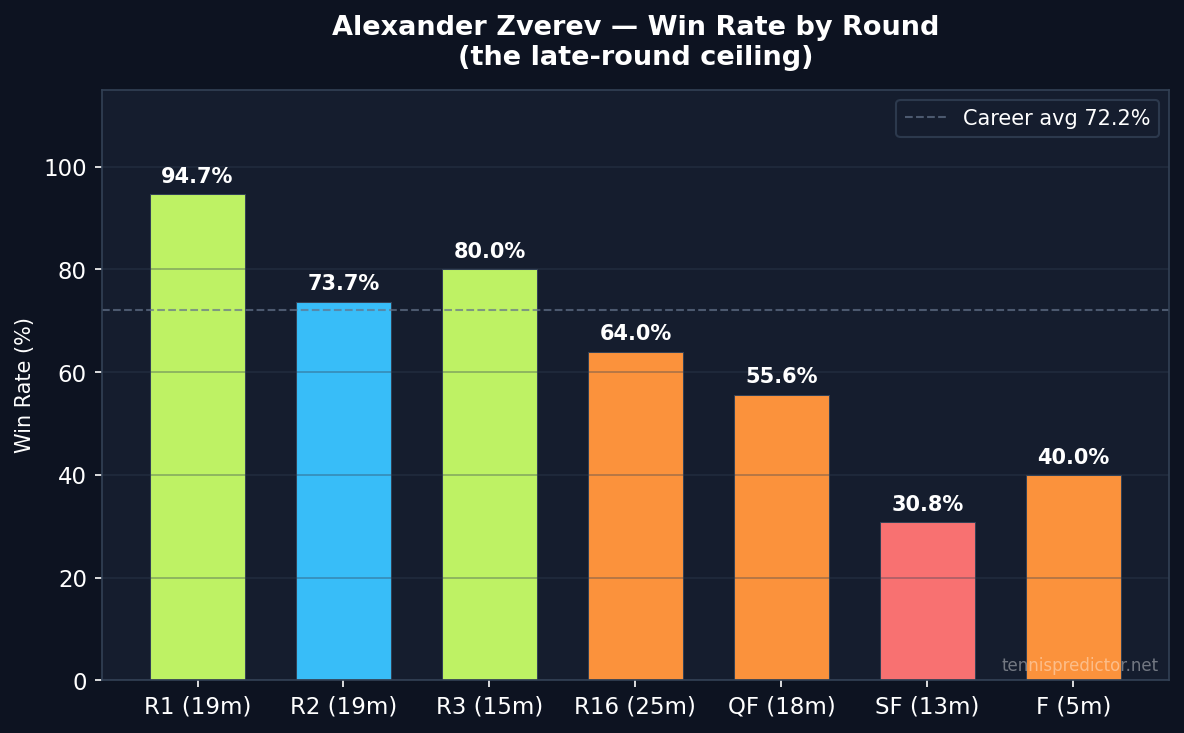
Win rate by round, Alexander Zverev, 2022–2025. Source: ATP match data via tennispredictor.net
| Round | Matches | Win rate |
|---|---|---|
| R1 | 19 | 94.7% |
| R3 | 15 | 80.0% |
| R2 | 19 | 73.7% |
| R16 | 25 | 64.0% |
| QF | 18 | 55.6% |
| Final | 5 | 40.0% |
| SF | 13 | 30.8% |
The progression is stark. Zverev converts 94.7% of first-round matches and 80.0% of third-round matches. By the round of 16 he is at 64.0%, right at the ATP average for favourites on any surface. The QF drops to 55.6%, the final to 40.0%, and the SF — remarkably — to just 30.8% across 13 matches.
The SF number is the most striking. Thirteen semifinal appearances is a large enough sample to be statistically meaningful, and converting fewer than one in three of them is well below what his overall profile would predict. A player with a 72.2% overall win rate should, in theory, win approximately 60–65% of semifinals against opponents he has already beaten to reach the last four. The actual figure of 30.8% represents a 30-percentage-point underperformance at that specific stage.
Several explanations have been offered for this pattern: physical fatigue accumulated over five hard-fought rounds, an opponent quality concentration effect at the SF stage, and psychological factors in two-set-to-serve-for-the-match situations. What matters for betting is that the pattern is consistent across years and surfaces, not concentrated in any single tournament.
The implication: when Zverev reaches a semifinal, the market typically prices him based on his overall win rate and ranking. The actual SF data suggests a much lower probability of advancing.
H2H against the elite
The H2H picture reinforces the "ceiling" narrative. Zverev has solid records against players outside the top tier but significantly negative win rates against the absolute elite.
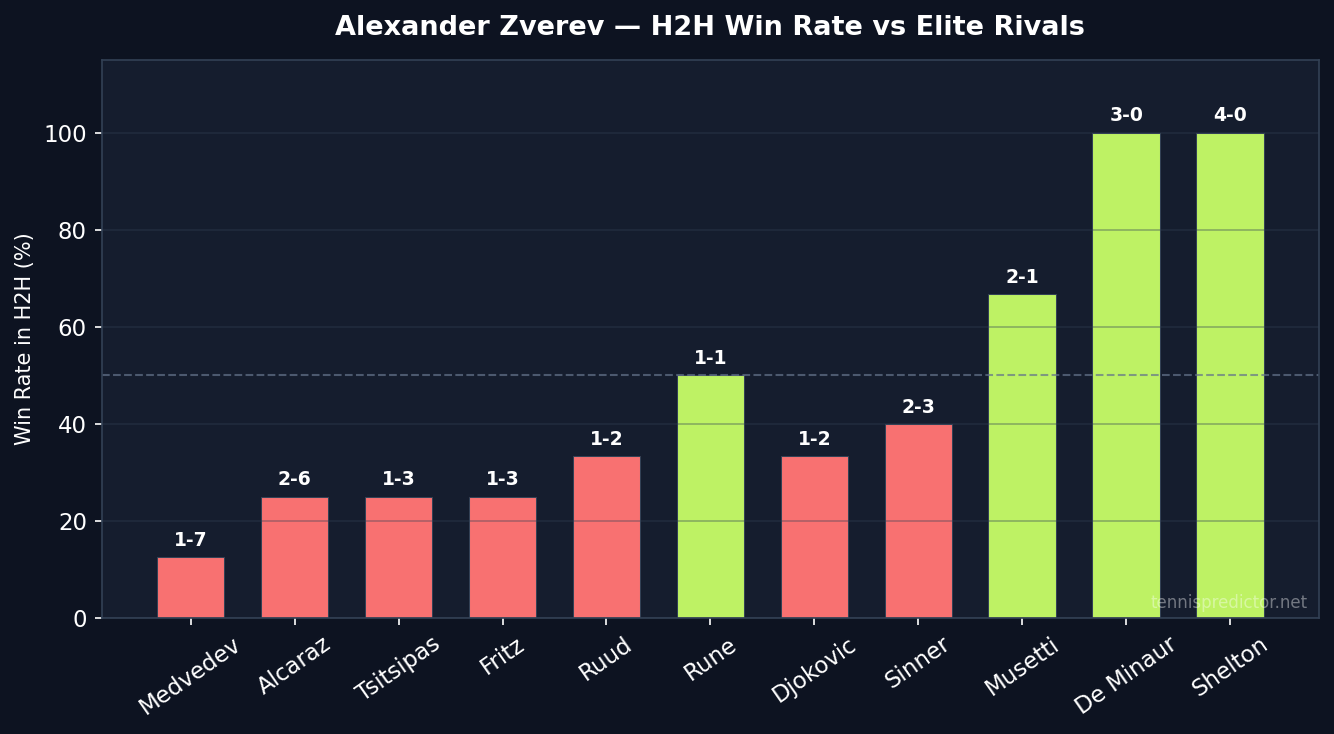
H2H win rate vs rivals with 2+ meetings in the dataset, Alexander Zverev, 2022–2025. Source: ATP match data via tennispredictor.net
| Opponent | Record | H2H win rate |
|---|---|---|
| Shelton | 4–0 | 100.0% |
| De Minaur | 3–0 | 100.0% |
| Musetti | 2–1 | 66.7% |
| Djokovic | 1–2 | 33.3% |
| Sinner | 2–3 | 40.0% |
| Alcaraz | 2–6 | 25.0% |
| Tsitsipas | 1–3 | 25.0% |
| Fritz | 1–3 | 25.0% |
| Medvedev | 1–7 | 12.5% |
| Ruud | 1–2 | 33.3% |
The division is clean. Against Shelton and De Minaur — both top-10, both strong players — Zverev is 7–0 and shows no signs of vulnerability. Against Medvedev (1–7), Alcaraz (2–6), Fritz (1–3), and Tsitsipas (1–3), he has consistently negative records.
The Medvedev record is the most dramatic: 1 win from 8 matches (12.5%) against a player who was ranked lower than Zverev for much of this period. Their stylistic matchup — Medvedev's counterpunching against Zverev's serve-and-power game — appears to systematically favour the Russian across all surfaces in this sample.
Alcaraz at 2–6 follows a similar pattern. Even when Zverev has been in comparable or better form, Alcaraz's athleticism and variety in pressure moments has consistently found a way through.
The practical output: when Zverev faces any of Medvedev, Alcaraz, Fritz, or Tsitsipas in the draw, the market's price based on rankings often underestimates his opponent's H2H advantage. These are the matchups where fading Zverev has the clearest historical backing.
As market favourite vs underdog
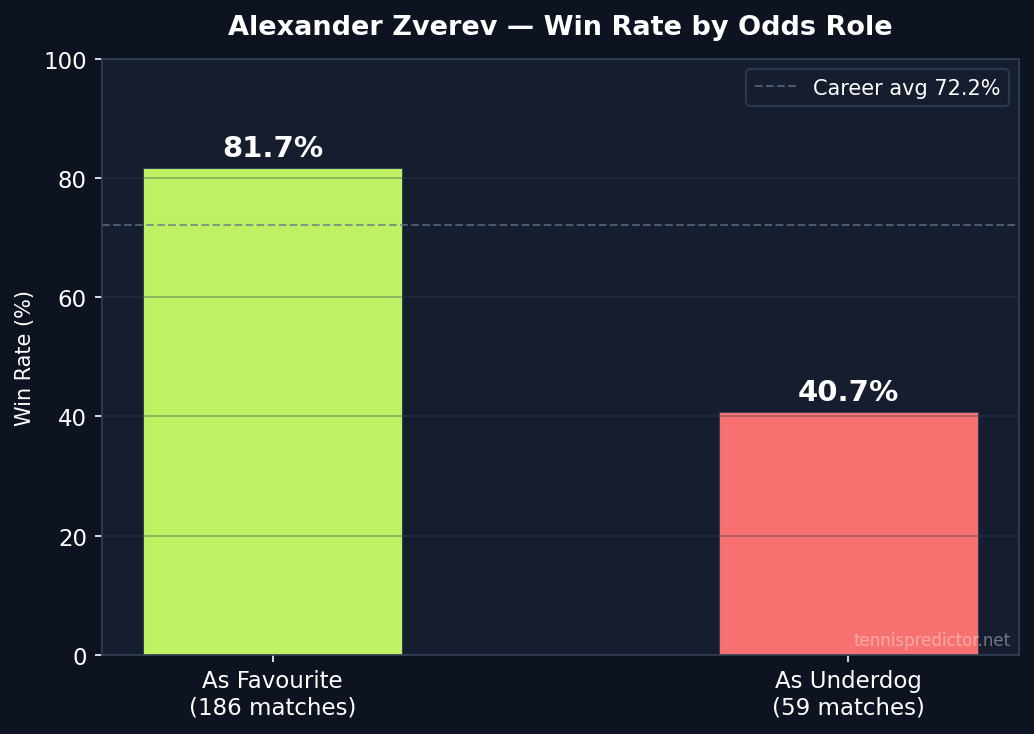
Win rate as market favourite vs underdog, Alexander Zverev, 2022–2025. Raw tournament cache. Source: tennispredictor.net
The split here reveals a significant asymmetry that is crucial for betting assessment.
Zverev converts 81.7% of matches as market favourite (186 matches). That is a robust rate — above the ATP surface average and consistent with his ranking. However, as an underdog across 59 matches, he wins just 40.7%. That is notably low for a player ranked inside the global top three.
Most top-three players retain a 55–65% win rate when listed as underdogs, because the market prices them close to even money in genuine 50/50 matchups. Zverev's 40.7% underdog rate suggests he genuinely loses more than expected in matches where the market has correctly assessed him as the inferior player. This is consistent with the H2H data — when facing Medvedev, Alcaraz, or Fritz, Zverev's actual win rate in those matchups is lower than even the underdog pricing implies.
What the betting market misses about Zverev
Three specific patterns emerge that the market prices imperfectly:
The SF fade. Zverev reaches semifinals regularly — his route-to-SF rate is one of the highest in the dataset. But the market prices his SF appearances based on his overall 72.2% win rate and his ranking advantage over most opponents. His actual 30.8% SF conversion is far below that implied rate. Backing his SF opponents, when they are top-15 players with positive recent form, is the most statistically robust edge in Zverev's entire profile.
The clay premium. Zverev's 75.3% clay win rate vs 69.8% hard-court rate is a 5.5-point gap. When he faces a hard-court specialist on clay at pricing that implies rough parity, the clay signal supports his side. This is especially true in the early rounds of clay events where opponents have not fully adapted to the surface.
The Medvedev discount. A player ranked outside the top five — Medvedev, at the time of writing — has a 7–1 H2H against a world top-three player. That is a remarkable distortion that the market continues to partially ignore by pricing Zverev near 50/50 in their meetings. The H2H signal is large enough to override ranking-based pricing.
How our model treats Zverev
The model applies several adjustments specific to Zverev's profile:
- Clay surface boost — 75.3% clay win rate triggers an upward adjustment on clay events, particularly in mid-tournament rounds
- Late-round penalty — the model applies a small downward adjustment for QF and SF stage predictions based on the documented round ceiling
- H2H overrides — Medvedev, Alcaraz, and Fritz H2H records are flagged explicitly and reduce Zverev's predicted probability in those matchups
- Form sensitivity — Zverev's 2025 form drop (57.6%) means rolling windows are currently showing a lower confidence tier than his career average alone would suggest
Where the model is most uncertain: Zverev in five-set Grand Slam situations against lower-ranked clay specialists, where his GS premium and clay premium both apply but the opponent's clay record may also be strong.
Dataset and methodology
All statistics in this article are sourced from our ATP match dataset covering January 2022 through October 2025. The analysis covers ATP Tour events only (no Challengers, no Davis Cup). Favourite/underdog classifications are based on match-day market odds extracted from the raw tournament cache. The training dataset is ATP Tour only; WTA matches are excluded throughout.
The one important caveat for the round-by-round data: Zverev's 2022 sample is smaller than other years due to his Roland Garros injury, which may slightly reduce the weight of the SF/Final figures for that season. The 13-match SF sample remains robust enough for conclusions despite this.
Frequently asked questions
What is Alexander Zverev's overall win rate in this study?
72.2% across 234 matches from 2022 to 2025. That places him third behind Sinner (82.3%) and Alcaraz (approximately 78%) among active players in the dataset. It is a genuinely elite win rate; the nuance is in which rounds and which opponents produce the losses.
Which surface shows Zverev's highest win rate?
Clay at 75.3% over 97 matches — his largest surface sample and his strongest surface by a clear margin. Grand Slam events show 78.1% across all four majors, partly reflecting the best-of-five format advantage.
How often does Zverev lose when installed as market favourite?
He wins 81.7% of matches as favourite (186 matches). That equates to roughly 1 in 5 favoured matches ending in an upset — slightly above the ATP surface average of approximately 35–36% upset rate, but still well above 50%.
What is Zverev's Grand Slam win rate?
78.1% across 64 Grand Slam matches. That is 5.9 points above his overall average and significantly above his hard-court or grass-court win rates, suggesting the major championships format specifically suits his game.
Who is Zverev's toughest matchup in the data?
Medvedev by a wide margin at 1–7 (12.5% H2H win rate across 8 meetings). Alcaraz at 2–6 is the second most difficult. Fritz (1–3) and Tsitsipas (1–3) are also negative, though with smaller samples. Against every other rival in the dataset Zverev is above break-even.
When is Zverev worth backing or fading?
Back him in early-to-mid clay season rounds against hard-court specialists. Back him confidently in first rounds on any surface (94.7% historical conversion). Fade him at the semifinal stage regardless of surface or opponent when the market prices him near 50/50 or better. Fade him against Medvedev and Alcaraz at any stage.
How reliable are the round-by-round statistics?
The first-round sample (19 matches), QF sample (18 matches), and SF sample (13 matches) are all large enough to be meaningful. The Final sample (5 matches) is too thin to draw firm conclusions, though the 40.0% final win rate is consistent with the late-round ceiling pattern seen in QF and SF data. The overall trend — high early, declining sharply at SF — is consistent across all four years in the dataset.
How does the model handle Zverev's 2025 form decline?
The model weights recent form (last 5, last 10 matches) alongside career history. Zverev's 57.6% win rate in 2025 has pulled his rolling windows downward, which means the model currently assigns him a lower confidence tier than his ranking alone would suggest, particularly in matches against top-10 opponents where his H2H records are already negative.
Conclusion
Alexander Zverev's profile is one of the most strategically rich in the entire ATP dataset. His overall 72.2% win rate and clay specialist status make him a reliable early-round favourite. His Grand Slam record (78.1%) is better than his overall figure, driven by the endurance advantages of best-of-five tennis. But the round ceiling — documented across 13 SF appearances at 30.8% and 18 QF appearances at 55.6% — is the most persistent and actionable signal in his data.
The three things to watch heading into 2026: whether his 2025 form trough is a temporary valley or a structural step-change as the next generation of hard-court players matures; whether his clay record holds against an increasingly competitive field at Roland Garros; and whether the Medvedev H2H finally corrects in Zverev's favour given Medvedev's own recent form volatility.
Until those questions resolve, the betting strategy is clear: trust him early, fade him late.
For comparison with another top-five player's round-by-round profile, see the Rublev quarter-final ceiling analysis, which documents a similar late-round phenomenon.
For Zverev's most challenging surface matchups, the clay court betting guide provides tournament-level context on how clay specialists compare.
For his most frequent elite opponent, see the Sinner prediction anomaly analysis.
All statistics sourced from ATP match data 2022–2025. Analysis covers ATP Tour events only. Data extracted October 2025 and updated March 2026.
See today's match predictions with confidence scores and value signals.
View Live Predictionsarrow_forwardRelated Articles
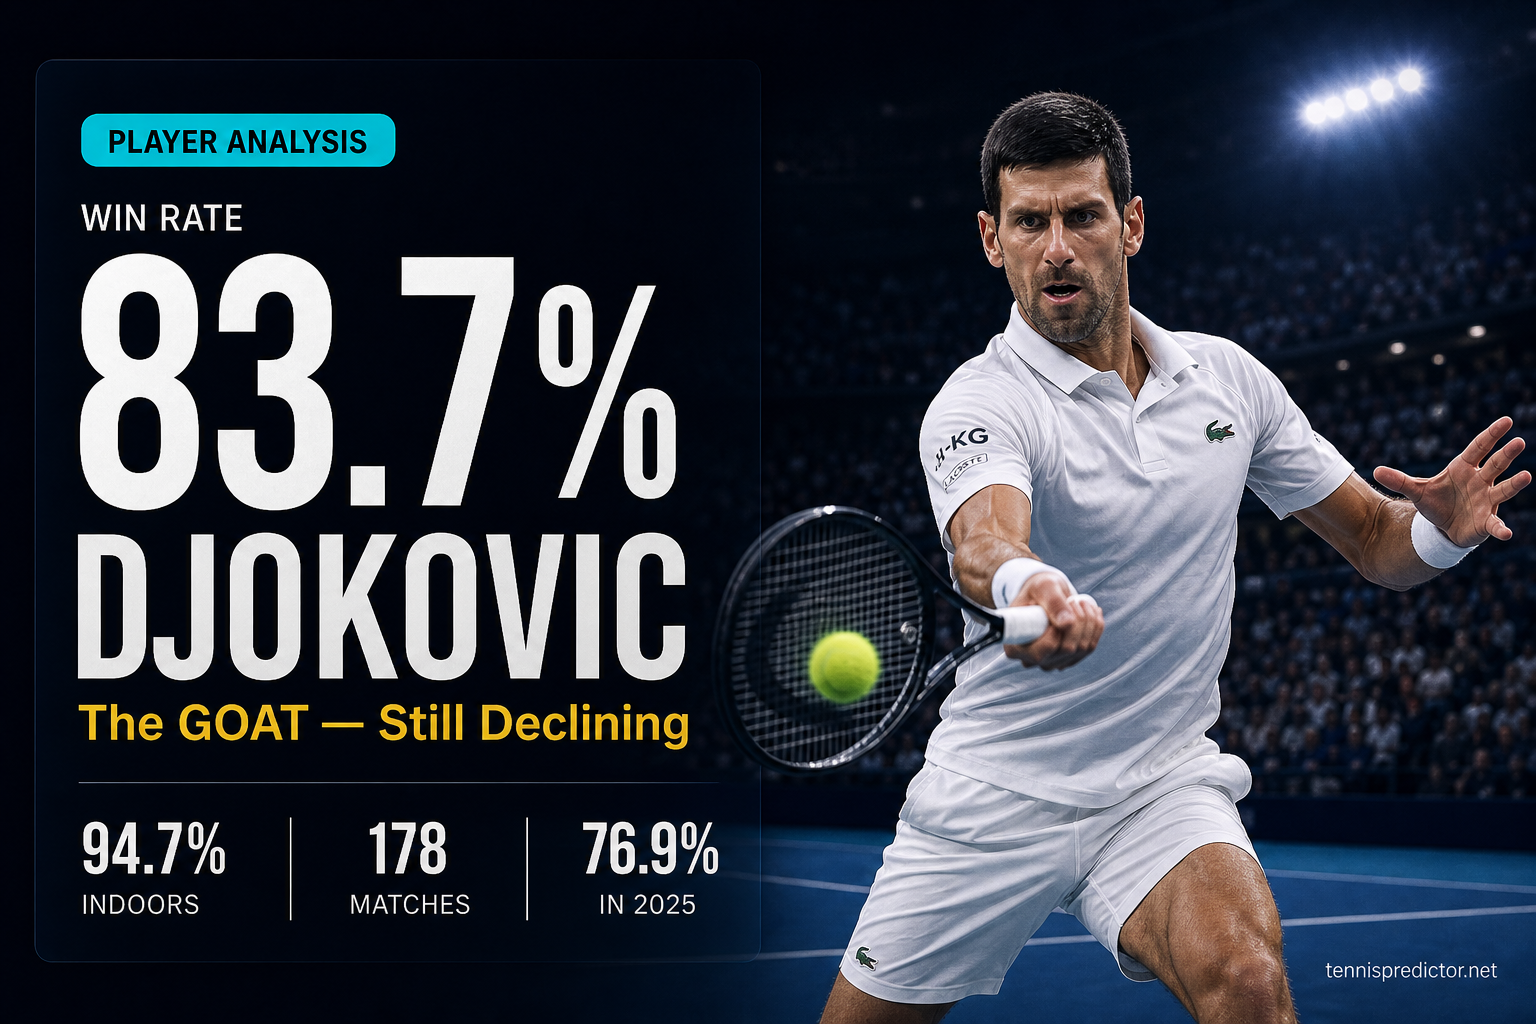
Novak Djokovic: the GOAT data profile — still elite, finally trending down
Djokovic has played 178 matches since 2022 at an 83.7% win rate across all surfaces. Indoors at 94.7%, grass at 88.9%, Grand Slams at 88.2% — the numbers are extraordinary. But the annual decline from 91.3% in 2022 to 76.9% in 2025 tells a different story for forward-looking bets.
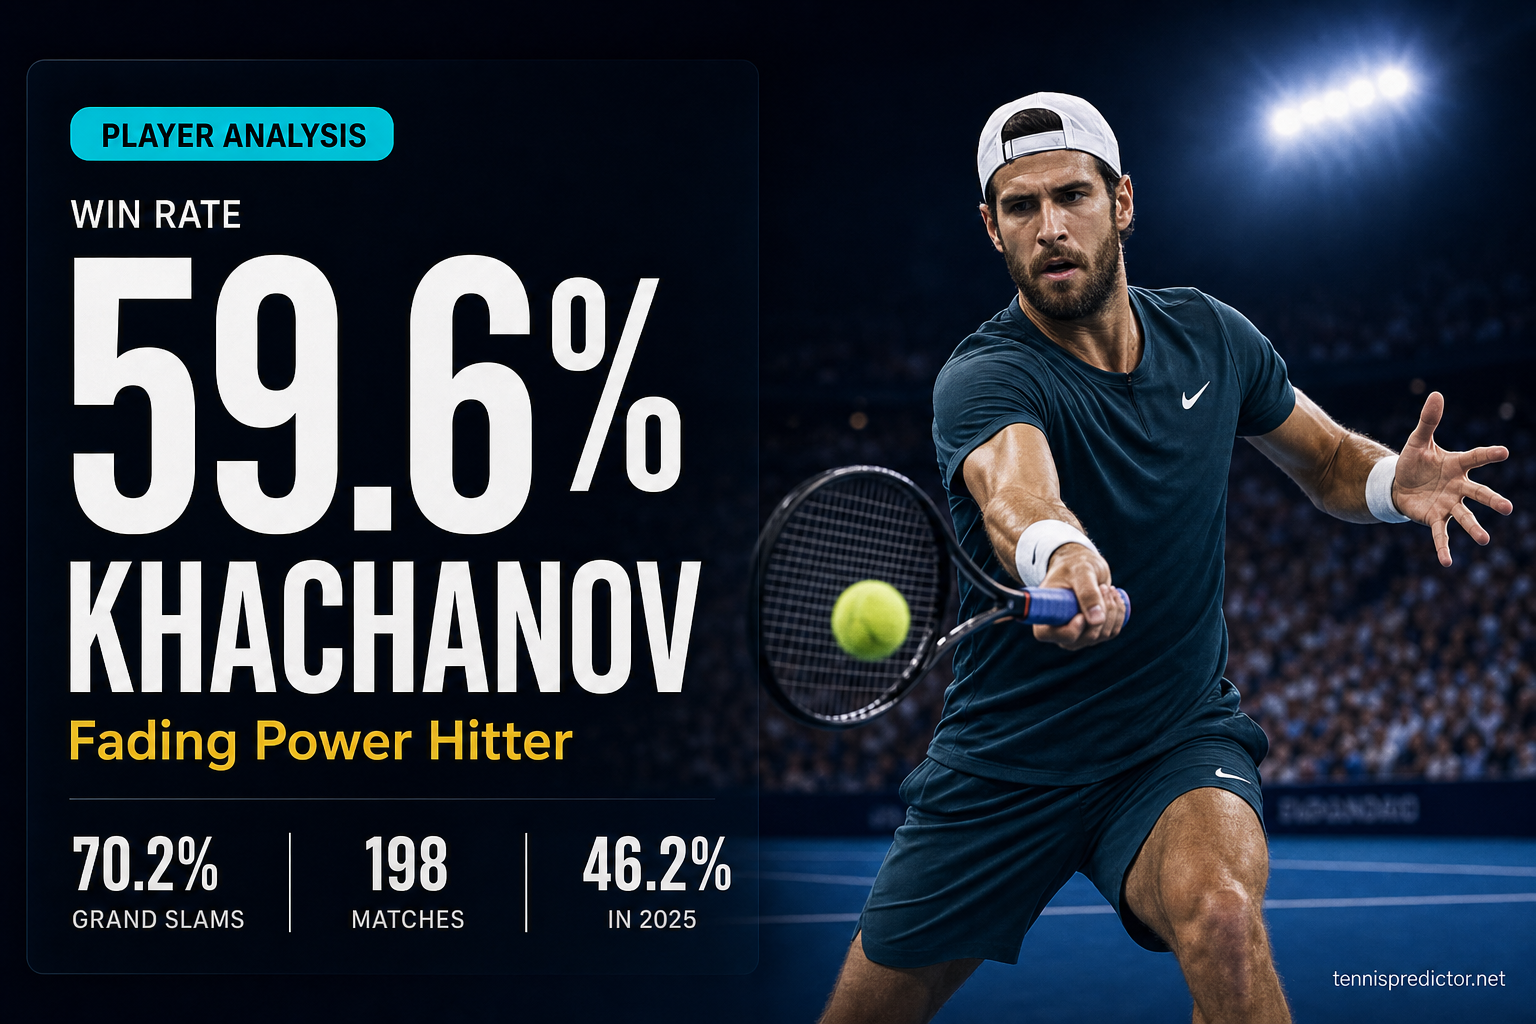
Karen Khachanov: the fading power hitter who loses to everyone below him
Khachanov has played 198 matches across four seasons with a declining trajectory: 62.5% in 2022 to 46.2% in 2025. His Grand Slam win rate of 70.2% remains above his overall average, but a 30.8% underdog rate and 0-15 combined vs five elite opponents define the ceiling.
Andrey Rublev: consistency meets the quarter-final ceiling
Rublev is 13-0 at Grand Slam round 2 and 0-6 at Grand Slam quarter-finals. We analysed 253 matches (2022–2025) to find the structural pattern behind one of the most predictable round-ceilings in men's tennis — and the betting markets it consistently mis-prices.
Carlos Alcaraz: predicting the unpredictable
Elite win rate, real upset risk: we break down 268 Alcaraz matches with tables, five charts, FAQs, and when short odds are mathematically shaky.