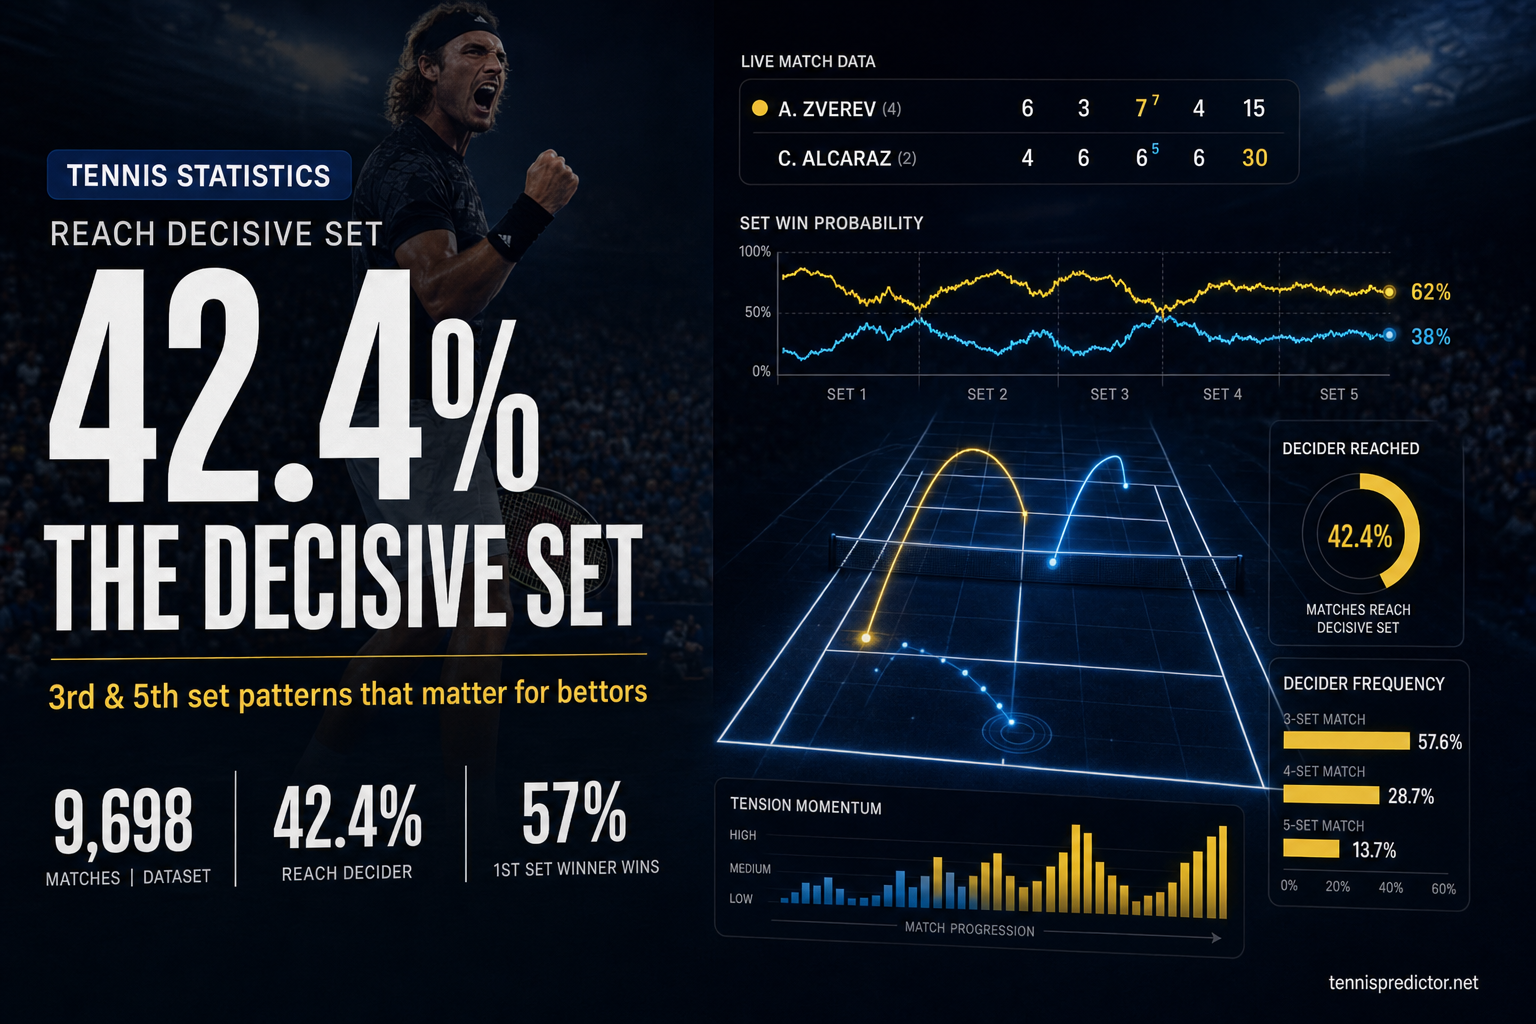
The decisive set: third set & fifth set statistics that matter for bettors
Key figures at a glance
| Question | Result (9,698 matches) |
|---|---|
| Share of matches that reached a deciding set | 42.35% (4,107 / 9,698) |
| Straight-set wins (2–0 or 3–0) | 57.65% (5,591) |
| First-set winner wins if match went deciding | 57.0% (2,341 vs 1,766 comebacks) |
| Grand Slam: % reaching a deciding set | 65.74% (330 / 502) |
| Grand Slam: first-set winner wins if deciding | 69.09% |
| ATP Tour (non–Grand Slam in this split): deciding rate | 41.07% |
| ATP Tour: first-set winner wins if deciding | 55.94% |
How to read the headline “57%”: it is conditional. It applies to the 4,107 matches that actually went to a third or fifth set—not to every match on the calendar.
Why bettors overweight “momentum” in the decider
Broadcast commentary loves momentum language: whoever “owns” the third set narrative is treated like a fait accompli. The 43% comeback rate among deciding-set matches is a useful antidote. Comebacks are not miracles—they are structural. Players who return well, redirect pace, or simply get a read on serve patterns can flip a match even after losing a tight opener.
That does not mean the first set is irrelevant. It means the first set is one input among many—along with fitness, same-day recovery, travel load, and whether the opponent’s game style tightens under pressure. When you price a live bet after set one, you are not solving “who felt better for forty minutes”; you are estimating win probability conditional on everything still left to play.
Best-of-three vs best-of-five: two different animals
It is tempting to merge “three-set tennis” and “five-set tennis” into one mental bucket because both can “go long.” That would blur two different variance regimes.
In best-of-three, the third set is the first time the match can end without a player having banked a two-set lead. The distribution of outcomes is dominated by week-to-week tour players who rarely play five sets in a season.
In best-of-five, a four-set match is often a story of one player dominating early, then dropping concentration—or the inverse—while a five-set match selects for physical resilience and shot tolerance. That is why our Grand Slam bucket shows both a higher share of matches that eventually require a final set and a higher first-set winner conversion when conditioning on those long matches: the format and the draw jointly filter who is left standing.
If you import a tour-wide 57% figure into a Wimbledon quarter-final without adjusting for opponent quality, you will mis-calibrate. Use the split table as your starting point, then layer match-specific context.
What counts as a “deciding set” in this article?
For best-of-three, a match “went deciding” if it lasted three sets (the third set decided the winner). For best-of-five, we require five sets (the fifth set decided the winner). Matches that end 2–1 in sets in a best-of-five (i.e. four sets played) are not labelled “deciding set” here—those are long matches, but the winner was already known before a hypothetical fifth set.
We derive the first-set winner by comparing set scores to the match winner flag in the same record. If parsing fails for a line in the score string, we drop that match from denominators—hence 9,698 scored matches rather than “every row in the cache.”
Why we exclude messy scorelines instead of guessing
Betting research should prefer transparent drops over silent imputation. If a score contains irregular tokens—walkover notes, partially recorded retirements, or nonstandard separators—we exclude the row rather than infer set winners. That choice lowers sample size slightly but raises trust: the percentages you see are not stitched together from half-known outcomes.
If you compare our denominators to a raw “count every fixture row” query, you should expect small gaps. The gap is a feature: it is the set of matches where both the winner and every set scoreline are mutually consistent under our parser.
Examples of scorelines that map cleanly
- Best-of-three decider:
6-4, 3-6, 6-3→ three sets; first set won by the player who took 6–4; match winner is whoever took the third set. - Best-of-five decider:
6-7, 7-6, 4-6, 7-6, 6-4→ five sets; first-set winner is whoever won the first tiebreak set; match winner is the fifth-set victor.
These examples are illustrative of structure, not specific matches.
How often do matches go to a deciding set?
Across all parseable scores:
- Straight sets (2–0 or 3–0): 5,591 matches (57.65%)
- Deciding set (2–1, 3–1, or 3–2 in our scoring convention): 4,107 matches (42.35%)
So more than two in five contests in this ATP sample produced a final-set verdict. That single fact should reset intuition for total sets and over/under style markets: three-set tennis is not a rare novelty—it is a structural feature of the tour.
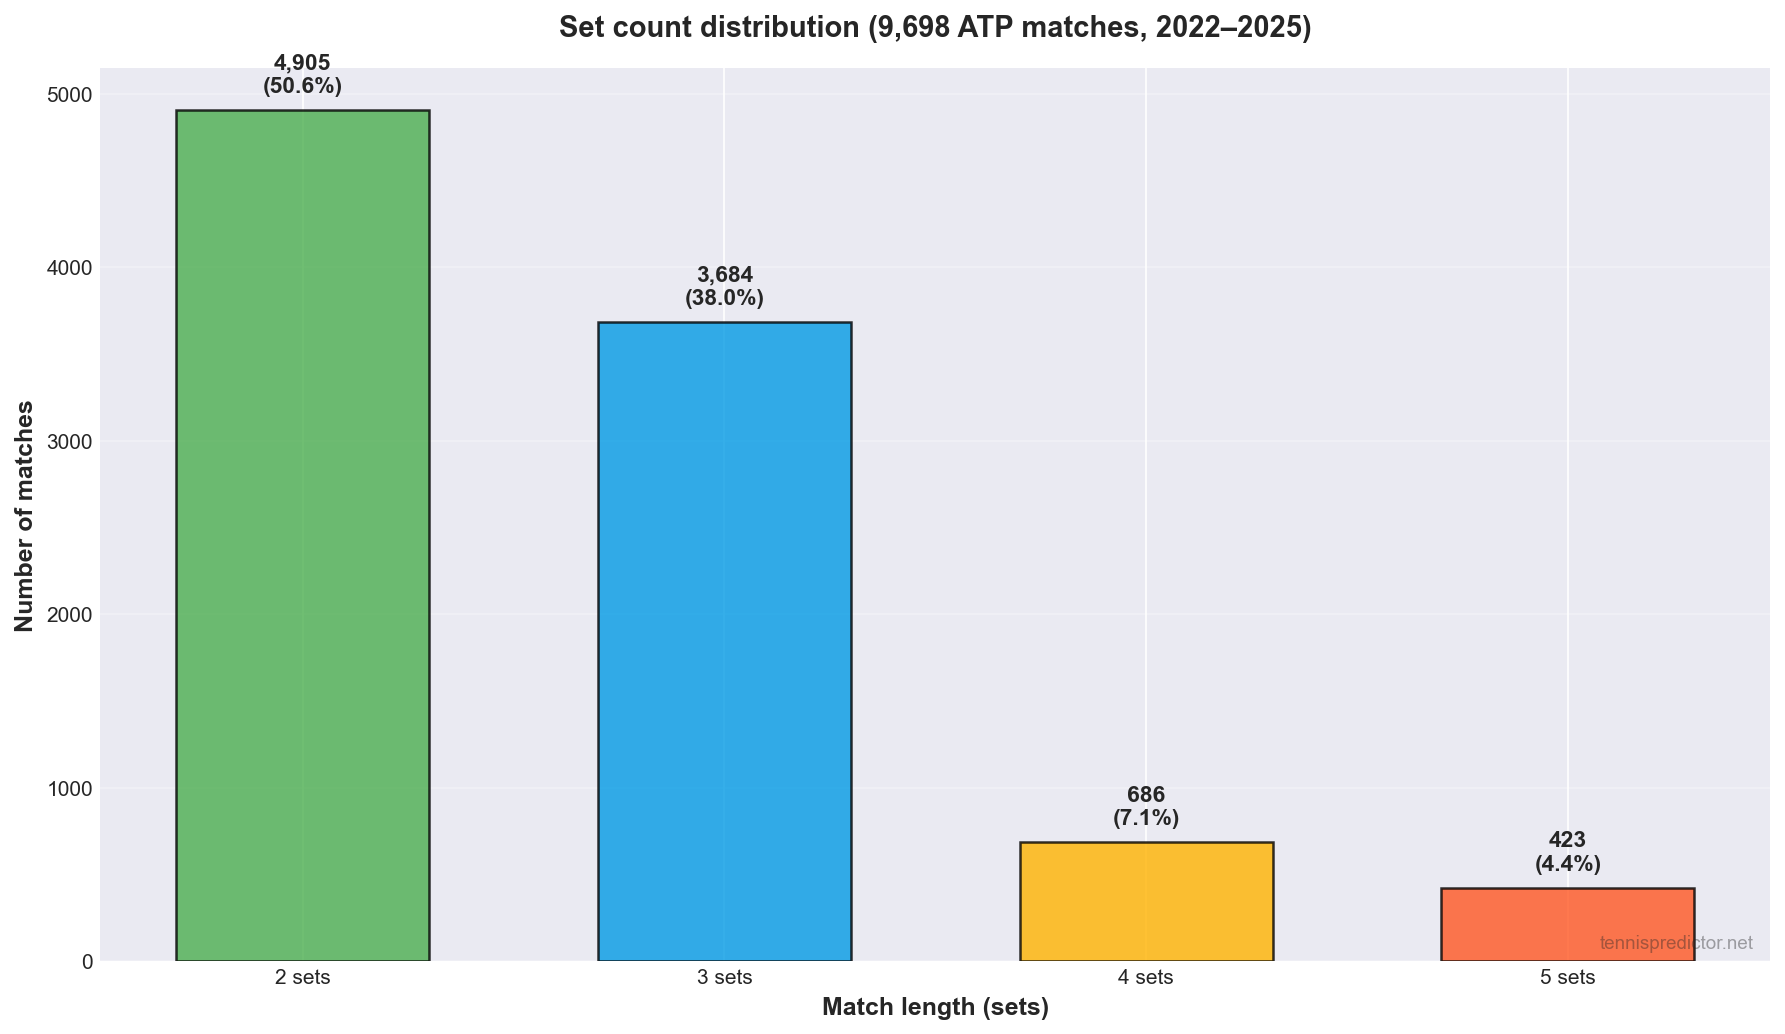
Figure 1: Straight-set wins versus matches that reached a deciding third or fifth set.
Breakdown by number of sets played:
| Sets played | Matches | Share of sample |
|---|---|---|
| 2 | 4,905 | 50.6% |
| 3 | 3,684 | 38.0% |
| 4 | 686 | 7.1% |
| 5 | 423 | 4.4% |
Most tour tennis is best-of-three, which is why two-set and three-set outcomes dominate. Four- and five-set outcomes come almost entirely from best-of-five draws (chiefly Grand Slams).
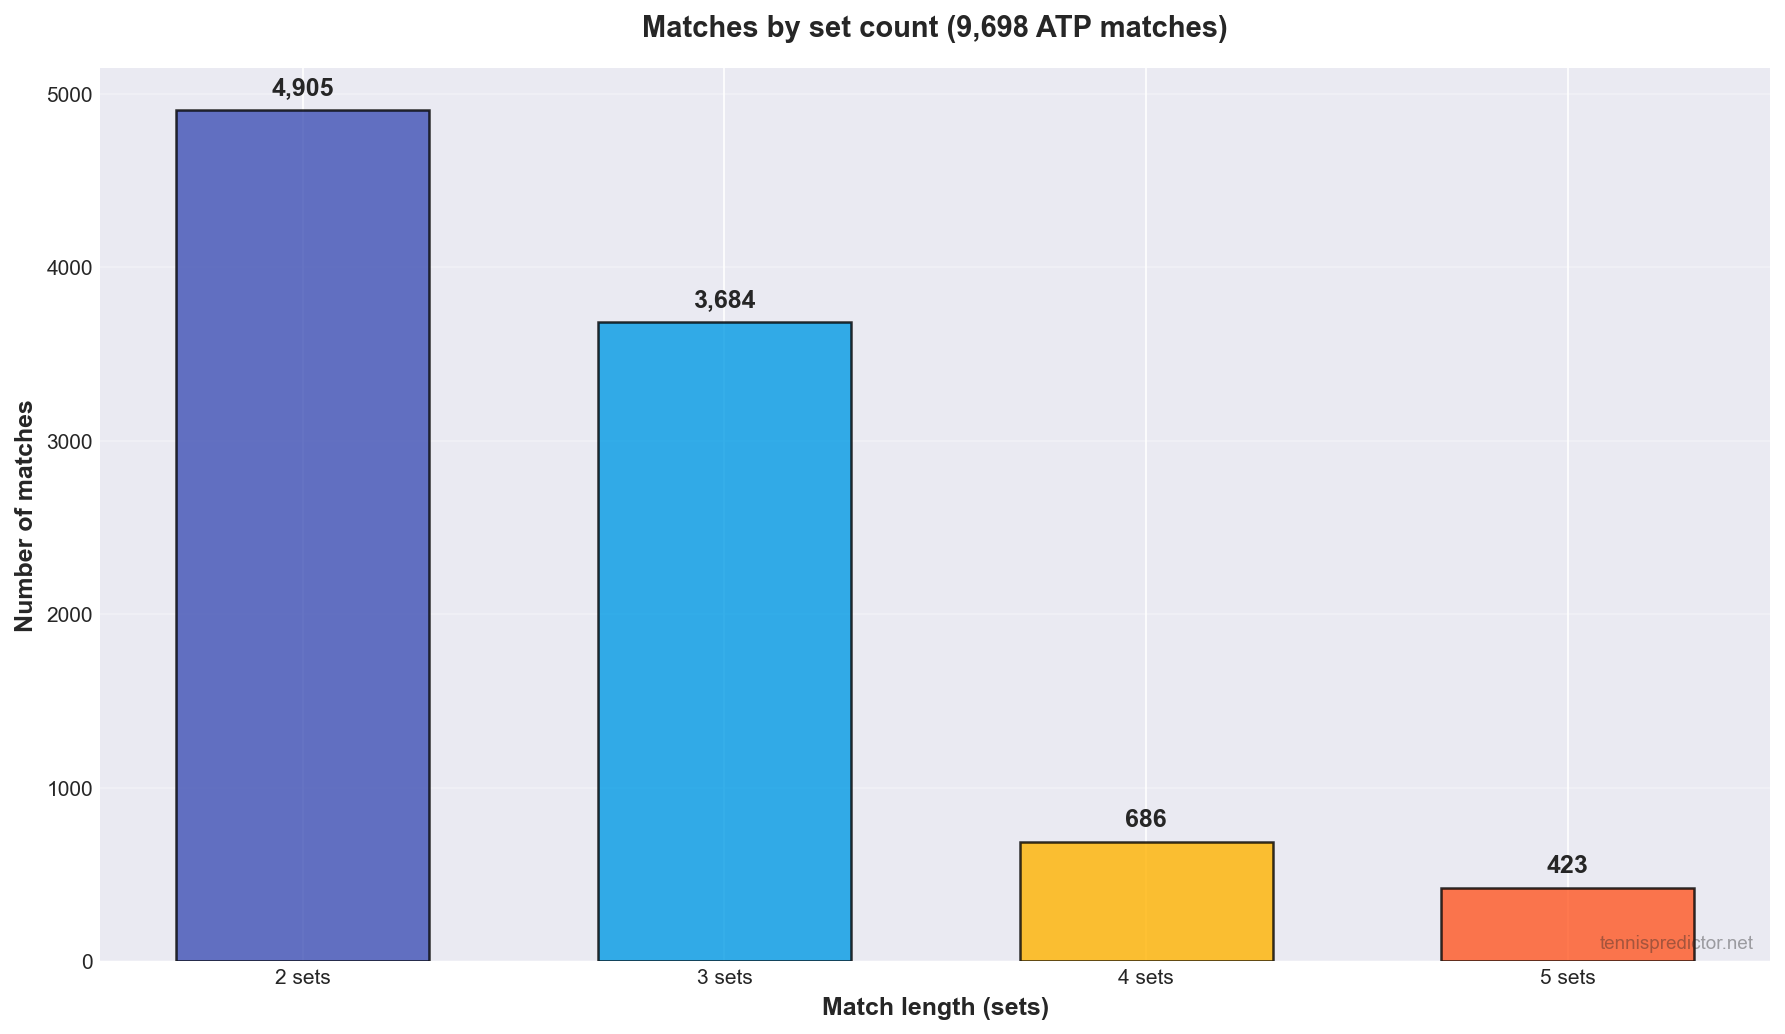
Figure 2: Distribution of total sets played (2 / 3 / 4 / 5).
When it goes the distance, does the first-set winner still win?
Among the 4,107 deciding-set matches:
- First-set winner won the match: 2,341 (57.0%)
- First-set loser came back: 1,766 (43.0%)
So the player who drew first blood still loses the match more than two times in five in this slice—comebacks are common enough that price matters more than narrative.
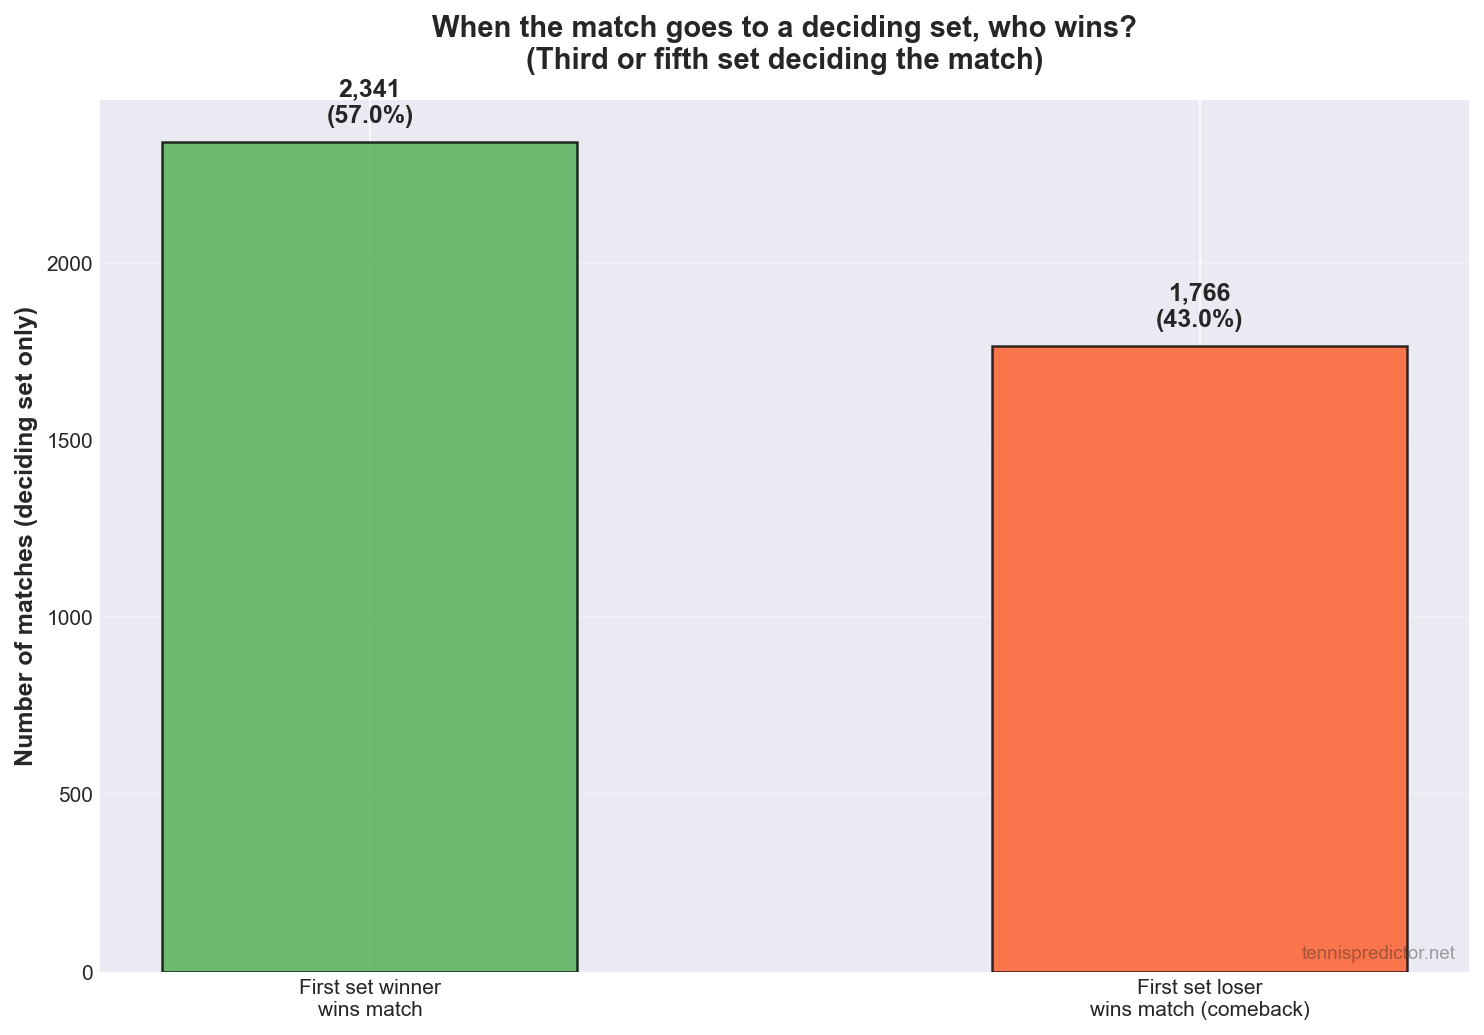
Figure 3: Outcomes conditional on the match having reached a deciding set.
That 57% lines up directionally with the broader “first set → match” correlation we discuss in First set wins: the most undervalued betting market?—but it is not the same number: here we condition on a third or fifth set existing, which selects for tighter matchups than the full population.
Grand Slam vs ATP Tour: longer matches, stronger first-set signal
We tag Grand Slam files by tournament name in the cache (Australian Open, Roland Garros, Wimbledon, US Open). Everything else is grouped as ATP Tour for this split.
| Split | Matches | % reaching deciding set | First-set winner wins if deciding |
|---|---|---|---|
| Grand Slam | 502 | 65.74% | 69.09% |
| ATP Tour | 9,196 | 41.07% | 55.94% |
Interpretation (carefully): majors produce more five-set epics by format, and—conditional on going long—the first-set winner converts at a higher rate than on the weekly tour. That is consistent with stronger favourites surviving best-of-five and with selection effects (who reaches week two at Slams).
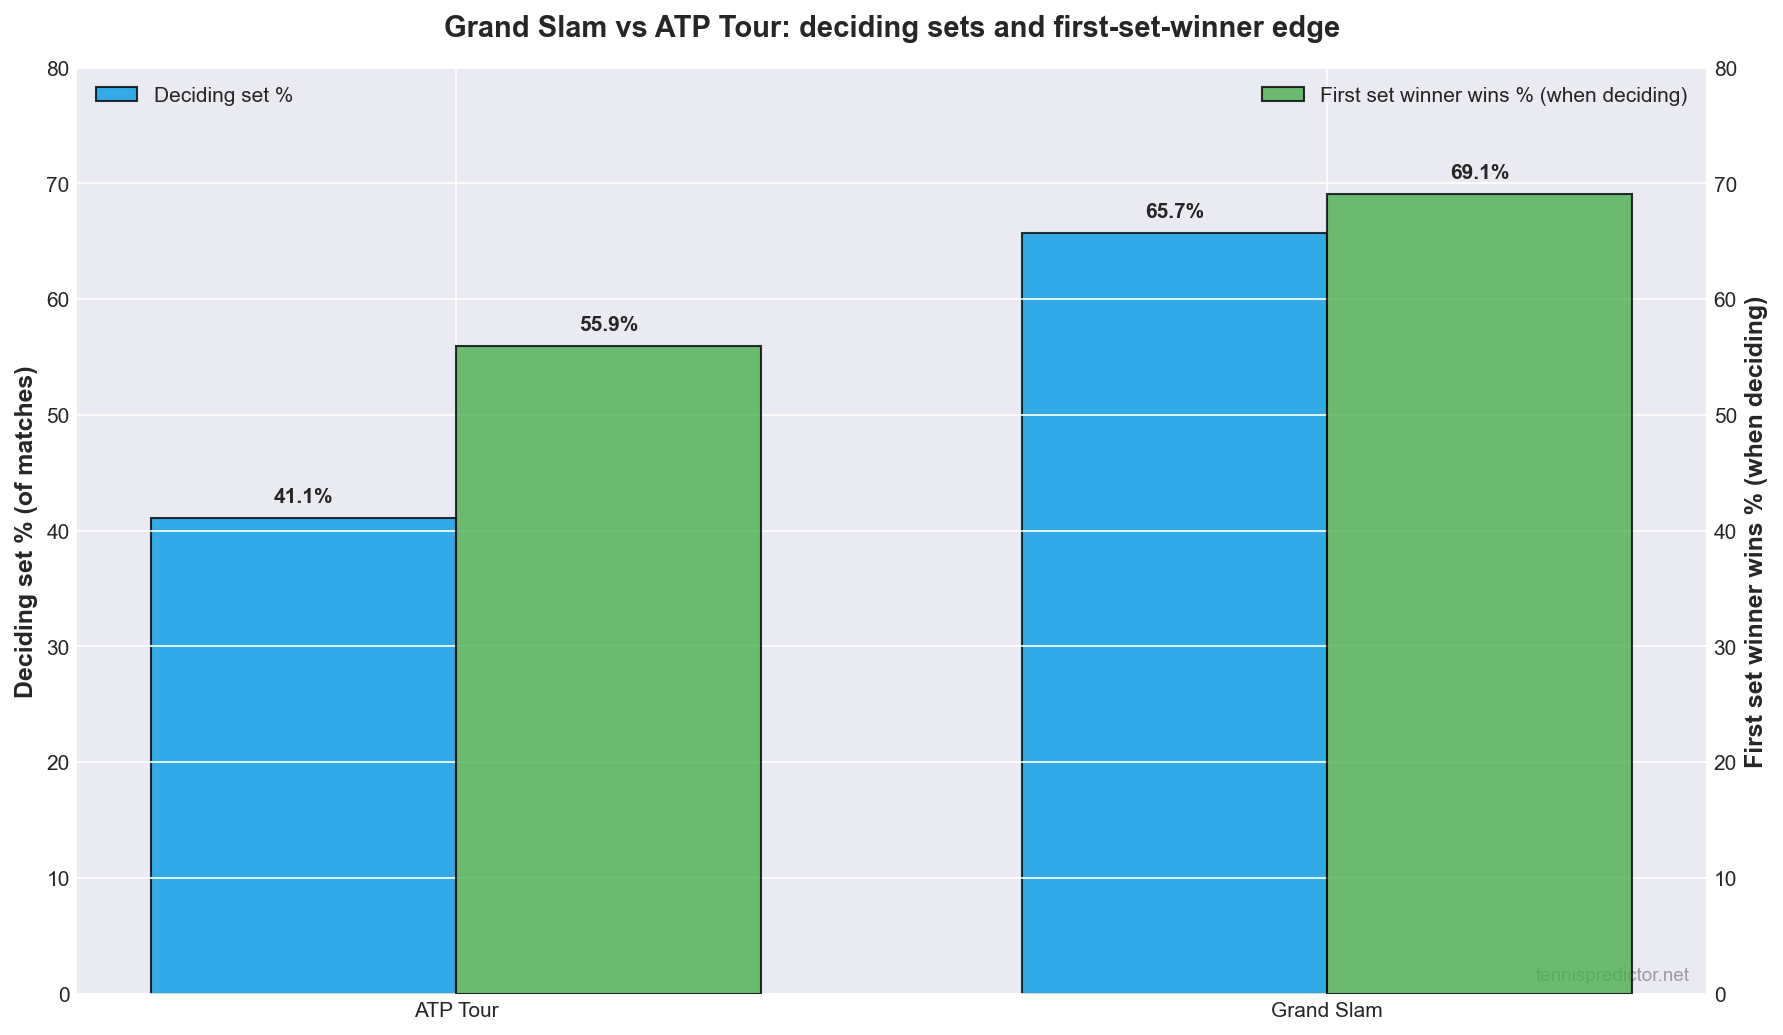
Figure 4: Deciding-set frequency and first-set conversion by tournament group.
For context on how majors differ from 250s and 500s in pricing and upset structure, pair this with our Grand Slam betting guide.
A note on sample sizes at majors
The 502 Grand Slam matches with clean scores here are enough for stable percentages at the aggregate level, but thin when you start slicing by round, player cluster, or surface. Treat 65.74% and 69.09% as directional priors—strong ones—rather than as something to paste into a pricing spreadsheet without uncertainty bands.
Year-by-year stability (2022–2025)
The overall 42.35% deciding-set rate is not a one-year fluke. Splitting by season:
| Year | Matches | Deciding-set rate | First-set winner wins (if deciding) |
|---|---|---|---|
| 2022 | 2,617 | 42.34% | 57.58% |
| 2023 | 2,191 | 42.72% | 57.59% |
| 2024 | 2,274 | 42.30% | 56.86% |
| 2025 | 2,616 | 42.09% | 56.04% |
Deciding-set incidence is almost flat; first-set conversion drifts slightly but stays in a 56–58% band. That is what you want to see if you are using these numbers as baseline priors rather than as a story about one volatile season.
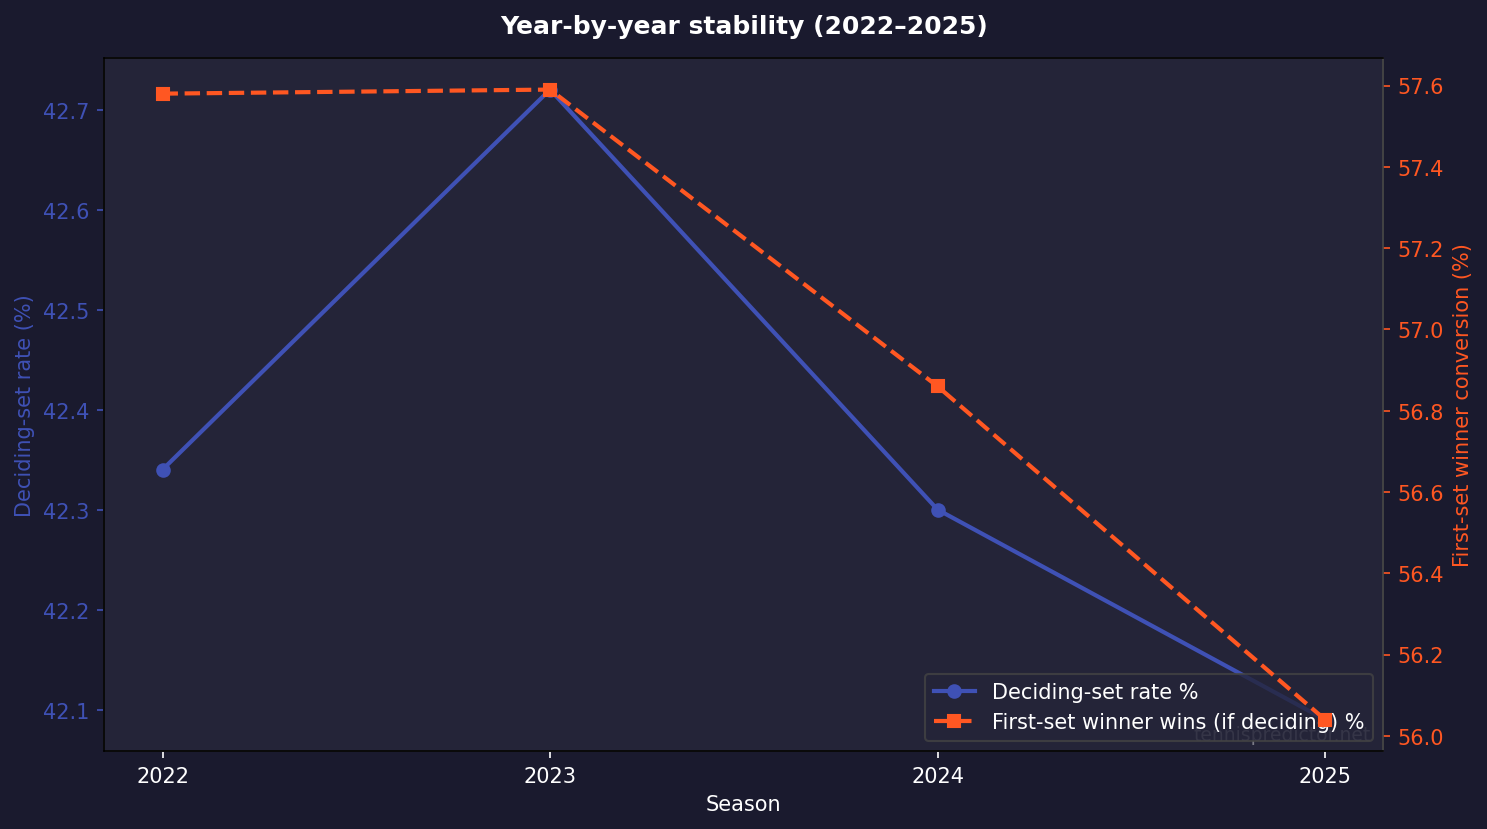
Figure 5: Seasonal stability of deciding-set rate and first-set conversion (conditional on deciding).
Why this matters for betting (without pretending tennis is easy)
1. Total sets and “over 2.5 sets”
A ~42% baseline for reaching a deciding set in this ATP population is a useful anchor when you compare books’ implied probabilities to your own model. If a matchup is priced like a blowout but both players are fit servers who trade holds, your three-set prior should move—not stay stuck on casual heuristics.
2. Live betting after set one
Conditional on the match eventually going long, the first-set winner is still not guaranteed anything—but the Grand Slam conditional (~69%) is materially higher than the tour conditional (~56%). That gap is where format and draw strength intersect; use it to sanity-check in-play prices rather than to chase steam blindly.
3. Fifth sets are rare but loud
423 matches in this sample ended in five sets (4.4% of all). They drive outsized attention and liquidity when they happen; your staking should still reflect base rates, not highlights-reel frequency.
4. Correlation is not a staking plan
These statistics describe historical frequencies. They do not know today’s injury report, surface speed, or whether a player is defending a tight schedule. Always compare any model probability to odds and bankroll rules—see our broader methodology in We analyzed 10,000 tennis matches: here's what we learned.
Translating a percentage into a fair price (toy example)
Suppose you believe today’s matchup is exchangeable with the ATP conditional rate—57% for the first-set winner in a match you expect to go deciding. The break-even decimal price for a 57% true chance is roughly 1 / 0.57 ≈ 1.75 before margin. If the live market offers 1.40, you do not have edge on that side even if “57%” sounds high in words. If it offers 2.10, you might—if your matchup really belongs in that population. The entire craft is in the if.
Where modellers and fans disagree most
Fans often overweight visible momentum (breaks of serve, body language). Modellers overweight clean historical rates without checking whether the match is drawn from the same support (surface, fatigue, indoor vs outdoor). Good betting sits in the middle: respect the baseline, then pay for specificity with data you trust.
A practical checklist before you bet “third set” or “five sets”
Pre-match:
- Check format. Best-of-three and best-of-five are not interchangeable priors—our tables show materially different conditional rates between Grand Slam and ATP Tour buckets.
- Estimate volatility. High return quality + marginal separation in hold percentages often pushes matches toward longer scorelines even before you look at price.
- Compare to margin. Books embed margin differently across set markets; a “fair” model probability rarely equals a fair posted price.
In-play after set one:
- Re-read the conditional. The relevant historical anchor for “first-set winner wins” depends on whether you think this match is likely to require a decider. If you expect a blowout, conditioning on “deciding set happens” is the wrong thought experiment.
- Update fitness priors. Back-to-back three-setters, late-night finishes, and hot-court conditions shift late-set win probabilities—none of that is in a static 57% headline.
At majors when five sets are live:
- Remember base rate: five-setters are rare in the full sample even if they dominate memory. That rarity should discipline stake size when you chase narrative-heavy prices.
Fifth sets: visibility, liquidity, and variance
Fifth sets attract liquidity because they are dramatic—but they also concentrate variance. A single break at 4–4 in the fifth can erase an hour of apparent control. The 423 five-set matches in this dataset are a reminder that frequency is low even when impact feels enormous on screen.
If you trade tennis in play, treat fifth-set markets like high-beta instruments: small informational edges can matter, but execution (slippage, partial fills, suspension rules) often dominates hobbyist outcomes.
How coaches and analysts talk about the decider (and what still matters statistically)
Coaches often emphasise first-strike points and risk management in third sets—shrink unforced errors, force the opponent to generate pace. Those tactics are real; our article does not replace them. What we add is simpler: aggregate win frequencies for bettors who want to align stories with historical base rates.
When a player’s team talks about “embracing the moment,” check whether that player’s service games historically hold under pressure in deciders. When a rival talks about “fresh legs,” check schedule. The data layer and the tactical layer are complements, not substitutes.
Scheduling, fatigue, and what a static percentage cannot see
Historical frequencies never include a column for “minutes played yesterday” or “flights crossed this week.” Yet those variables often determine who still has first-step defence in the twelfth game of the third set. This is why the same 57% headline can be simultaneously:
- a useful baseline for thinking about population behaviour, and
- misleading if you treat it as a personalised forecast for a specific player on short rest.
A sensible workflow is to treat the tables here as Phase A—population structure—and then run Phase B checks: recent workload, injury timeouts, and whether the opponent’s game pattern punishes tired legs (long rallies vs short points). None of that replaces the baseline; it conditions it.
This is also why we publish year-by-year stability: if first-set conversion in deciding sets swung wildly from 48% to 68% year over year without a rule change, you would worry about sample artefacts or data drift. Instead, the conditional rate moves inside a narrow band—good news for using the metric as a prior, bad news for anyone hoping for a universal constant to free them from thinking.
Limitations (read once, save regret later)
Surface-specific splits: our tournament cache does not reliably attach a normalised surface field on every match row, so we do not publish clay vs hard vs grass splits inside this article. For surface-conditional set dynamics, use articles that join scores to surface from the training pipeline (for example clay-focused guides on the blog index).
WTA: this cut is ATP only, because the underlying cache slice here is built for men’s draw scores in the same extraction pass.
Walkovers / retirements: scores must parse cleanly; messy or abbreviated lines are excluded, which slightly shifts denominators versus raw “all rows” counts.
Headline rates visual summary
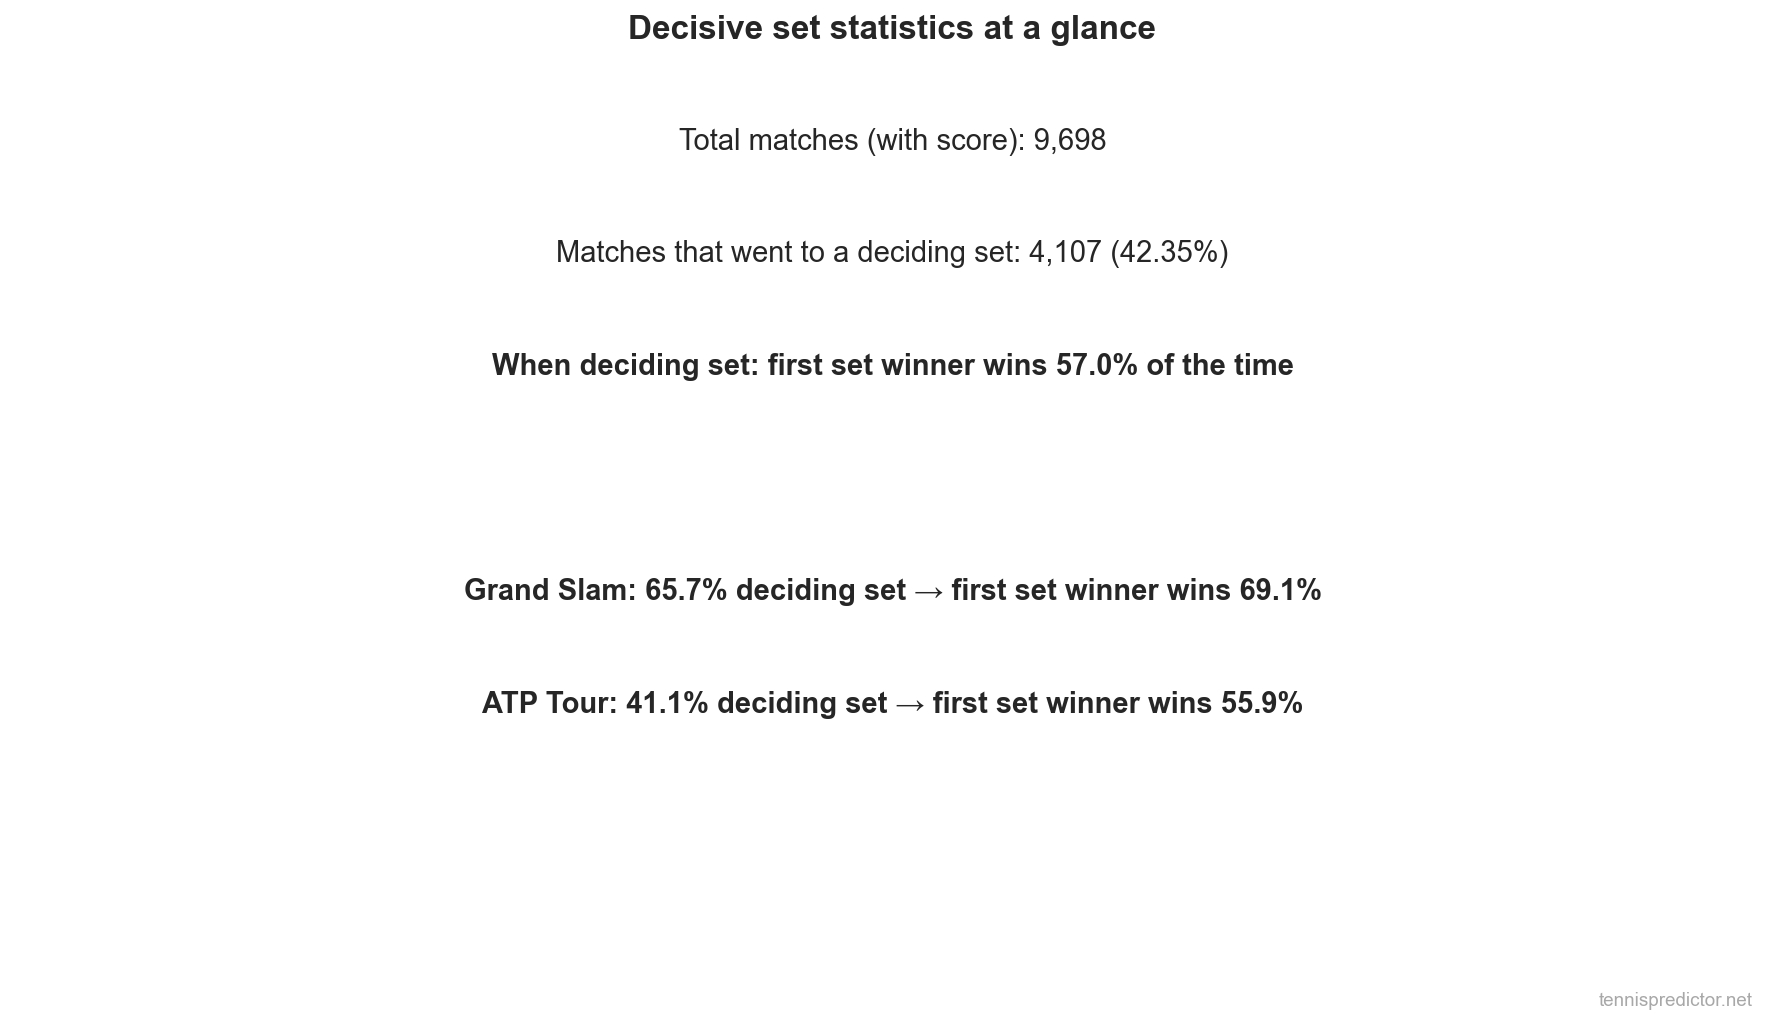
Figure 6: Core percentages summarised (same numbers as the opening table).
Frequently asked questions
1. Does “57%” mean the first-set winner is a lock in the third set?
No. 57% is the match outcome among deciding-set matches, not a point-level or game-level guarantee inside set three or five.
2. Why is the Grand Slam first-set number so much higher than the tour number?
Best-of-five creates more long matches and a different player mix late in events. The conditional probability mixes format, fitness, and selection—read it as contextual, not as a universal law.
3. How should I use this for “over 2.5 sets” markets?
Treat ~42% as a population prior for ATP matches with reliable scores, then adjust for matchup volatility (serve profile, recent three-set rate, scheduling).
4. Is the first-set winner more valuable live at Slams?
On average in this sample, yes—~69% conversion conditional on a deciding set vs ~56% on the tour. Always compare to the price you can actually bet.
5. Do five-set matches happen often enough to build a strategy around?
They are ~4.4% of all matches here—high variance for a standalone rule. Use fifth-set stats as context, not as a system by themselves.
6. Why don’t you show clay vs hard numbers here?
The extraction for this article prioritises complete scorelines from the tournament cache; surface is not consistently keyed on those rows. We avoid half-baked surface tables.
7. Are retirements included?
Only matches where every set score line parsed enter the denominators. Abrupt retirements sometimes leave partial scores; those rows are dropped rather than guessed.
8. Where can I see today’s matches and model outputs?
Use the live predictions dashboard—pre-match probabilities are updated there with the same statistical discipline we apply to blog research.
9. Can I use the 42% deciding-set rate as my “over 2.5 sets” probability?
Only as a starting prior for ATP matches that resemble this sample. Adjust up when both players have high tiebreak rates or low hold percentages on the surface; adjust down when a heavy favourite is priced for a quick kill.
10. Does a high deciding-set rate imply high total games?
Not automatically. A three-set match can still be short if one set is 6–1 and the decider is 6–4. Use set-level models or game-distribution work for totals—this article is about whether a decider happens and who tends to win once it does.
11. How does this relate to tiebreak statistics?
Tiebreaks and deciding sets overlap in storytelling but not in definition. Many matches reach a third set without a tiebreak in the first two sets. For tiebreak-specific rates, see our tiebreak analysis on the blog index.
12. Can juniors or Challenger data change these rates?
This article is ATP main-draw style matches from the tournament cache we indexed. Feeding Challenger or junior results into the same pipeline would likely shift deciding-set frequencies because serve dominance and hold patterns differ. Do not import these ATP priors into smaller-tour markets without a separate validation pass.
Data transparency
Statistics are produced by the same tournament-cache extraction we use internally for blog QA; charts were regenerated from that export in April 2026 so figures match the tables (dark theme, watermark). If you are reproducing this analysis externally, replicate the score parsing rules first—small differences in retirement handling will change denominators by a few tenths of a percent.
Common misconceptions (quick corrections)
Misconception 1 — “Most matches are straight sets, so deciding sets don’t matter.”
Straight sets are indeed the mode, but 42% deciding-set incidence means long matches are common enough to shape season-long P&L for anyone trading set markets frequently.
Misconception 2 — “The first-set winner always closes.”
43% comebacks among deciding-set matches is not “noise”—it is a large enough share to punish blind favouritism at short prices.
Misconception 3 — “Grand Slam numbers apply to Tuesday’s 250.”
The Grand Slam split mixes format and field strength. Exporting 69% to a Wednesday afternoon 250 is a category error.
Misconception 4 — “Five-set data is enough to build a staking system.”
At ~4.4% of matches, five-set samples are sparse for granular micro-strategies unless you pool years—and pooling years hides rule changes and ball changes.
Misconception 5 — “A high deciding-set rate implies a high over on games.”
Length in sets does not map one-to-one to game totals; blowout sets and tight sets can coexist.
Related reading
These companion pieces use overlapping data pipelines but answer different questions: first-set market pricing (undervalued signal), major-tournament structure (format and draw effects), and broad dataset lessons from multi-year ATP samples. Read them when you want to connect set-level intuition to odds, bankroll, and model behaviour—not when you need a single magic percentage for tonight’s match. Together, they help you avoid the trap of treating one stylised fact as a universal rule across surfaces, formats, and opponent quality.
See today's match predictions with confidence scores and value signals.
View Live Predictionsarrow_forwardRelated Articles
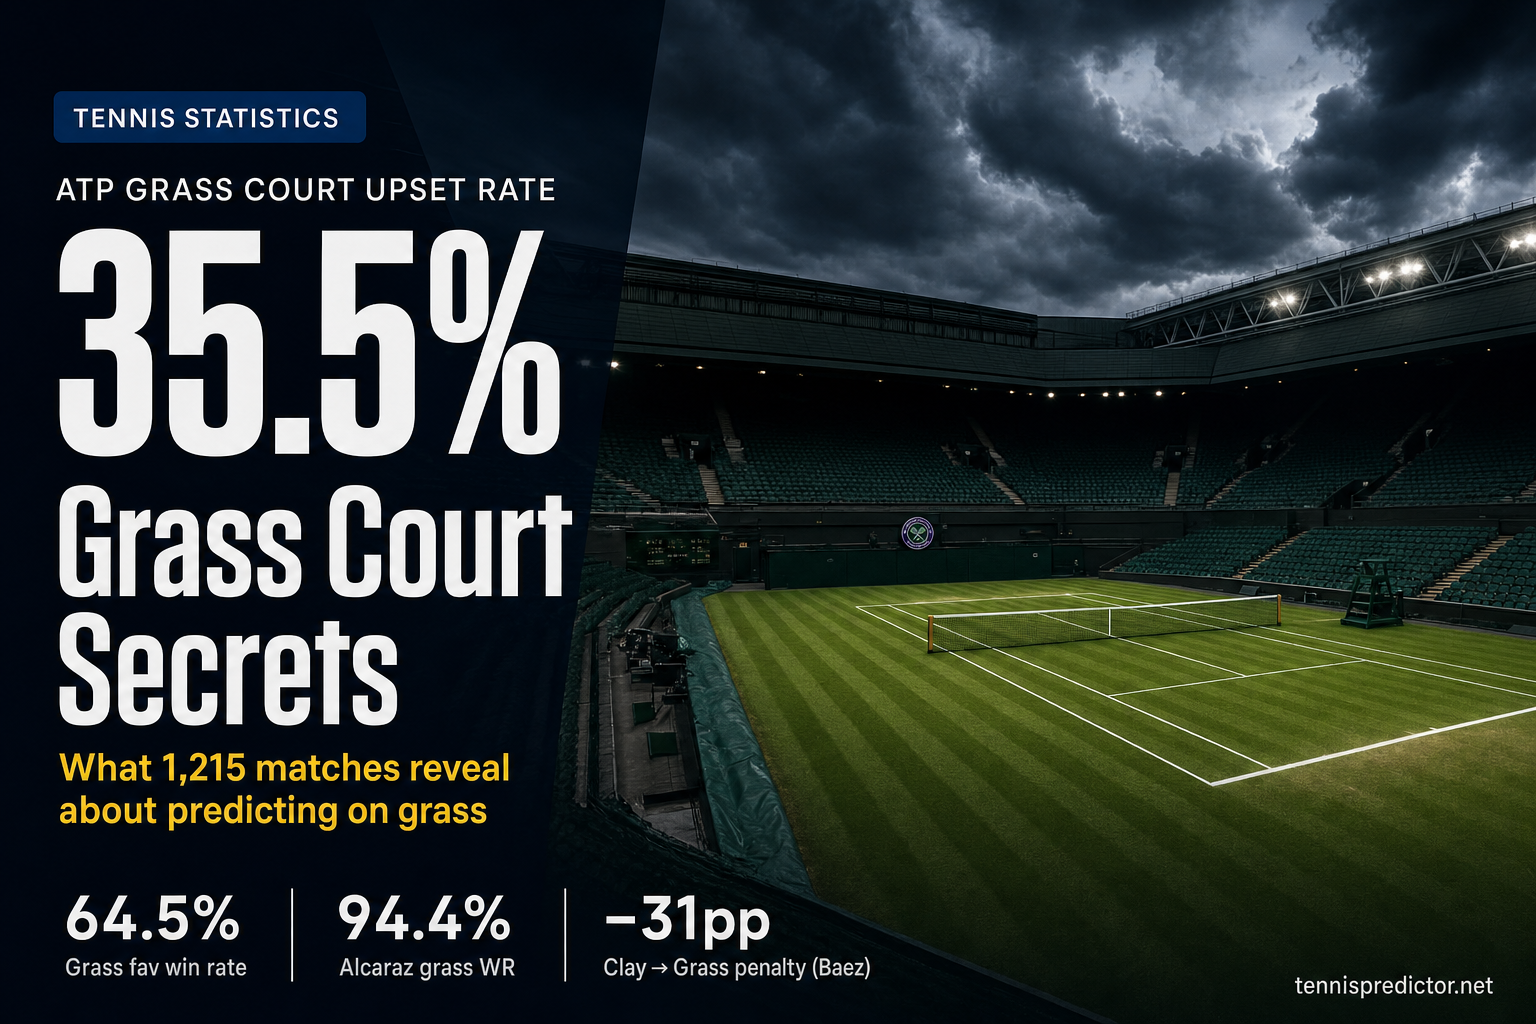
ATP grass court specificity: what 1,215 matches really tell us
Everyone repeats the same myths about grass — that it's random, that serve specialists always win, that clay court form means nothing. Our model disagrees. We dug into 1,215 ATP grass matches from 2022 to 2025 to separate the folklore from the numbers.

We analyzed 10,000 tennis matches: here's what we learned
Large-sample ATP study: what the Random Forest actually weights (odds, ranks, surface), how often lower-ranked players win by tier, and why H2H is thin at scale.

When the favorite wins the first set: match close-out rates by surface and odds
When a pre-match favourite wins the first set, they close out the match 80.7% of the time — a 12-point boost over their baseline. But that number swings from 66% to 94% depending on their odds and the surface. Here's the full data-backed breakdown across 4,650 ATP matches.

Felix Auger-Aliassime: the indoor titan with a volatility problem
FAA went 72.2% in 2022, crashed to 27.3% in 2023, recovered to 65.7% in 2025. His indoor win rate of 77.8% and Final win rate of 85.7% (6/7) make him a strong late-tournament bet in specific scenarios — but the volatility demands careful analysis.