When breaks happen: ATP set patterns from 2,798 charted matches
Published: July 15, 2026
Reading time: 18 minutes
Category: Tennis statistics & probability
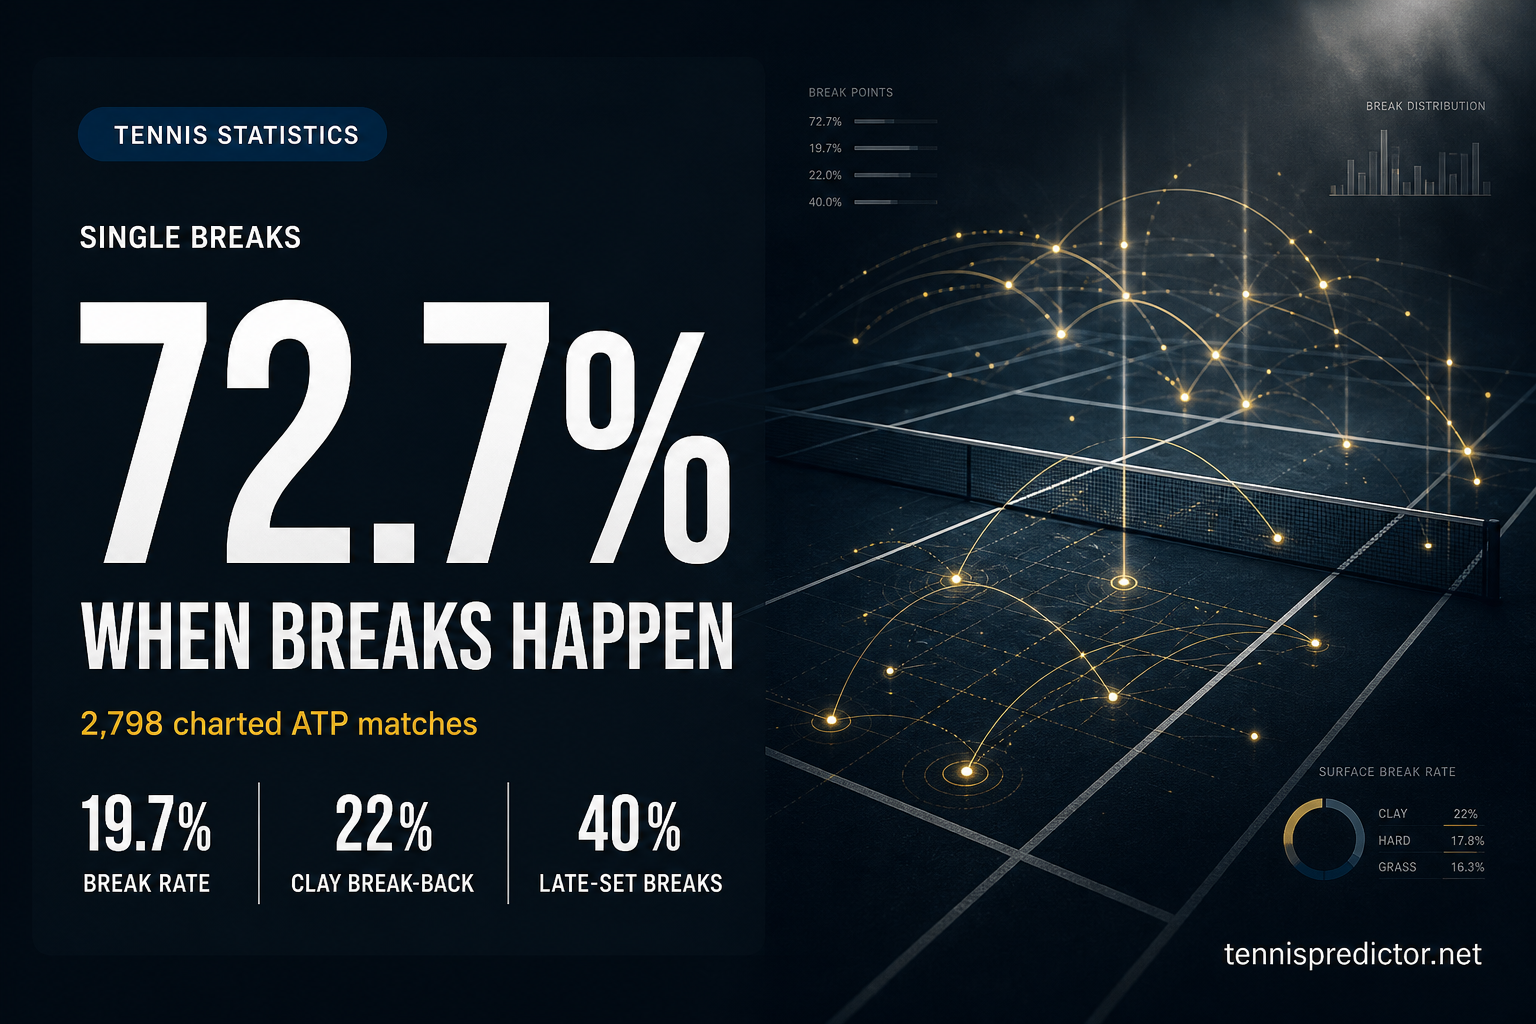
A break of serve feels like a turning point — and in live markets it often is. But the aggregate picture is more nuanced than the highlight reel suggests. Across 2,798 charted ATP matches from January 2022 through May 2026, we detected 70,223 service games and 13,832 breaks — a 19.7% break rate. Roughly three in four of those breaks stand alone: they are not followed immediately by another break on the next game. At the same time, breaks are not evenly scattered through a set. 40.5% land in the final third of games, and clay courts produce both more breaks and more immediate break-backs than grass.
This article maps that terrain: where breaks occur within sets, how often they come in streaks, what happens on the very next game, and how set-one break profiles differ on clay, hard, and grass. The data comes from the Tennis Abstract Match Charting Project — crowdsourced, point-by-point charted men's matches — not from our machine-learning training set. If you trade live tennis or want a sharper read on first-set dynamics, these frequencies are a useful calibration layer alongside our first-set close-out analysis and live prediction dashboard.
The dataset: charted points, not scorelines alone
Source and scope
All figures in this article come from the Tennis Abstract Match Charting Project, a volunteer-driven database of shot-by-shot and point-by-point men's match records. We filtered to matches with Date >= 20220101, yielding 2,798 processed matches with full point sequences available. Surface split for set-one analysis:
| Surface | Set 1 samples |
|---|---|
| Clay | 766 |
| Hard | 1,763 |
| Grass | 266 |
| Total | 2,795 |
The sample is smaller than the full ATP calendar — charting is labour-intensive — but each match carries far richer detail than a final scoreline. That depth is what lets us locate breaks by game number within a set, measure consecutive break streaks, and study immediate break-backs game by game.
How we define a break
A break occurs when the returner wins a completed service game. In the charting data, that means the game-ending point has PtWinner != Svr (the point winner is not the server). We reconstruct games by detecting increments in the Gm# field within each set, then classify each game as hold or break.
Game position within a set uses game groups in pairs: games 1–3, 4–5, 6–7, 8–9, 10–11, and 12–13. We also bucket sets into thirds and quarters for aggregate timing analysis.
Attribution and limits
- Data: Tennis Abstract Match Charting Project, licensed CC BY-NC-SA 4.0.
- Scope: men's ATP charted matches only; WTA is not included.
- These are historical frequencies, not live predictions for tonight's card.
- Tiebreak games are included where they appear in the charted sequence; sensitivity checks excluding tiebreak-only games produce materially similar break rates.
The baseline: how often do breaks happen?
Before timing or streaks, the base rate matters. Across all detected games:
| Metric | Value |
|---|---|
| Games analysed | 70,223 |
| Break games | 13,832 |
| Break rate | 19.7% |
| Avg breaks per set | 1.86 |
| Avg games per set | 9.44 |
Roughly one in five service games ends in a break. That figure varies by surface — clay runs hotter at 2.20 average breaks per set versus 1.56 on grass — but the headline is consistent: holds dominate, and breaks are the exception that shapes set narratives.
Sets with at least one break account for 91.9% of all sets in the sample (6,833 of 7,436). Pure hold-fests exist, but they are rare. When you are watching a set with zero breaks through six games, you are already in a low-break tail of the distribution.
Where in the set do breaks land?
Game groups: opening games still lead, but the final third catches up
Across all sets and surfaces, breaks distribute by game group as follows:
| Game group | % of breaks |
|---|---|
| 1–3 (opening) | 32.3% |
| 4–5 | 22.3% |
| 6–7 | 20.2% |
| 8–9 | 13.8% |
| 10–11 | 6.6% |
| 12–13 | 4.9% |
The opening trio of games still accounts for the single largest share — nearly a third of all breaks happen before game four. That surprises many viewers who assume breaks cluster exclusively in pressure moments late in sets.
But the late-set story is real too. Bucketing by set thirds:
| Set third | % of breaks |
|---|---|
| First third | 28.6% |
| Middle third | 31.0% |
| Final third | 40.5% |
Two in five breaks occur in the final third of a set. The distribution is front-loaded at the game-group level (because early sets have fewer total games), but conditional on where you are in a set's arc, pressure accumulates toward the end.
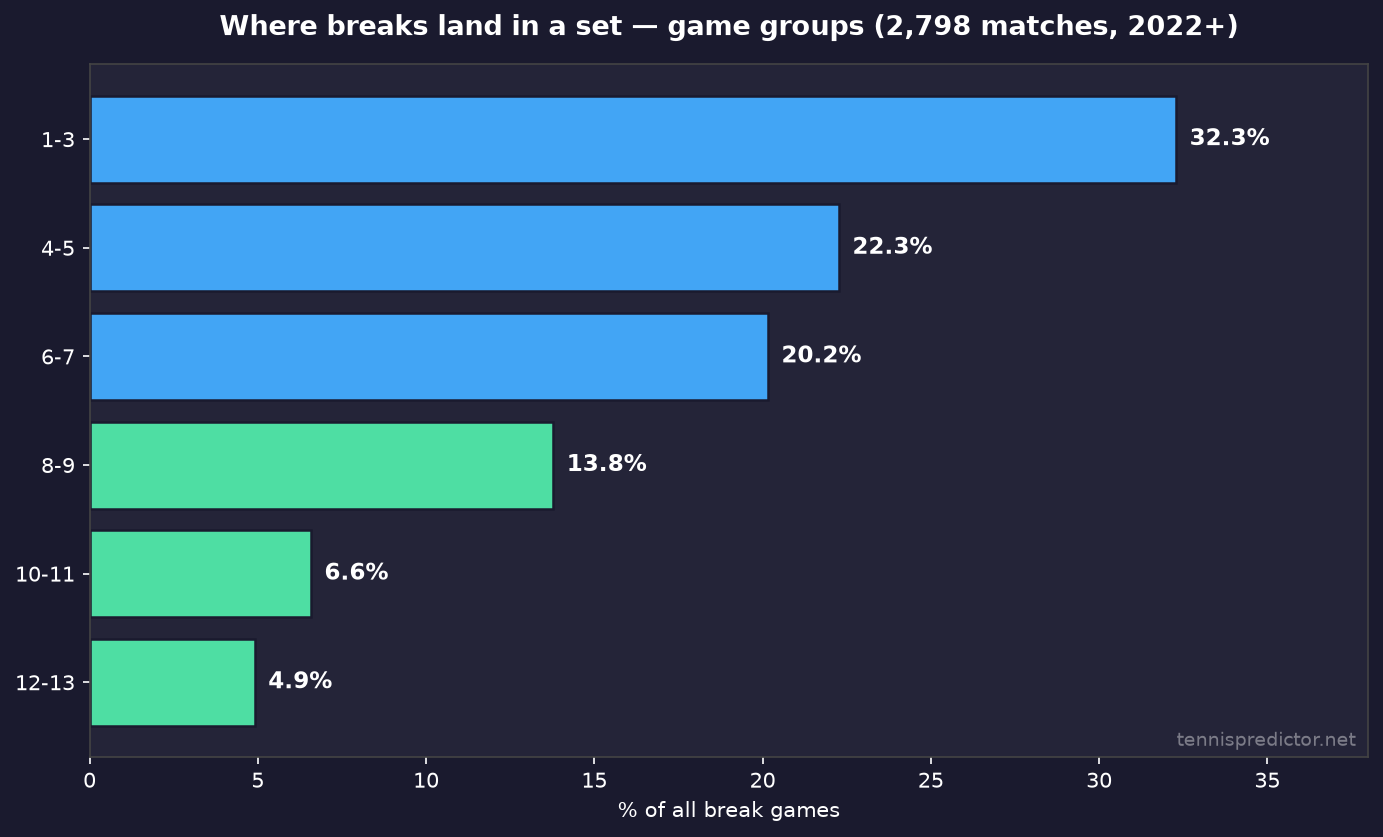
Figure 1: Share of all break games by game-group position (2022+ charted matches).
Surface differences
Clay front-loads slightly more into games 1–3 (33.3% of clay breaks) while grass spreads more into games 8–13 combined (33.0% on grass versus 25.3% on hard). Grass sets also average 9.84 games per set — longer than clay's 9.20 — which mechanically creates more late-game opportunities.
For set-one specifically, hard courts place 15.4% of breaks in games 8–9 versus grass at 18.0% — a meaningful spread if you are reasoning about when a first-set break is likely to arrive. See Figure 5 in the set-one section below.
Break categories: singles dominate, streaks are rare
Not all breaks are equal in narrative terms. A single break that gets consolidated is a different live-market signal from two or three consecutive breaks — a "break-fest" sequence that can flip momentum pricing instantly.
All breaks by streak category
| Category | Breaks | % of breaks |
|---|---|---|
| Single (isolated) | 10,057 | 72.7% |
| 2 in a row | 2,554 | 18.5% |
| 3 in a row | 885 | 6.4% |
| 4+ in a row | 336 | 2.4% |
Nearly three in four breaks are singles — a break not immediately followed by another break on the next game. Consecutive-break sets are uncommon too: only 20.2% of sets contain at least one pair of back-to-back breaks.
By surface
| Surface | Single breaks | 2 in a row | 3 in a row | 4+ |
|---|---|---|---|---|
| Clay | 66.7% | 20.9% | 9.0% | 3.4% |
| Hard | 75.0% | 17.8% | 5.1% | 2.1% |
| Grass | 79.2% | 14.2% | 5.5% | 1.1% |
Clay is the streakiest surface: only 66.7% of clay breaks are isolated singles, versus 79.2% on grass. That aligns with the higher break rate and more trading of serve on clay — themes we also explore in our clay court betting guide.
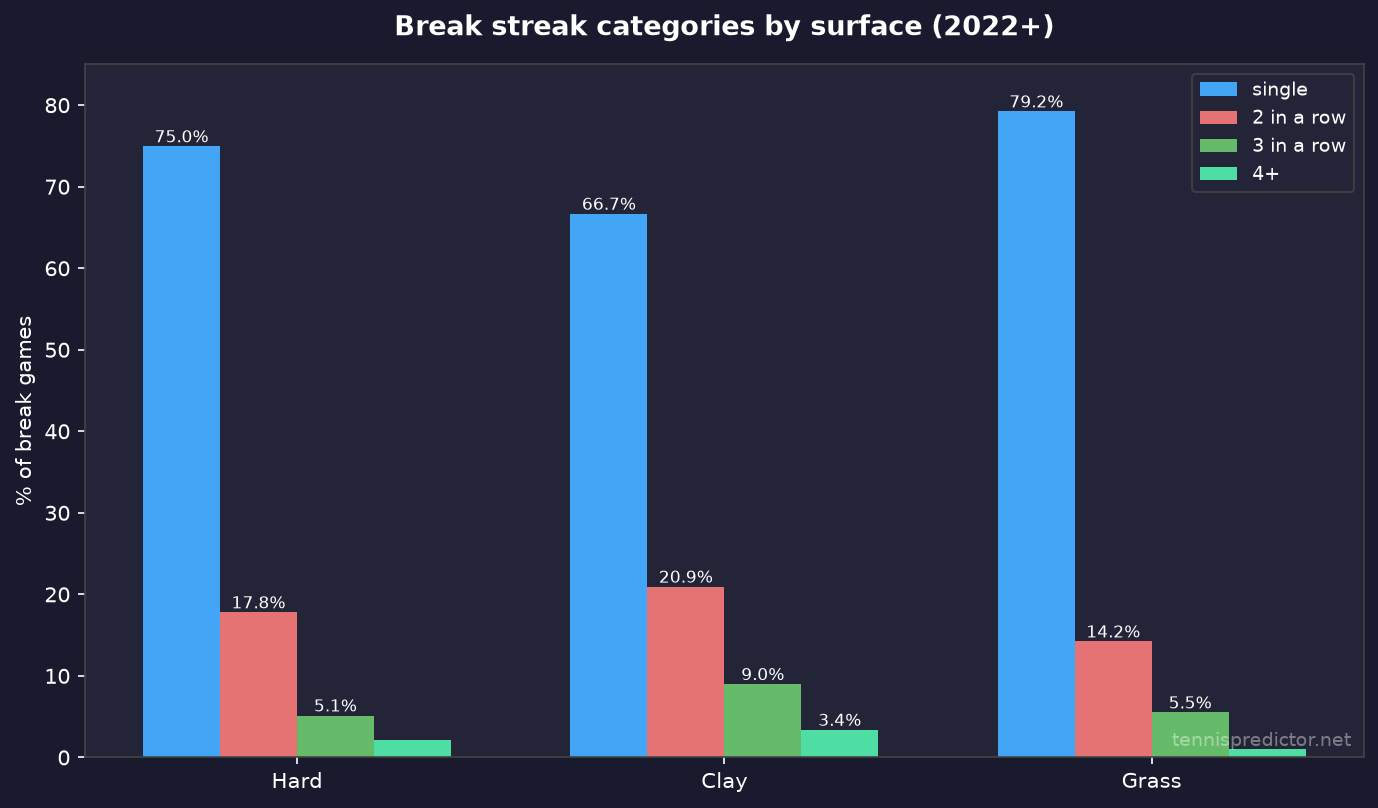
Figure 2: Break streak categories as a share of all break games, split by surface.
Consecutive breaks within sets
| Slice | Sets with consecutive breaks |
|---|---|
| All sets | 20.2% |
| Clay | 27.8% |
| Hard | 18.1% |
| Grass | 13.4% |
| Set 1 only | 20.5% |
More than a quarter of clay sets feature at least one consecutive-break pair. On grass, that drops to one in eight. If you are watching a grass match and see two breaks in a row, you are already in an unusual sequence for the surface.
Break vs break-back: what happens on the next game?
The immediate aftermath of a break is where live markets often over- or under-react. We tracked the next game's outcome after every break across all sets.
Immediate next-game result
| Surface | Break-back | Breaker holds |
|---|---|---|
| All | 18.3% | 81.7% |
| Clay | 22.2% | 77.8% |
| Hard | 16.7% | 83.3% |
| Grass | 14.1% | 85.9% |
After a break, the player who just broke holds serve on the very next game roughly four times in five. Immediate break-backs are the exception, not the norm.
Clay is the trading surface: 22.2% immediate break-back versus 14.1% on grass — an eight-point gap. That single comparison explains a lot of live-market behaviour on European clay: one break does not settle the set narrative the way it often does on grass.
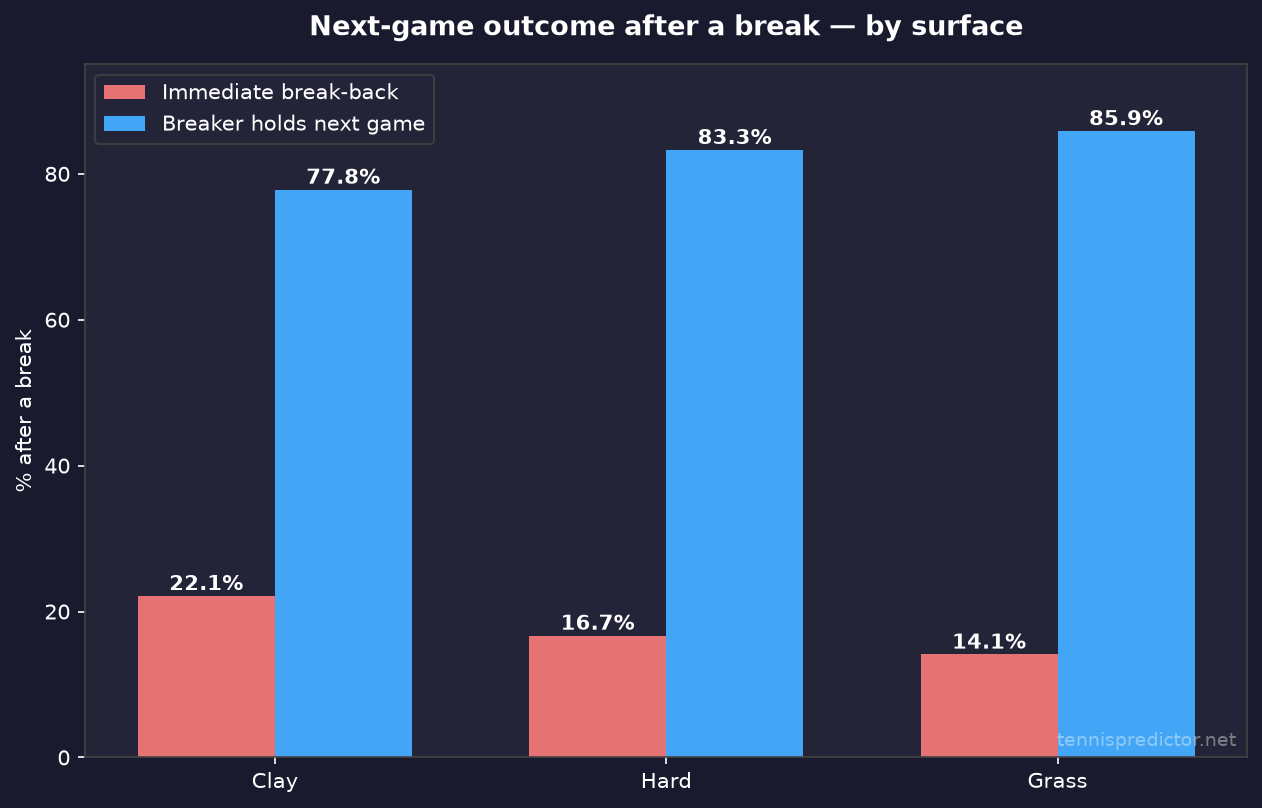
Figure 3: Next-game outcome after a break — immediate break-back versus consolidation.
Eventual break-back in the same set
If you widen the window beyond the next game, break-backs become more common. Across all surfaces, 30.8% of broken players break back at some later point in the same set (not necessarily immediately). On clay, that rises to 36.3%.
How to read this: immediate break-back is rare; eventual break-back in the set is materially more likely, especially on clay. Live prices that treat a single early break as terminal on clay are often misaligned with this data.
Set 1 deep dive: winners, losers, and unbreaks
Set one carries outsized weight in match betting — a topic we covered in depth in our favourite first-set close-out rates piece. Here we zoom into the break mechanics underneath those close-out numbers: who breaks, how often, and whether the loser can claw back.
Set-1 winner profile
| Surface | Avg winner breaks | Avg loser breaks | Won without breaking | Winner broke more |
|---|---|---|---|---|
| Clay | 1.81 | 0.50 | 3.7% | 91.0% |
| Hard | 1.50 | 0.32 | 7.2% | 87.0% |
| Grass | 1.33 | 0.23 | 8.7% | 86.8% |
The set-one winner breaks more than the loser in the vast majority of cases — 87–91% depending on surface. Winning set one without breaking at all is rare: 3.7% on clay, 8.7% on grass.
Winner break-count distribution (set 1)
| Breaks by winner | Clay | Hard | Grass |
|---|---|---|---|
| 0 (held throughout) | 3.7% | 7.2% | 8.7% |
| 1 break | 34.2% | 46.5% | 53.4% |
| 2 breaks | 41.9% | 36.5% | 34.6% |
| 3+ breaks | 20.2% | 9.8% | 3.4% |
On clay, 42% of set-one winners collect a double break (two or more breaks while winning the set). A single break is enough on hard and grass more often — 46–53% of set-one winners break exactly once on those surfaces.
Set-1 loser profile: getting broken vs breaking back
The loser's side tells a different story. Because the loser dropped the set, they were broken more often than they broke — but the unbreak dynamics matter for live trading.
When the set-1 winner got broken
| Surface | Winner got broken | Immediate unbreak | Eventual unbreak in set 1 |
|---|---|---|---|
| Clay | 40.1% | 49.2% of those | 88.0% of those |
| Hard | 27.5% | 44.3% of those | 85.4% of those |
| Grass | 21.4% | 47.4% of those | 87.7% of those |
Even set-one winners get broken frequently on clay — 40% of the time. When that happens, they break back immediately roughly half the time. Eventual unbreak in set one is very common among winners who were broken at all.
When the set-1 loser got broken
| Surface | Loser got broken | Immediate unbreak | Eventual unbreak in set 1 |
|---|---|---|---|
| Clay | 96.3% | 19.8% of those | 29.1% of those |
| Hard | 92.8% | 10.3% of those | 19.5% of those |
| Grass | 91.4% | 7.0% of those | 12.8% of those |
Almost every set-one loser was broken at least once — which is logically consistent with losing a break-oriented set. The critical distinction is immediate unbreak: on clay, 19.8% of broken losers strike back on the very next game; on grass, only 7.0% do.
Loser break-count distribution (set 1)
| Breaks by loser | Clay | Hard | Grass |
|---|---|---|---|
| 0 breaks | 59.9% | 72.5% | 78.6% |
| 1 break | 31.7% | 23.4% | 19.6% |
| 2+ breaks | 8.4% | 4.1% | 1.9% |
Most set-one losers record zero breaks — they lost a set where they never converted a return game. The 31.7% on clay who manage exactly one break but still lose the set are the "trade set" outcomes: competitive on returns, not enough to flip the scoreline.
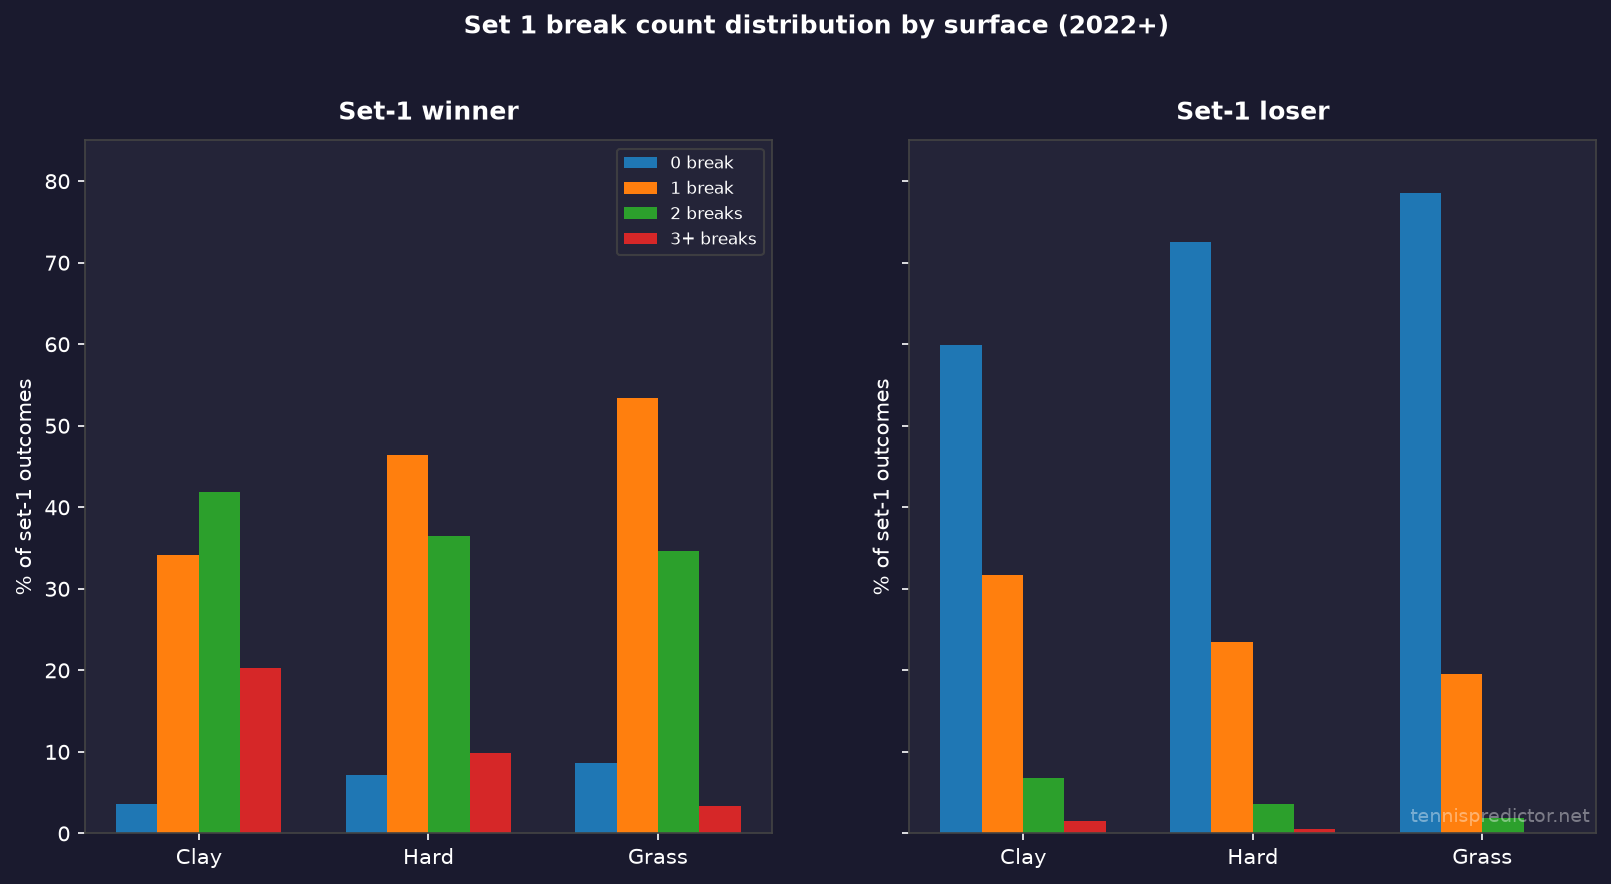
Figure 4: Distribution of break counts for set-one winners (left) and losers (right), by surface.
Loser scenarios that still end in a set-one loss
| Scenario | Clay | Hard | Grass |
|---|---|---|---|
| Loser broke first but lost set 1 | 15.4% | 11.3% | 10.2% |
| Equal breaks but loser lost | 9.0% | 13.0% | 13.2% |
| Loser broke more but lost | 0.0% | 0.0% | 0.0% |
Loser broke first but still lost set one happens in 10–15% of cases — more often on clay. Equal-break sets where the loser still drops the set occur in 9–13% of set-one outcomes. Nobody lost set one while breaking more than the winner in this sample — tiebreaks and game margins resolve the equal-break cases.
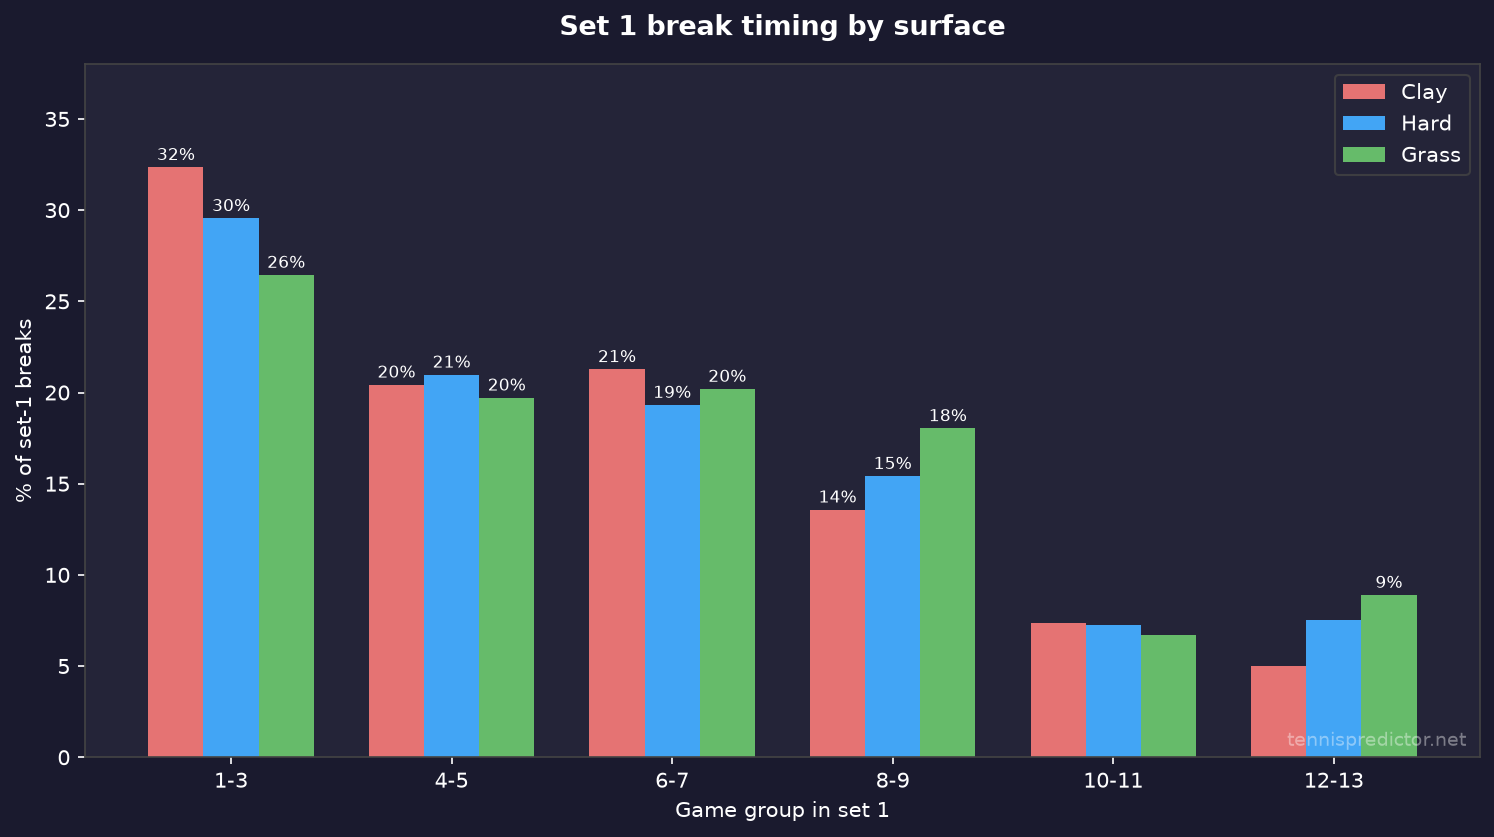
Figure 5: Where set-one breaks occur, by game group and surface.
Betting and live-market implications
These frequencies are not a betting system on their own. They are calibration anchors — reference points for whether a live price after a break looks aligned with historical base rates.
After a single break, expect consolidation. Roughly 82% of the time, the breaker holds the next game. Pricing the broken player as a near-coin-flip to break back immediately is usually too generous — except on clay, where 22% immediate break-back is meaningfully higher.
Do not overreact to consecutive breaks on grass. Only 13.4% of grass sets contain consecutive-break pairs. Two breaks in a row on grass is a low-base-rate event; markets sometimes treat it as a permanent momentum shift when the data says it is often noise.
Clay set-one winners average 1.8 breaks. A single break against the favourite in a clay set-one is not automatically decisive. Combine this with our first-set close-out data — where mild favourites still close out only 69.7% after winning set one — and you have a framework for why clay first sets stay tradeable longer.
Grass favours the server after a break. 85.9% next-game hold rate and 79.2% single-break share mean grass rewards the player who converts one break and consolidates. Our grass court specificity guide covers the broader serve-dominance context.
Decisive sets behave differently. Set-one patterns here do not automatically carry into third or fifth sets, where fatigue and pressure shift. Cross-reference our decisive set statistics for that layer.
For tonight's card, use the live prediction dashboard for match-specific model outputs — and use this article's frequencies to sanity-check whether the market is treating a break as more definitive than history suggests.
Frequently asked questions
What percentage of tennis games end in a break?
In our 2022+ charted ATP sample, 19.7% of service games end in a break — roughly one in five. The rate is higher on clay (~24% implied by 2.20 breaks per 9.2 games) and lower on grass.
Do breaks happen more in the opening games or late in a set?
Both matter. 32.3% of breaks occur in games 1–3 — the largest single game-group bucket. But 40.5% fall in the final third of the set. Early breaks are common; late-set pressure accumulates breaks toward the end.
How often do players break back immediately after losing serve?
18.3% across all surfaces. Clay is highest at 22.2%; grass lowest at 14.1%. The breaker holds the next game 81.7% of the time overall.
Does the set-one winner usually break more than the loser?
Yes. The set-one winner records more breaks than the loser in 87–91% of cases, depending on surface. On clay, set-one winners average 1.81 breaks versus 0.50 for the loser.
Can the set-one loser break back after getting broken?
Yes, but immediate unbreak rates are modest: 19.8% on clay, 10.3% on hard, 7.0% on grass (among losers who were broken at least once). Eventual unbreak later in set one is more common than immediate break-back.
Is this analysis ATP only?
Yes. All data comes from men's charted matches in the Tennis Abstract Match Charting Project. WTA patterns may differ and are not covered here.
Methodology summary
| Item | Detail |
|---|---|
| Data source | Tennis Abstract Match Charting Project (men's point files) |
| Date range | 2022-01-01 – 2026-05-21 |
| Matches | 2,798 processed |
| Break definition | Returner wins service game (PtWinner != Svr on game-ending point) |
| Licence | CC BY-NC-SA 4.0 — credit Tennis Abstract |
| Analysis script | Internal break-timing analysis on charted point data (private repo tooling) |
A full stat-by-stat verification log is maintained internally for editorial QA. Figures in this article are rounded to one decimal place for readability; exact values are available in the underlying aggregate tables.
Disclaimer: This article presents historical statistical frequencies for educational purposes. It is not betting advice. Past patterns do not guarantee future results.
See today's match predictions with confidence scores and value signals.
View Live Predictionsarrow_forwardRelated Articles
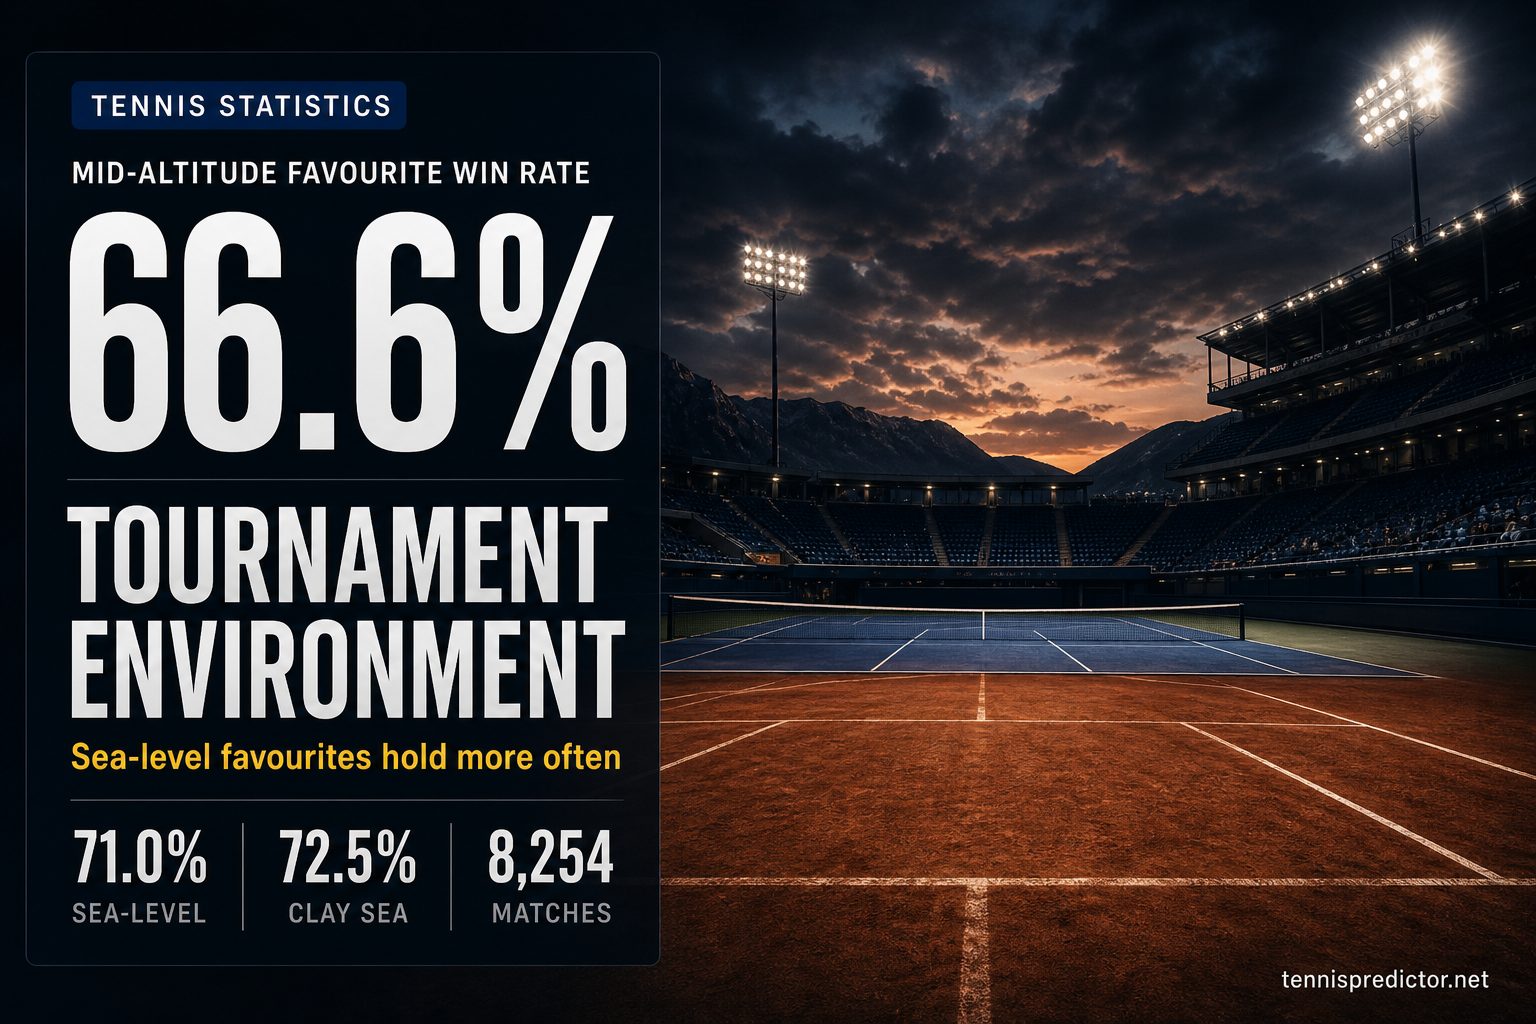
Does tournament environment change favourite win rates?
Altitude and typical venue climate are rarely priced as cleanly as surface. We joined 8,254 ATP matches with odds (2022–2025) to curated venue elevations and monthly temperature/humidity normals. Mid-altitude favourites win less often—especially on clay.
July 30, 2026 · 20 min read
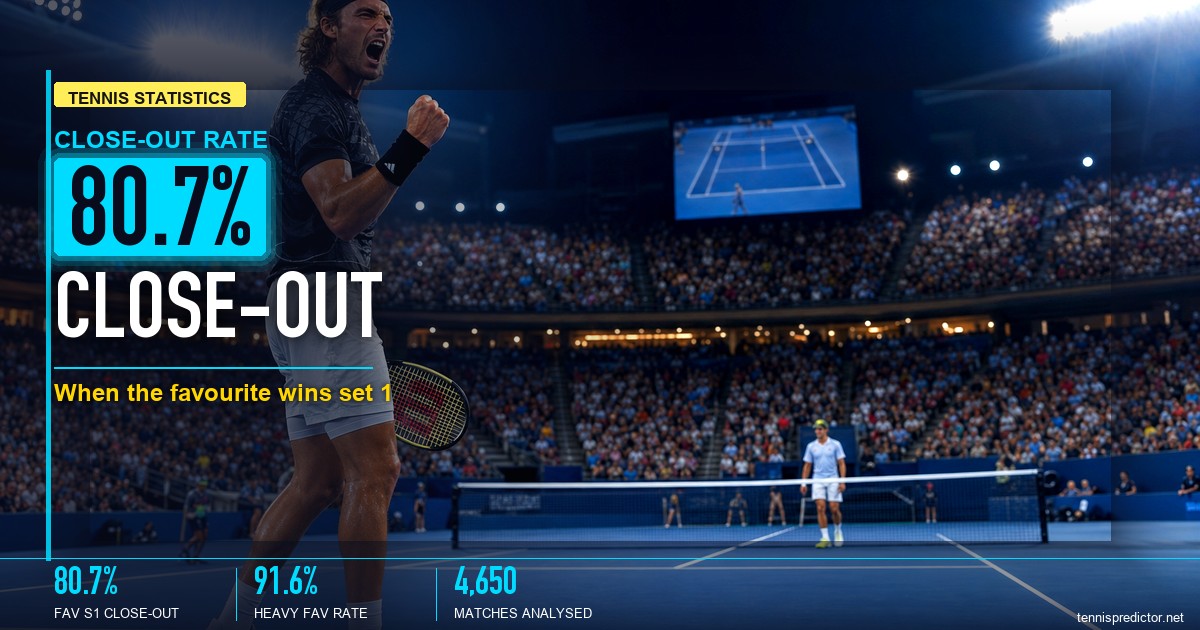
First set betting: close-out rates, carry-through, and market context
When a pre-match favourite wins the first set, they close out the match 80.7% of the time — a 12-point boost over their baseline. But that number swings from 66% to 94% depending on their odds and the surface. Here's the full data-backed breakdown across 4,650 ATP matches.
May 11, 2026 · 29 min read
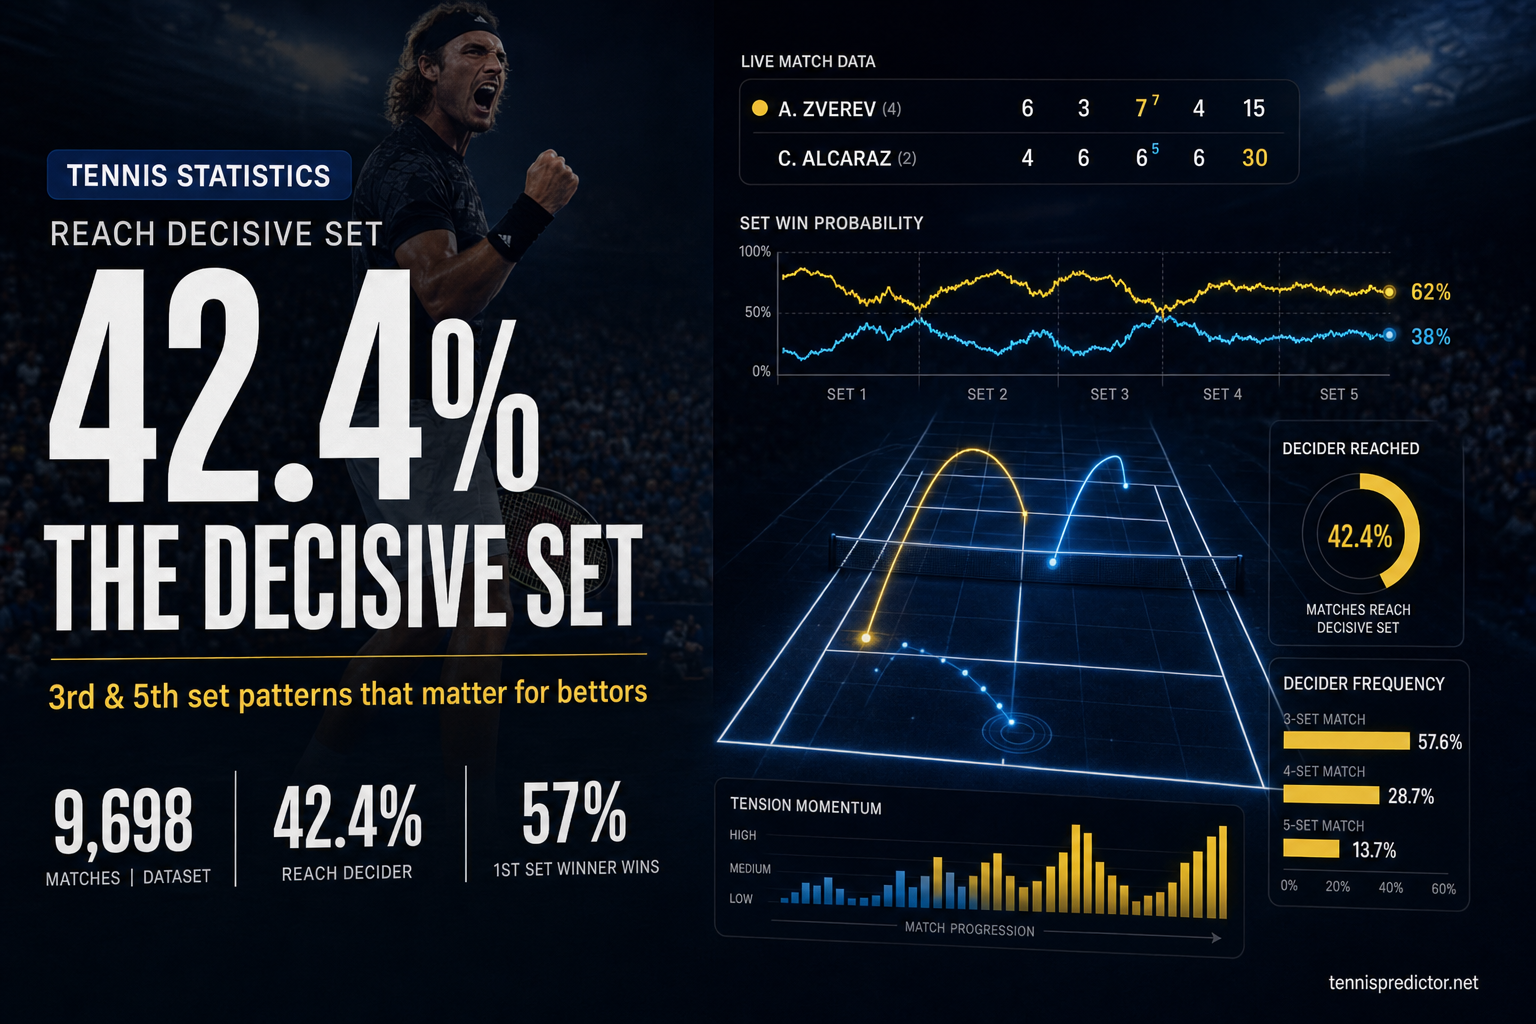
The decisive set: third set & fifth set statistics that matter for bettors
How often do ATP matches go to a third or fifth set—and when they do, does the first-set winner usually close it? Real scorelines, Grand Slam vs tour splits, and what it means for set and live betting.
February 21, 2026 · 22 min read

We analyzed 10,000 tennis matches: here's what we learned
Large-sample ATP study: what the Random Forest actually weights (odds, ranks, surface), how often lower-ranked players win by tier, and why H2H is thin at scale.
October 27, 2025 · 17 min read