
analyticsTennis Statistics & Probability
Tennis Statistics & Probability
What the data shows across thousands of matches — surfaces, sets, and probabilities
5 articles
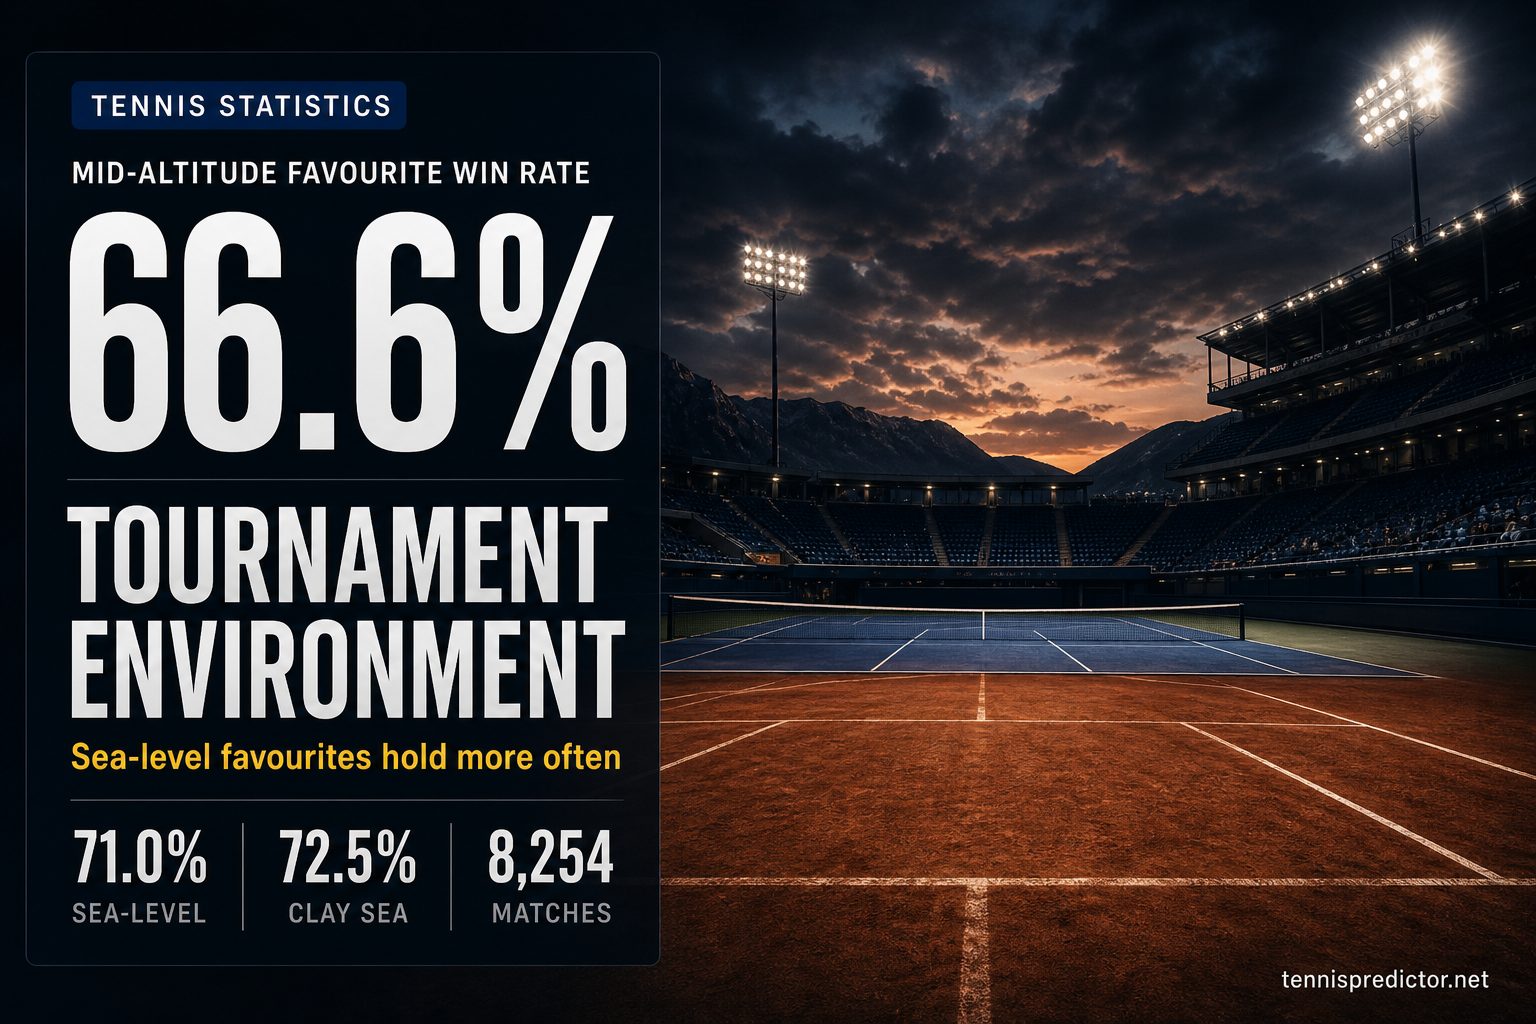
Does tournament environment change favourite win rates?
Altitude and typical venue climate are rarely priced as cleanly as surface. We joined 8,254 ATP matches with odds (2022–2025) to curated venue elevations and monthly temperature/humidity normals. Mid-altitude favourites win less often—especially on clay.
July 30, 2026 · 20 min read

When breaks happen: ATP set patterns from 2,798 charted matches
Most ATP breaks are isolated — not part of a streak. Yet they cluster in the final third of sets, and clay courts trade breaks far more often than grass. We analysed 2,798 charted men's matches from 2022 onward to map when breaks happen, how often players break back, and what set-one patterns look like by surface.
July 15, 2026 · 18 min read

First set betting: close-out rates, carry-through, and market context
When a pre-match favourite wins the first set, they close out the match 80.7% of the time — a 12-point boost over their baseline. But that number swings from 66% to 94% depending on their odds and the surface. Here's the full data-backed breakdown across 4,650 ATP matches.
May 11, 2026 · 29 min read

The decisive set: third set & fifth set statistics that matter for bettors
How often do ATP matches go to a third or fifth set—and when they do, does the first-set winner usually close it? Real scorelines, Grand Slam vs tour splits, and what it means for set and live betting.
February 21, 2026 · 22 min read

We analyzed 10,000 tennis matches: here's what we learned
Large-sample ATP study: what the Random Forest actually weights (odds, ranks, surface), how often lower-ranked players win by tier, and why H2H is thin at scale.
October 27, 2025 · 17 min read