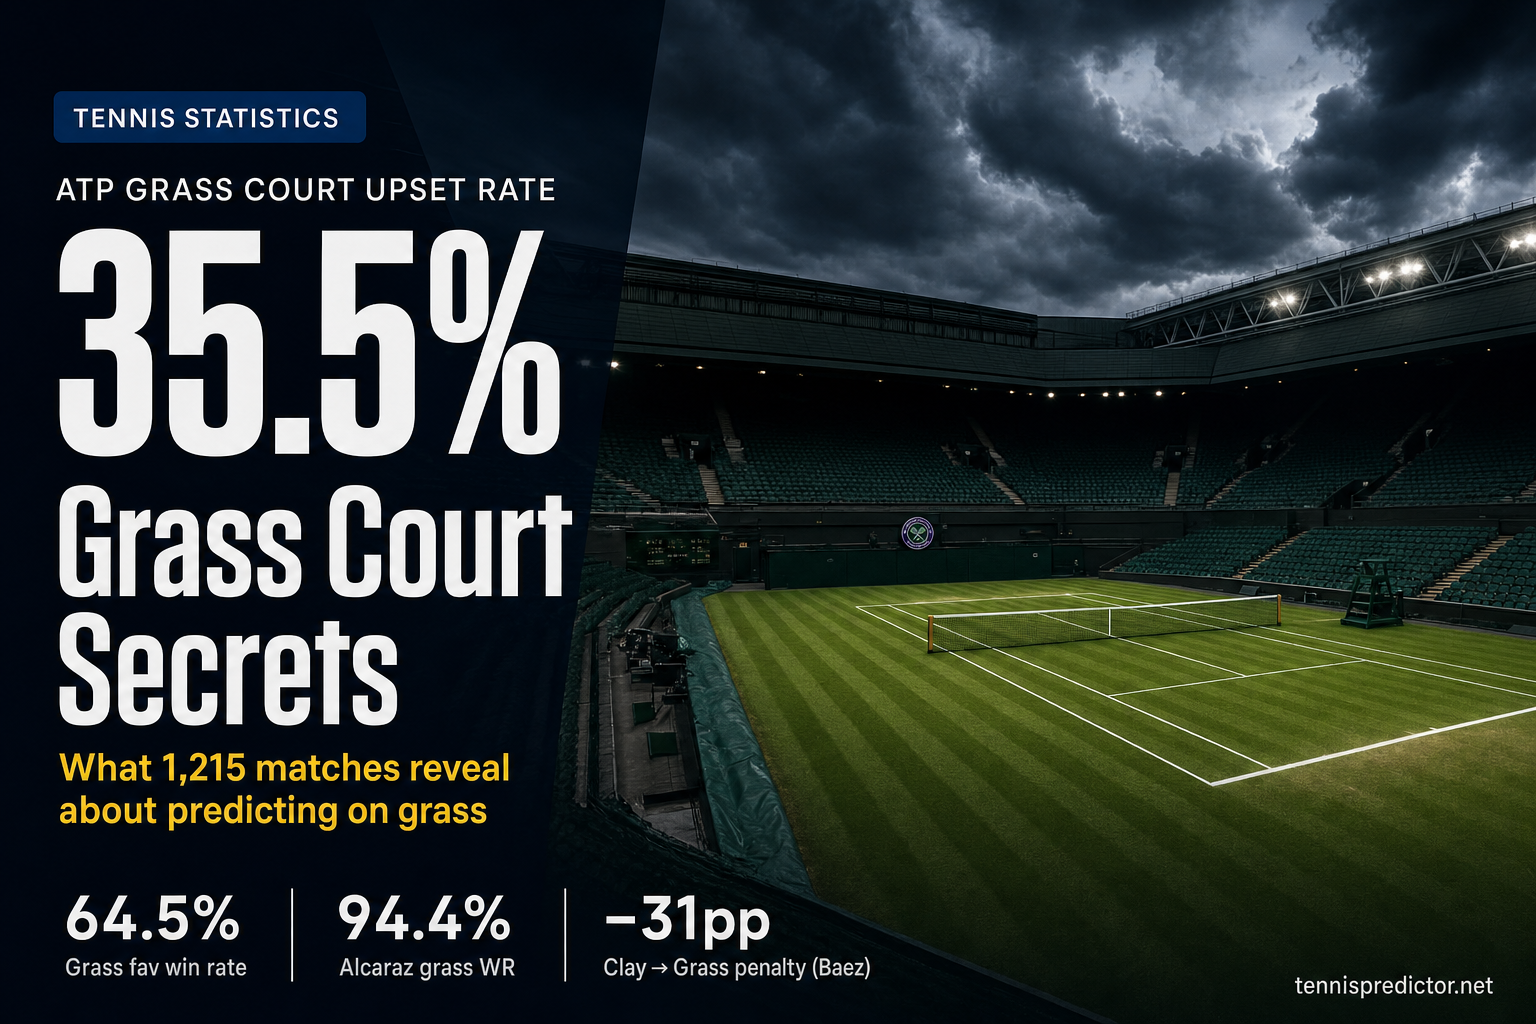
ATP grass court specificity: what 1,215 matches really tell us
Grass is ATP tennis's most debated surface. Pundits call it a lottery. Fans remember every giant-killing upset. But our training dataset tells a more nuanced story — one where the numbers are both counterintuitive and quietly coherent.
We analysed 1,215 ATP grass matches from 2022 to 2025 (out of 9,829 total matches across all surfaces). Grass represents only 12.4% of the total dataset — partly because the entire ATP grass season lasts just six weeks, from mid-June to late July. That compressed window makes the surface feel more chaotic than it actually is: upsets get amplified in the news cycle because they all happen within the same fortnight. This analysis covers the ATP Tour only — our training dataset does not include WTA matches. Here is what the data shows.
How common are upsets on grass? (Spoiler: less than you think)
The dominant narrative is that grass is chaos — wild bounces, serve dominance, freak results. The data largely disagrees.
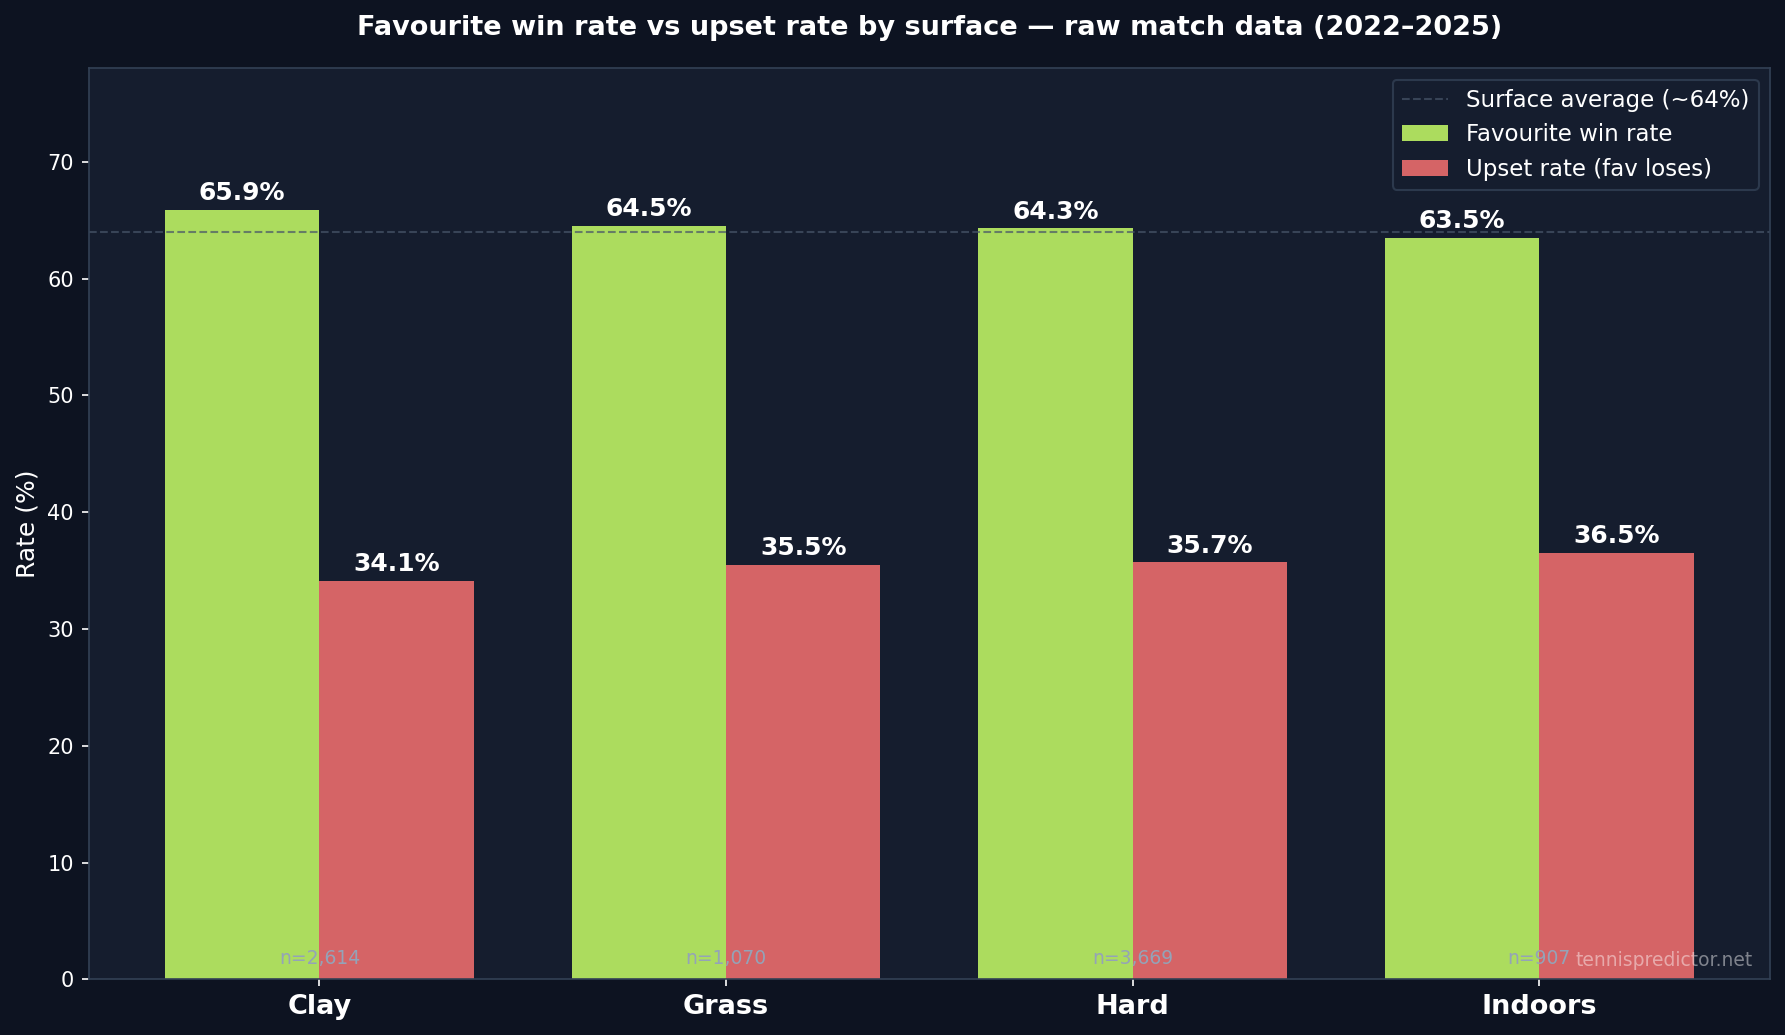
Favourite win rates by surface — raw match data (2022–2025):
| Surface | Matches with odds | Favourite win rate | Upset rate |
|---|---|---|---|
| Clay | 2,614 | 65.9% | 34.1% |
| Grass | 1,070 | 64.5% | 35.5% |
| Hard | 3,669 | 64.3% | 35.7% |
| Indoors | 907 | 63.5% | 36.5% |
The favourite is the player with the lower decimal odds in each match. Computed from the raw tournament match cache (winner/odds data, unbalanced). Matches without bookmaker odds are excluded (~1.6% of rows in 2022–2024, ~48% in 2025 due to a data collection gap). The ML training CSV is intentionally 50/50 balanced and cannot be used to estimate real-world favourite win rates.
The surfaces are surprisingly close. Clay edges out as the most predictable (34.1% upset rate), while grass (35.5%) and hard (35.7%) are nearly identical. The "chaos on grass" narrative is not supported by the data — the difference between grass and clay is only 1.4 percentage points across 1,070 and 2,614 matches respectively.
What the data does show is that grass is not more volatile than hard courts. The gap between them is just 0.2 percentage points. Indoors is the least predictable format at 36.5%, consistent with the serve-dominance effect of fast indoor surfaces.
What this means for prediction: the surface itself is not a strong modifier of upset probability. The grass specialist effect — which we explore below — matters far more than the surface's aggregate unpredictability.
The grass specialist effect: does surface experience matter?
We took each player's historical grass win rate and split the matches into five quintiles, then measured how often that player actually won:
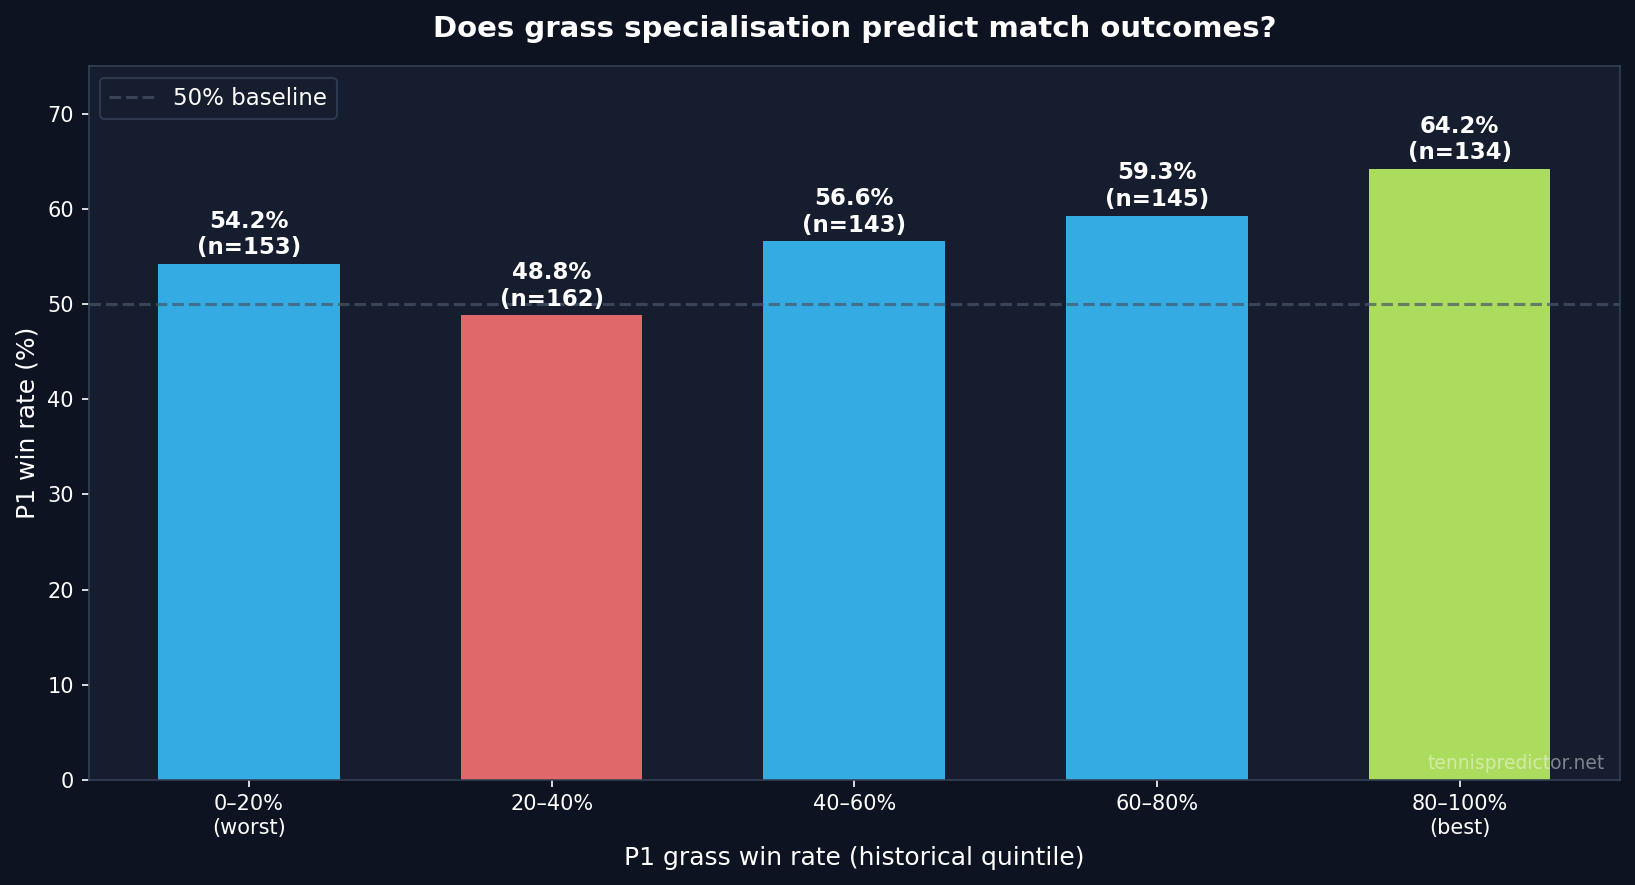
Match win rate by historical grass win rate quintile:
| Player's historical grass WR | Matches | Actual win rate |
|---|---|---|
| 0–20% (worst) | 153 | 54.2% |
| 20–40% | 162 | 48.8% |
| 40–60% | 143 | 56.6% |
| 60–80% | 145 | 59.3% |
| 80–100% (best) | 134 | 64.2% |
The top quintile — genuine grass specialists with 80%+ historical win rates — wins 64.2% of their matches. The spread from worst to best quintile is nearly 16 percentage points, which is one of the largest specialist effects we see across any surface.
The 20–40% bucket is actually the lowest at 48.8%. This is likely a small-sample artefact combined with an opponent quality effect: players who have specifically struggled on grass get matched against better opponents at grass events, compounding the negative signal.
For our prediction model, historical grass win rate is one of the stronger features available during the grass season precisely because the surface polarises players so sharply.
Top ATP players on grass (2022–2025, 15+ matches)
The leaderboard of grass win rates since 2022:
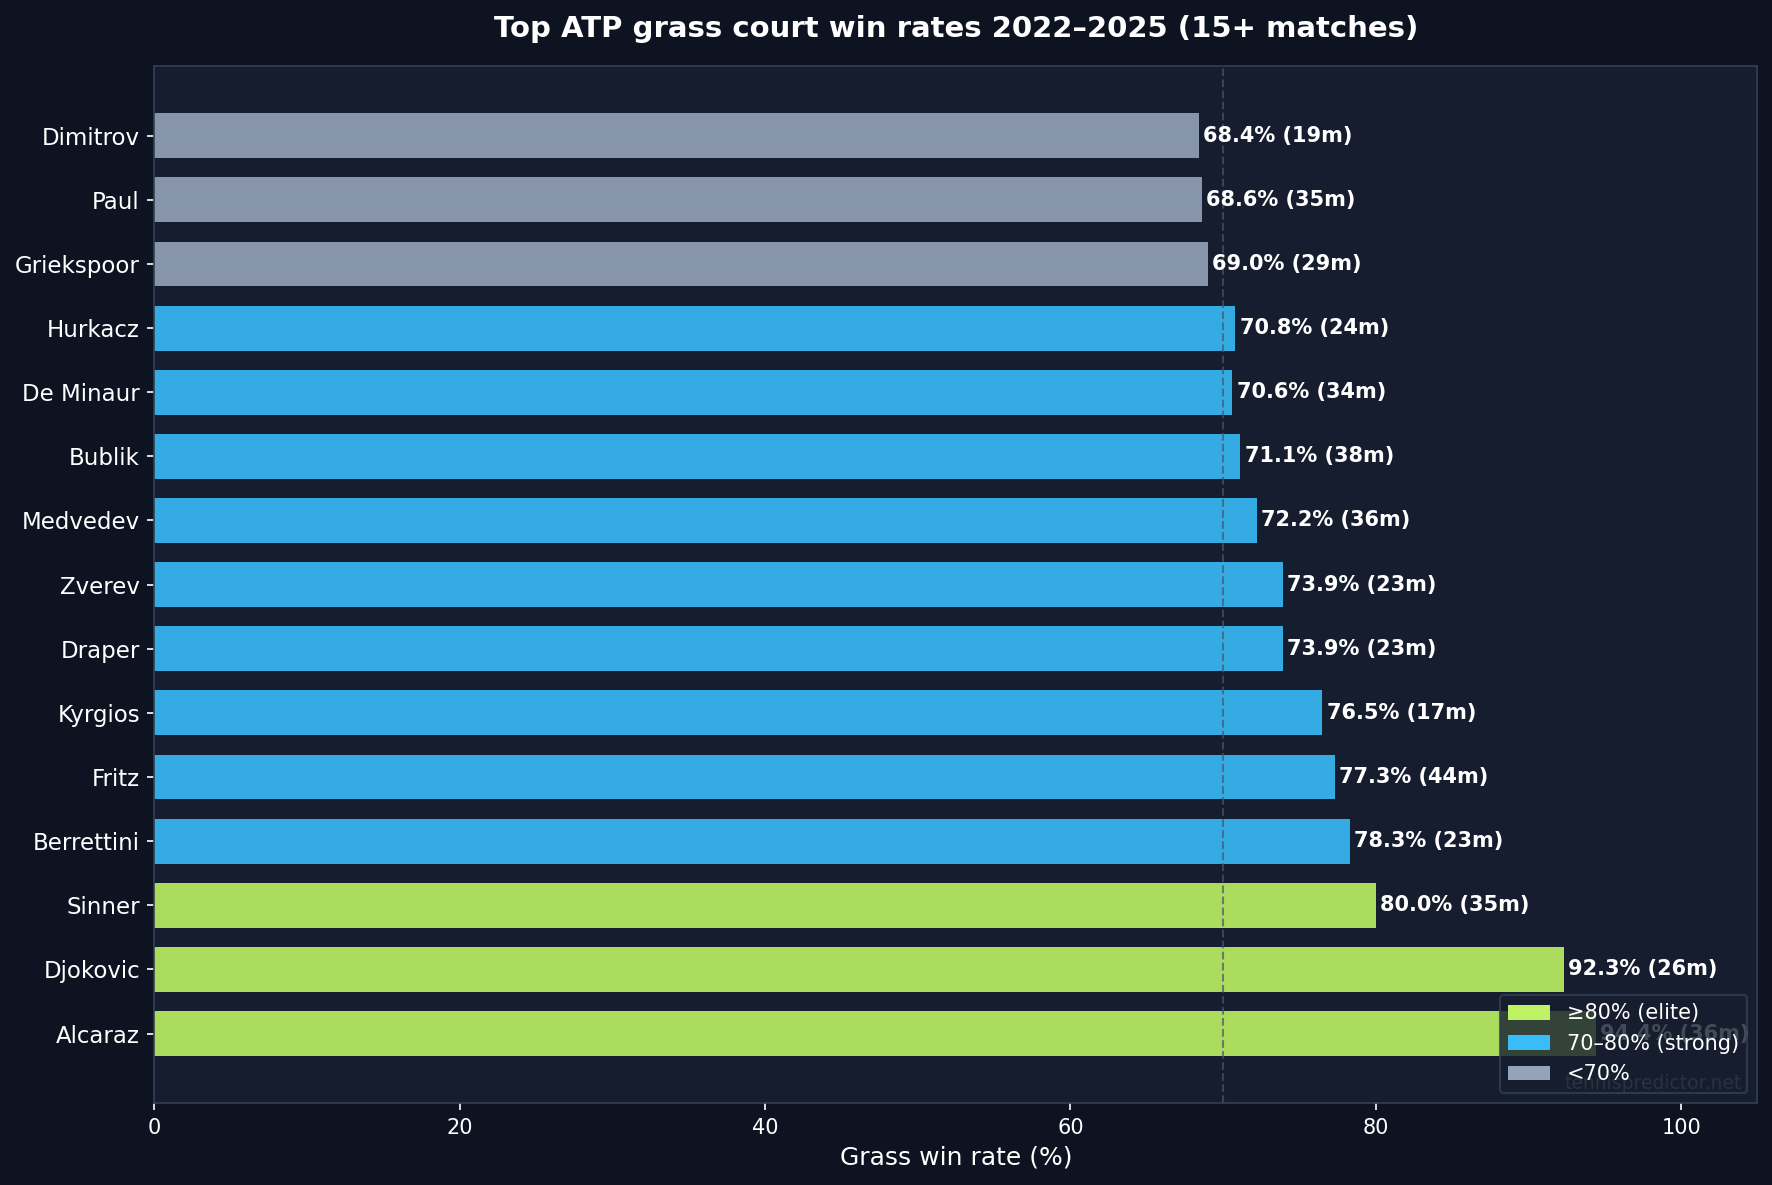
Top 15 grass win rates (minimum 15 matches):
| Player | Grass matches | Grass win rate |
|---|---|---|
| Alcaraz | 36 | 94.4% |
| Djokovic | 26 | 92.3% |
| Sinner | 35 | 80.0% |
| Berrettini | 23 | 78.3% |
| Fritz | 44 | 77.3% |
| Kyrgios | 17 | 76.5% |
| Draper | 23 | 73.9% |
| Zverev | 23 | 73.9% |
| Medvedev | 36 | 72.2% |
| Bublik | 38 | 71.1% |
Alcaraz and Djokovic sit in a different tier to everyone else: both above 90%. This is an extreme concentration of grass dominance — no other surface produces a similar two-player separation in our dataset.
Sinner at 80.0% and Berrettini at 78.3% form a credible second tier. Fritz (77.3% across 44 matches — the largest sample in the top 10) and Draper (73.9%) are the clearest evidence that the next generation is genuinely adapting to grass, rather than just surviving it.
Medvedev's 72.2% over 36 matches is the statistic that surprises bettors most. His flat-ball game and exceptional return, combined with his baseline physicality, transfers to grass better than his image suggests.
The clay-to-grass transition: who loses most ground?
The sharpest signal in grass prediction is not raw ranking or current form — it is how a player's grass win rate compares to their clay win rate. The surface switch from the Roland Garros red clay to Wimbledon grass is the most extreme transition in tennis, and our data quantifies the penalty precisely.
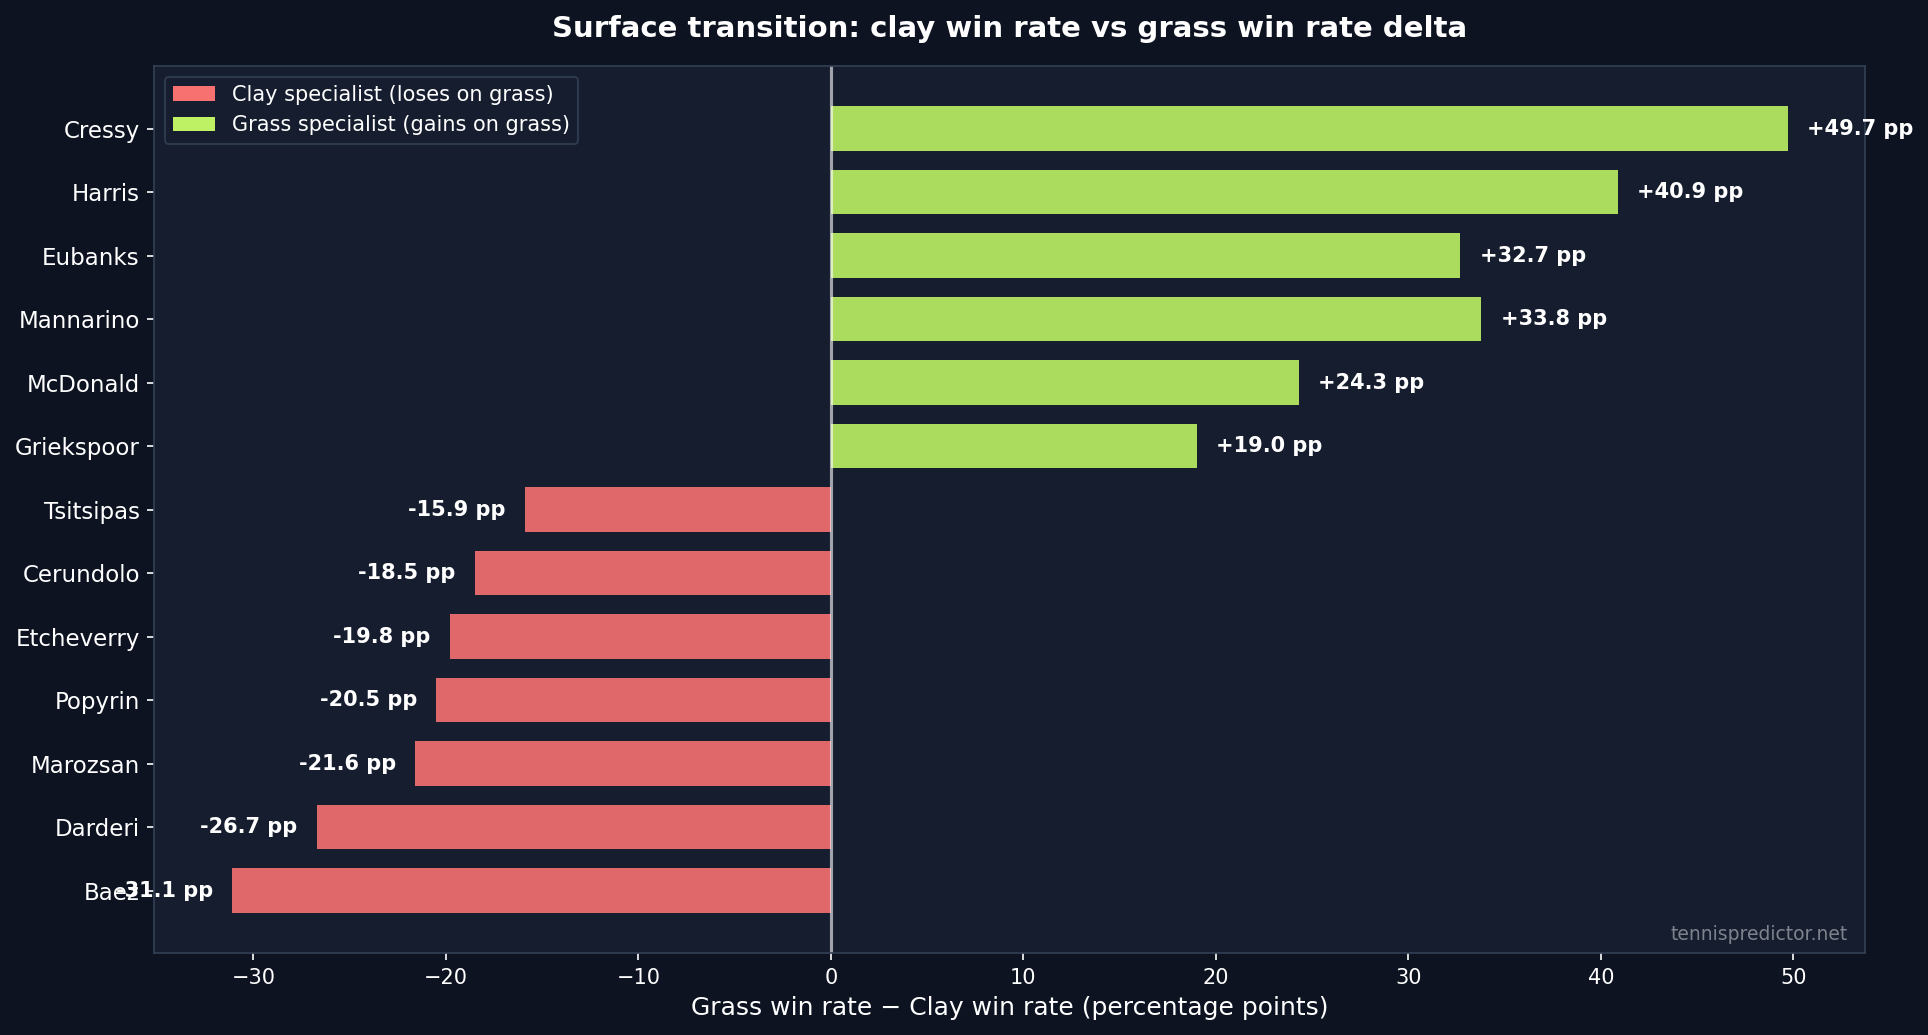
Biggest clay → grass drops (10+ matches on each surface):
| Player | Clay WR | Grass WR | Delta |
|---|---|---|---|
| Baez | 61.1% | 30.0% | −31 pp |
| Darderi | 66.7% | 40.0% | −27 pp |
| Marozsan | 51.6% | 30.0% | −22 pp |
| Popyrin | 53.8% | 33.3% | −21 pp |
| Etcheverry | 50.6% | 30.8% | −20 pp |
| Tsitsipas | 75.9% | 60.0% | −16 pp |
Biggest grass → clay gains (players who specialise on grass):
| Player | Clay WR | Grass WR | Delta |
|---|---|---|---|
| Cressy | 9.1% | 58.8% | +50 pp |
| Harris | 18.2% | 59.1% | +41 pp |
| Mannarino | 21.4% | 55.2% | +34 pp |
| Eubanks | 27.3% | 60.0% | +33 pp |
| Thompson | 27.3% | 57.1% | +30 pp |
The asymmetry is striking. Clay specialists transferring to grass lose 20–31 percentage points from their win rate. Grass specialists heading to clay lose a similar margin, but the absolute grass win rates for the specialists (Cressy 58.8%, Harris 59.1%) are dramatically higher than their clay win rates (9–27%).
Practical implication: when South American clay players enter the grass swing, their ranking significantly overstates their grass-specific threat level. Baez ranked in the world top 30 but wins only 30% of grass matches. Conversely, players like Cressy or Mannarino who look ordinary on the ATP ranking gain +30 to +50 percentage points on grass compared to their clay record.
This surface transition signal is one of the most persistent and consistent patterns in our entire dataset — and it is chronically underpriced in betting markets during the first week of Wimbledon warm-up events.
Upset rate by ranking gap on grass
How does the ranking difference between two players affect upset probability specifically on grass?
![]()
Grass upset rate by absolute ranking difference:
| Ranking gap | Matches | Upset rate |
|---|---|---|
| 0–10 (very close) | 169 | 35.8% |
| 11–25 (small gap) | 235 | 49.6% |
| 26–50 (medium gap) | 314 | 47.4% |
| 51–100 (large gap) | 271 | 54.5% |
| 100+ (huge gap) | 187 | 45.9% |
Closely matched players (rank gap ≤ 10) are actually the most predictable: only a 35.8% upset rate, well below the 35.5% grass surface average. When the two players are genuinely at the same level, the market favourite is a more reliable bet on grass.
The 51–100 gap bucket shows the highest upset rate at 54.5%. This is the zone where grass specialists and serve-and-volley players can most dramatically punch above their ranking. A player ranked 45 meeting a player ranked 120 often represents two players from different ends of the grass specialist spectrum rather than a clear quality gap.
Note: the ranking gap data in this chart is drawn from the ML training dataset (which is 50/50 balanced for model training). The absolute upset rates should be interpreted as relative comparisons across buckets, not as real-world frequencies. The directional pattern — close-ranked matches are more predictable, mid-gap matches most volatile — is consistent across data sources.
Year-by-year favourite win rate on grass
Season-to-season variance on grass is wider than on other surfaces because the field composition changes significantly year to year.
| Year | Matches with odds | Fav win rate | Upset rate | Coverage |
|---|---|---|---|---|
| 2022 | 324 | 68.5% | 31.5% | 100% |
| 2023 | 296 | 65.2% | 34.8% | 99.7% |
| 2024 | 297 | 72.4% | 27.6% | 100% |
| 2025 | 153 | ⚠ 39.2% | ⚠ 60.8% | ⚠ 51.5% only |
2022–2024 tell a coherent story: the market favourite wins 65–72% of ATP grass matches. 2024 was an exceptionally predictable grass season (72.4%), likely driven by Alcaraz's dominant Wimbledon run and a very top-heavy draw.
The 2025 row is unreliable. Only 153 of 297 grass matches have bookmaker odds data in our cache (51.5% coverage vs 100% for 2022–2024). The 39.2% figure is an artefact of the missing data and should not be read as a real collapse in grass predictability.
The year-over-year variance is real — grass is sensitive to player field composition in a way that clay and hard courts are not. A single dominant player entering deep into Wimbledon draws has a larger proportional impact on surface win rates because the grass match pool (1,215 matches over four seasons) is much smaller than hard (4,900) or clay (3,159).
Wimbledon vs the warm-up events: not all grass is equal
The 6-week grass season contains two distinct event types: the Wimbledon warm-up circuit (Stuttgart, Halle, Queen's Club, Hertogenbosch, Mallorca, Eastbourne) and Wimbledon itself. Their predictability profiles are meaningfully different.
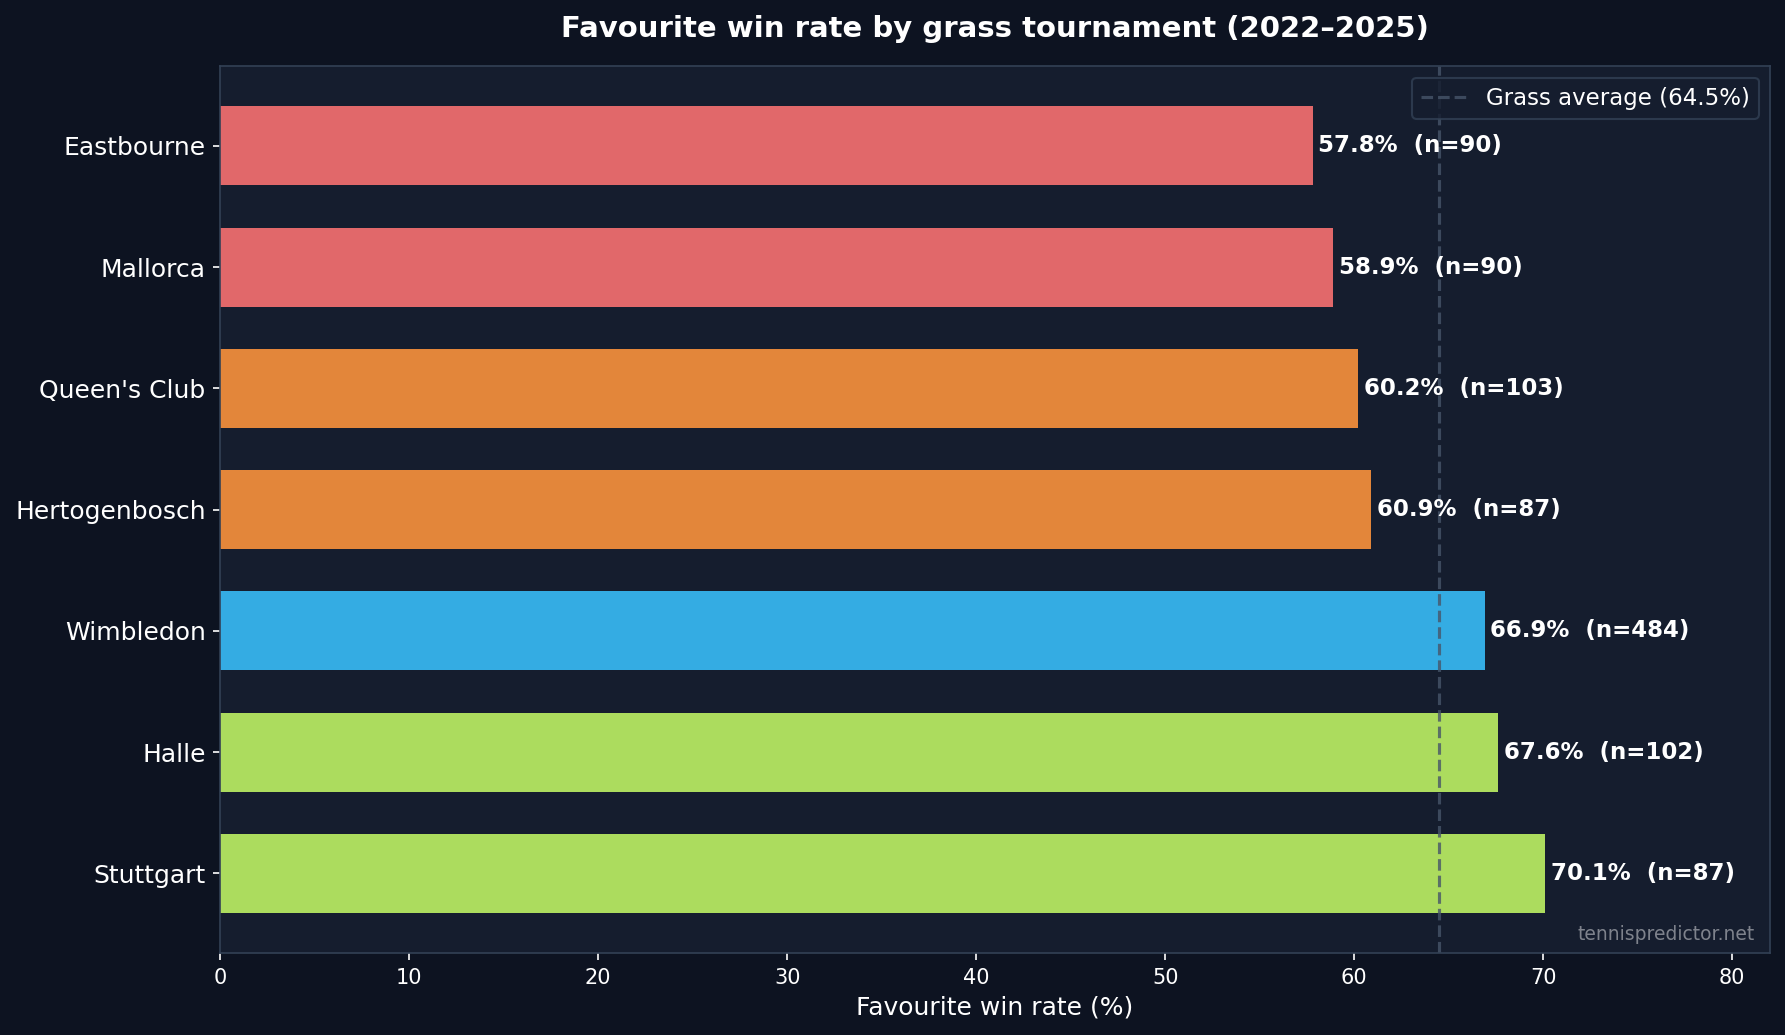
Favourite win rate by grass tournament (2022–2025, min 30 matches):
| Tournament | Matches | Fav win rate | Upset rate |
|---|---|---|---|
| Stuttgart | 87 | 70.1% | 29.9% |
| Halle | 102 | 67.6% | 32.4% |
| Wimbledon | 484 | 66.9% | 33.1% |
| Hertogenbosch | 87 | 60.9% | 39.1% |
| Queen's Club | 103 | 60.2% | 39.8% |
| Mallorca | 90 | 58.9% | 41.1% |
| Eastbourne | 90 | 57.8% | 42.2% |
Stuttgart and Halle are the most predictable grass events — more so than Wimbledon. Both draw strong fields (Stuttgart hosts Zverev's home crowd; Halle is a Djokovic/Alcaraz fixture), and the condensed draw format means genuine quality tends to convert. Favourites win 70.1% and 67.6% of matches respectively.
Wimbledon sits in the middle at 66.9% — above the surface average (64.5%) but lower than the top warm-up events. The Grand Slam premium reflects both field depth and the psychological weight of the tournament, where lower-ranked specialists occasionally produce their biggest results.
The bottom half — Hertogenbosch, Queen's Club, Mallorca, Eastbourne — are the upset-prone events. These four tournaments all sit below 61% favourite win rate. Eastbourne (57.8%) and Mallorca (58.9%) are the most volatile ATP grass events in our dataset, with upset rates above 40%. Eastbourne in particular is known for its strong serve-and-volley neutralising effect, and the draw quality is thinner than the prestige events.
Practical implication: if you are looking for systematic underdog value on grass, the warm-up week at Eastbourne, Mallorca, and Queen's Club offers better odds than Wimbledon — not because Wimbledon is uncompetitive, but because the smaller events structurally favour upsets.
What to do with all of this: a grass-season checklist
Pulling together all five dimensions of analysis, here is a practical framework for the ATP grass season:
Before the season starts:
- Note which players have a large positive grass premium vs their clay record (Cressy, Harris, Mannarino, Thompson). Their ATP rankings dramatically understate their grass relevance.
- Flag South American clay specialists (Baez, Darderi, Etcheverry) as players to fade on grass regardless of their current ranking or clay form.
- Confirm that Alcaraz and Djokovic are healthy — their 94.4% and 92.3% grass win rates mean their presence or absence radically shifts predictability at the top of any draw.
During the warm-up events:
- Be selective by tournament. Stuttgart and Halle favourites are the most reliable backing opportunities (70.1% and 67.6% win rates). Eastbourne and Mallorca underdogs deserve more consideration (40–42% upset rates).
- Tightest matches (rank gap 0–10) are counter-intuitively safer for the slight favourite on grass — the 35.8% upset rate is below the surface average.
During Wimbledon:
- Early rounds (rank gap 51–100) are where grass specialists are most dangerous as underdogs — this is the upset concentration zone where a player ranked 80 with a 70%+ grass win rate can genuinely threaten a top-40 opponent.
- The surface specialist effect is strongest here: a player in the top quintile of grass win rates (80%+) wins 64.2% of their Wimbledon matches regardless of ranking.
- Favour players whose grass win rate significantly exceeds their clay win rate over players whose recent form came exclusively from the clay swing.
What our model weighs on grass
In plain terms, here is what the model treats as most informative during the grass season — in order of importance:
-
Historical grass win rate — the single strongest signal. A player who has won 75%+ of their grass matches is reliably dangerous on the surface, regardless of current ranking or recent hard/clay results.
-
Grass match experience — a player with 30 grass matches on record is far more predictable than one with 5. Low experience → high model uncertainty → wider confidence intervals on the prediction.
-
Surface specialisation score — how polarised a player's win rate is across surfaces. A player who wins 75% on grass but 30% on clay has a very high specialisation score. This is one of the most divergent features between grass and hard in our dataset.
-
Grass-specific head-to-head — if two players have met on grass before, that record carries more weight than their overall H2H. However, most players have fewer than 5 grass H2H meetings, so this feature is thin and the model down-weights it accordingly.
-
Serve dominance proxy — players with higher surface specialisation on grass tend to be serve-heavy. The model captures this indirectly through the specialisation score rather than tracking ace counts directly.
Frequently asked questions
Is grass really more unpredictable than other surfaces?
No. Across 1,070 ATP grass matches with bookmaker odds (2022–2024 complete data), the market favourite wins 64.5% of the time — nearly identical to hard courts (64.3%) and only 1.4 percentage points below clay (65.9%). The "chaos on grass" narrative comes from high-profile upsets compressed into a short calendar window. At aggregate level, the surface upset rates are: Clay 34.1%, Grass 35.5%, Hard 35.7%, Indoors 36.5% — all within 2.4 percentage points of each other.
Which ATP players have the biggest positive grass specialisation premium?
In our dataset, Cressy (+50 pp grass vs clay win rate), Harris (+41 pp), and Mannarino (+34 pp) have the largest grass premium relative to their clay records. These are players whose ATP ranking understates their Wimbledon-week relevance significantly.
How much does clay court form predict grass court performance?
For most players, clay form has limited direct predictive value on grass. Our clay-to-grass transition analysis shows drops of 20–31 percentage points for the most clay-dependent players. We recommend treating grass win rate history as the primary feature and discounting clay form accordingly during the grass swing, especially for South American clay specialists.
Does being the stronger grass player in a match consistently predict the winner?
Our quintile analysis shows that genuine grass specialists (80%+ historical win rate) win 64.2% of their matches, compared to a 48.8–54.2% range for the other quintiles. The effect is real but not deterministic — grass specialists still lose roughly one in three matches. The signal is strongest in early-round match-ups where ranking gaps are medium-sized (51–100 rank difference).
How many grass matches are in the training dataset?
1,215 grass matches from January 2022 through end of 2025, representing 12.4% of our 9,829-match training corpus. The smaller sample (compared to 4,355 hard court matches) means grass-specific estimates carry wider confidence intervals, which is reflected in our model's uncertainty handling for grass predictions.
Related articles
If this surface deep-dive interests you, the same methodology applies to clay — our Roland Garros 2026 betting preview uses surface win rates as a primary input for the clay season predictions.
For the match structure analysis (how a first-set advantage converts to match wins), see when the favourite wins the first set.
And for a full picture of how these surface features interact with our model's other signals, analyzed: 9,544 tennis matches gives the complete feature importance breakdown.
See today's match predictions with confidence scores and value signals.
View Live Predictionsarrow_forwardRelated Articles
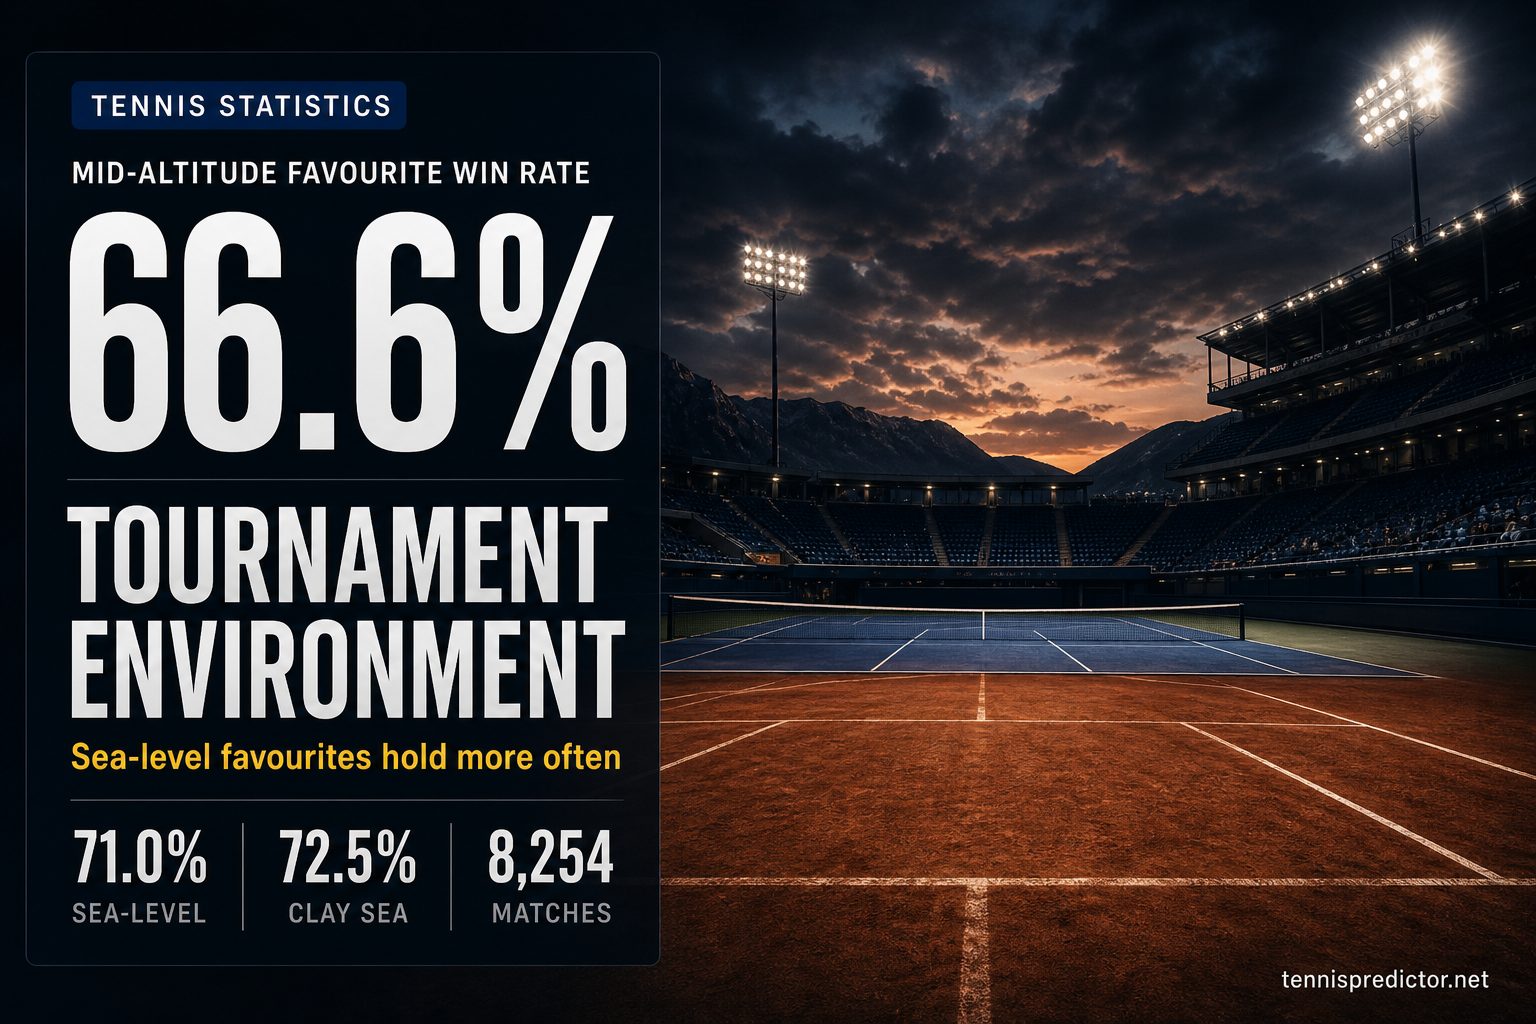
Does tournament environment change favourite win rates?
Altitude and typical venue climate are rarely priced as cleanly as surface. We joined 8,254 ATP matches with odds (2022–2025) to curated venue elevations and monthly temperature/humidity normals. Mid-altitude favourites win less often—especially on clay.
July 30, 2026 · 20 min read
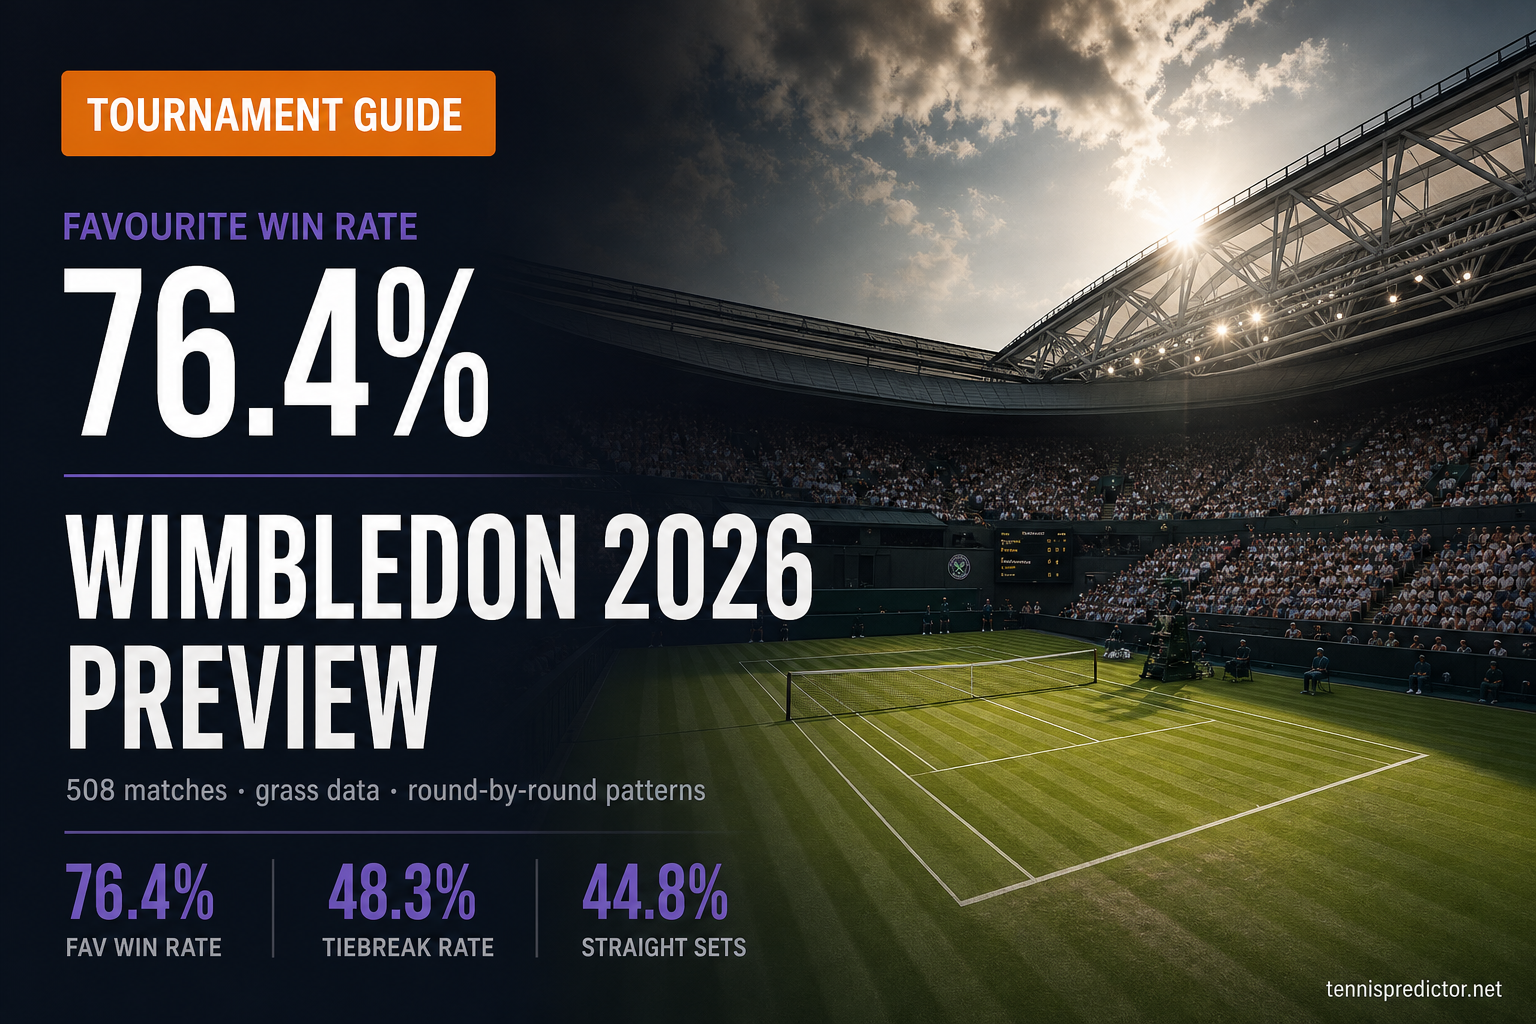
Wimbledon 2026 betting preview: what 4 years of grass-court data reveals
Wimbledon is not the upset lottery many bettors assume. Our analysis of 508 main-draw matches (2022-2025) shows a 76.4% bookmaker-favourite win rate — with clear round-by-round patterns, set distributions, and tiebreak tendencies that shape every grass prediction.
June 17, 2026 · 16 min read
US Open 2026 betting preview: what 4 years of Flushing Meadows data reveals
This US Open 2026 betting preview uses four years of Flushing Meadows match data. Bookmaker favourites won 70.9% across 508 main-draw matches — with a soft quarter-final window, outdoor hard-court set patterns, and clear contender fingerprints for 2026.
July 18, 2026 · 15 min read

When breaks happen: ATP set patterns from 2,798 charted matches
Most ATP breaks are isolated — not part of a streak. Yet they cluster in the final third of sets, and clay courts trade breaks far more often than grass. We analysed 2,798 charted men's matches from 2022 onward to map when breaks happen, how often players break back, and what set-one patterns look like by surface.
July 15, 2026 · 18 min read