Why capping short-odds official picks beat uncapped high-confidence betting
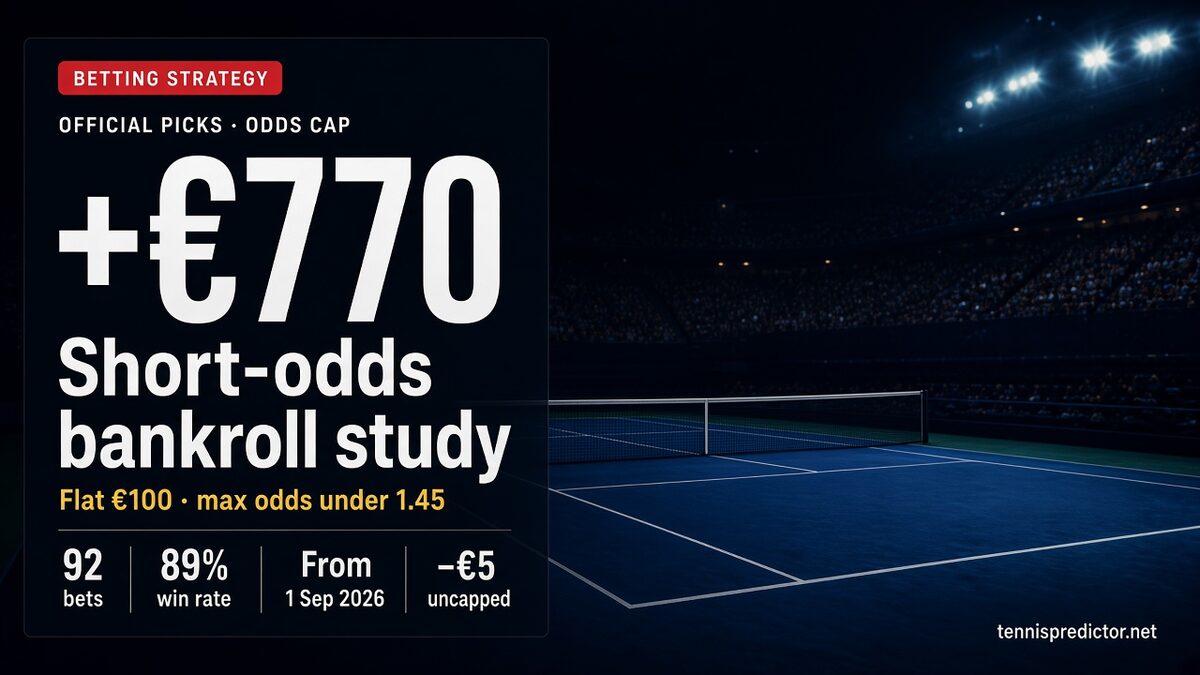
The headline contrast
From 1 September 2026 through 23 October 2026, we settled every official ATP pick the ensemble published under today’s rule: models agree and confidence sits at or above 65%. We staked a flat €100 on each pick when book decimal odds were available, starting from a €1,000 simulated bankroll.
Without any odds filter, that book finished almost exactly flat: −€5 on 116 bets (79.3% win rate, max drawdown €681).
Apply one extra filter — only bet when the pick’s decimal odds are under 1.45 — and the same window becomes +€770 on 92 bets (89.1% win rate, max drawdown €175). End bankroll: €1,770.
That is not a story about “always back short favorites.” It is a story about how high-confidence agreement and price interact on real ATP results after we raised the confidence floor. The uncapped sample did not fail because the model suddenly forgot how to pick winners. It failed because the 24 bets priced at 1.45 and above wiped nearly all of the profit the short-odds group had already earned.
This article walks through the methodology, the equity curves, the odds and confidence bands, the tournament-level cracks (especially Shanghai), and how the ten losing bets actually looked on the scoreboard. If you already follow our how AI predicts tennis overview, treat this as the bankroll sequel: what happens when you turn official picks into a staking rule.
Why this window matters
Tennis seasons are not stationary. A clay swing, a grass fortnight, and an Asian hard-court run do not share the same upset texture. We also changed how “official” is defined mid-summer when the confidence floor moved to 65%. Mixing pre- and post-change picks would muddy the lesson.
So we locked three things:
- Calendar — from the first day the new floor was cleanly in force (1 September)
- Rule — agree + confidence ≥ 65% only
- Stake — flat €100 so filter effects are not confused with Kelly or martingale artifacts
Everything below is about that locked experiment. When the next Slam or Masters cluster finishes, the honest follow-up is to re-run the same ledger — not to pretend one autumn sample is tennis forever.
What an official pick is
On TennisPredictor, an official pick is not every match the models score. It is the subset where:
Selection rule:
- Statistical and ML sides agree on the winner
- Ensemble confidence ≥ 0.65 (65%)
- The match is on the ATP path we publish as official
That floor changed on 29 August 2026. Starting the study on 1 September keeps the sample clean: every bet uses the current rule, not a mix of old and new thresholds.
Odds come from the same daily snapshots that power the live dashboard. If a pick has no usable decimal price in the snapshot, we skip it (one eligible row in this window). We do not invent closing lines or average multiple books after the fact.
Simulation stake:
- Start bankroll: €1,000
- Flat stake: €100 per bet
- No Kelly resizing, no stop-loss, no “press when hot”
Flat staking is deliberate. It isolates the selection filter from bankroll management effects. In production you should still size risk — this study asks a narrower question: which official picks were worth taking at all?
Agreement is doing real work
Casual readers sometimes treat “confidence 70%” as the whole product. It is not. Confidence without agreement can still be a soft spot: one model loves Player A, the other hedges, and the blend looks decisive on a dashboard while the underlying signals quarrel.
Official picks require both models to name the same winner and the blend to clear 65%. That double gate is why we are willing to study them as a bankroll object at all. It is also why longer-priced “official” rows surprised us — agreement said the match was settled; the market price said there was still a live dog; results often sided with the market’s doubt.
If you only skim confidence and ignore agreement, you are not following the rule this article measures.
What we compared
Two books, one window, one stake:
| Book | Odds rule | Bets | Wins | Win rate | Profit | End bankroll | Max DD |
|---|---|---|---|---|---|---|---|
| Baseline | No max odds (odds ≥ 1.01) | 116 | 92 | 79.3% | −€5 | €995 | €681 |
| Recommended | Odds ≥ 1.01 and < 1.45 | 92 | 82 | 89.1% | +€770 | €1,770 | €175 |
The recommended book skips 24 picks that cleared the confidence floor but sat at 1.45 or longer. Those 24 are the entire difference between “almost flat” and “+€770.”
Important caveat up front: the 1.45 cap was chosen because it maximised profit on this window. That is in-sample. We publish it as an operating hypothesis with transparent numbers — not as a guarantee that the same cut-off will dominate the next Masters 1000. Past performance is not a promise.
A quick break-even refresher
Decimal odds hide a brutal arithmetic. Your required win rate is simply one divided by the price:
| Price | Break-even WR | What 89% WR earns per €100 stake (approx.) |
|---|---|---|
| 1.10 | 90.9% | Negative if you only hit 89% |
| 1.20 | 83.3% | About +€6.80 expected per bet at 89% |
| 1.30 | 76.9% | About +€15.70 expected per bet at 89% |
| 1.40 | 71.4% | About +€24.60 expected per bet at 89% |
| 1.60 | 62.5% | Needs ~89% to print huge — we only hit ~39% in the 1.45–1.70 band |
That table is why “we were right most of the time” is not enough. The uncapped book was right 79% of the time overall and still finished −€5, because the misses clustered where the payout was larger. The capped book was right 89% of the time and refused the band that required a win rate the sample never delivered.
Equity: flat line vs climbing curve
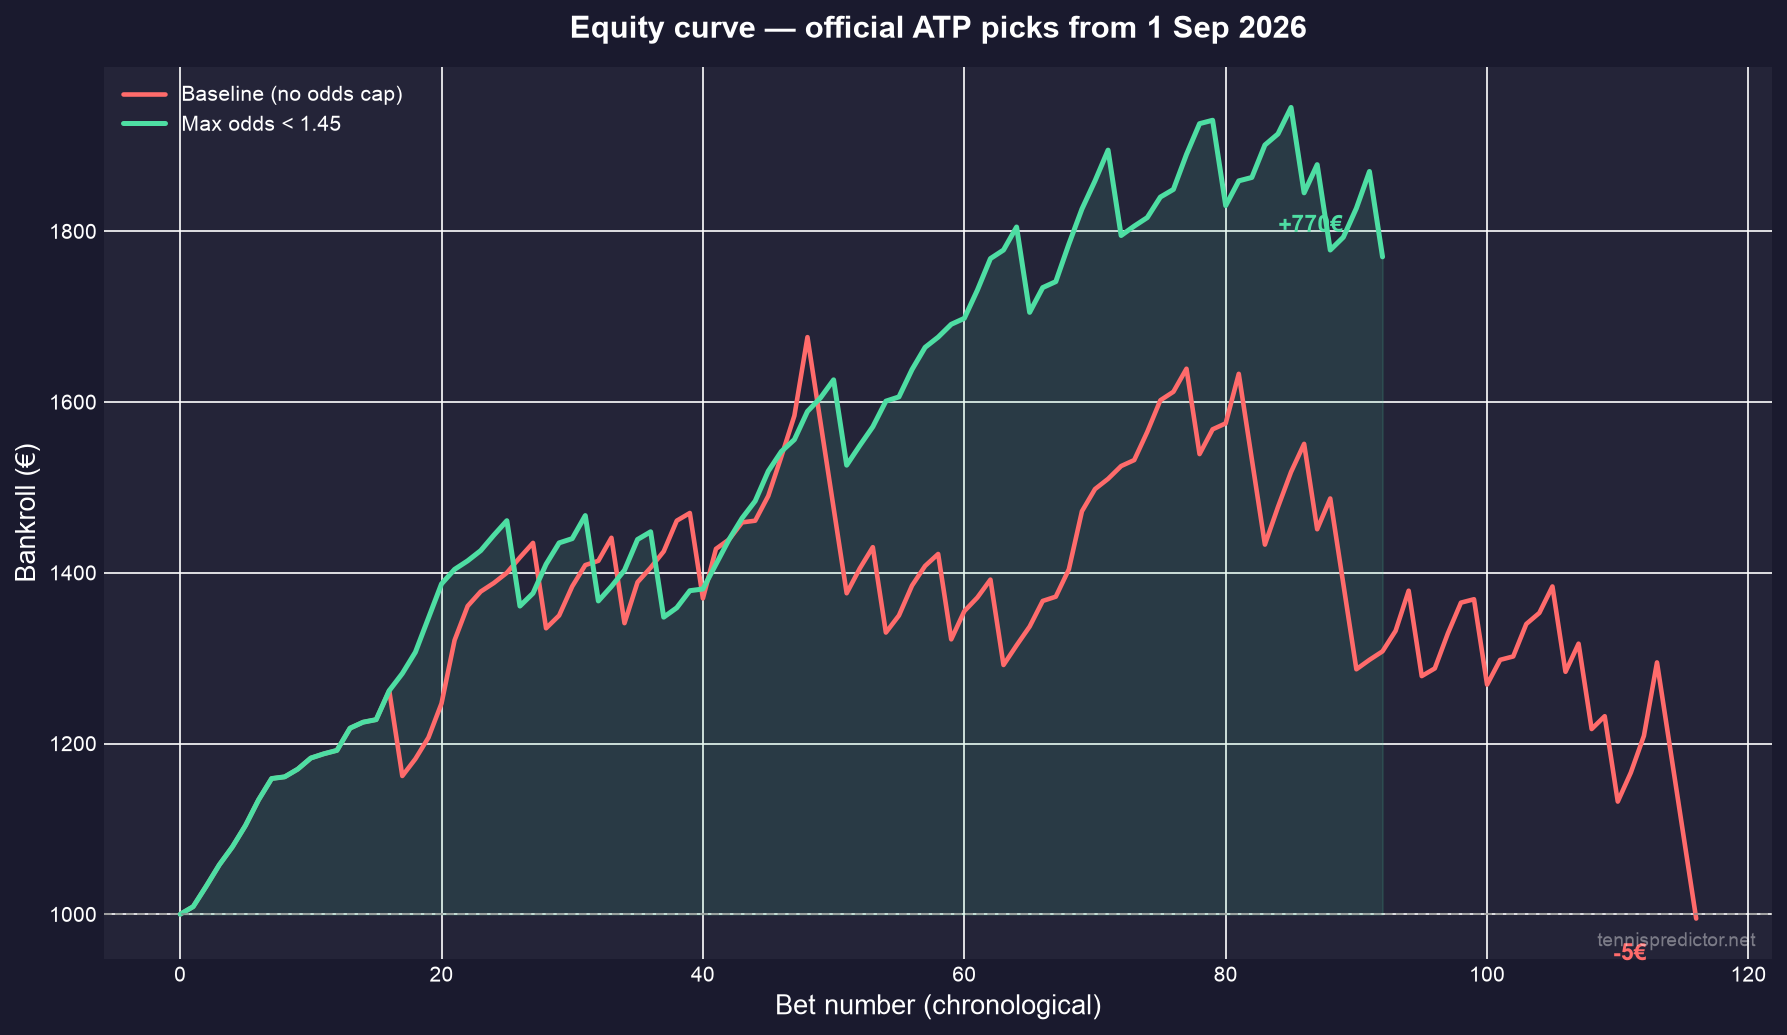 Figure 1: Flat €100 equity from 1 Sep. Coral = uncapped. Mint = max odds under 1.45.
The uncapped curve spends long stretches underwater and ends essentially where it started. The capped curve climbs with shallower drawdowns. That is what an 89% hit rate at short prices looks like when you refuse the longer shots that the confidence filter still lets through.
Two mechanics drive the gap:
- Hit rate. Short prices need a high win rate to pay. The capped book delivered 89.1%. The uncapped book’s extra 24 bets hit only about 42% as a group once you isolate the 1.45+ band (see next section) — nowhere near enough to carry longer prices.
- Drawdown. Baseline max drawdown was €681 on a €1,000 start. Capped max drawdown was €175. Same stake size; radically different path risk.
If you have ever watched a “high confidence” card swing wildly because a few 1.60–2.20 “agreements” went wrong, this chart is that experience in one picture.
Path risk is part of the product
Profit is what people screenshot. Drawdown is what makes them abandon a rule. Baseline max drawdown of €681 on a €1,000 start means the simulated roll spent time more than 60% underwater. Even if the ending P/L had been mildly positive, many humans would have quit mid-path — a classic betting mistake where process dies before math can work.
The capped path’s €175 max drawdown is still a full stake and a half of pain, but it is survivable for someone who sized units sanely. Filters are not only about expected value; they are about keeping you in the game long enough for the sample to matter.
Where the edge sat: odds bands
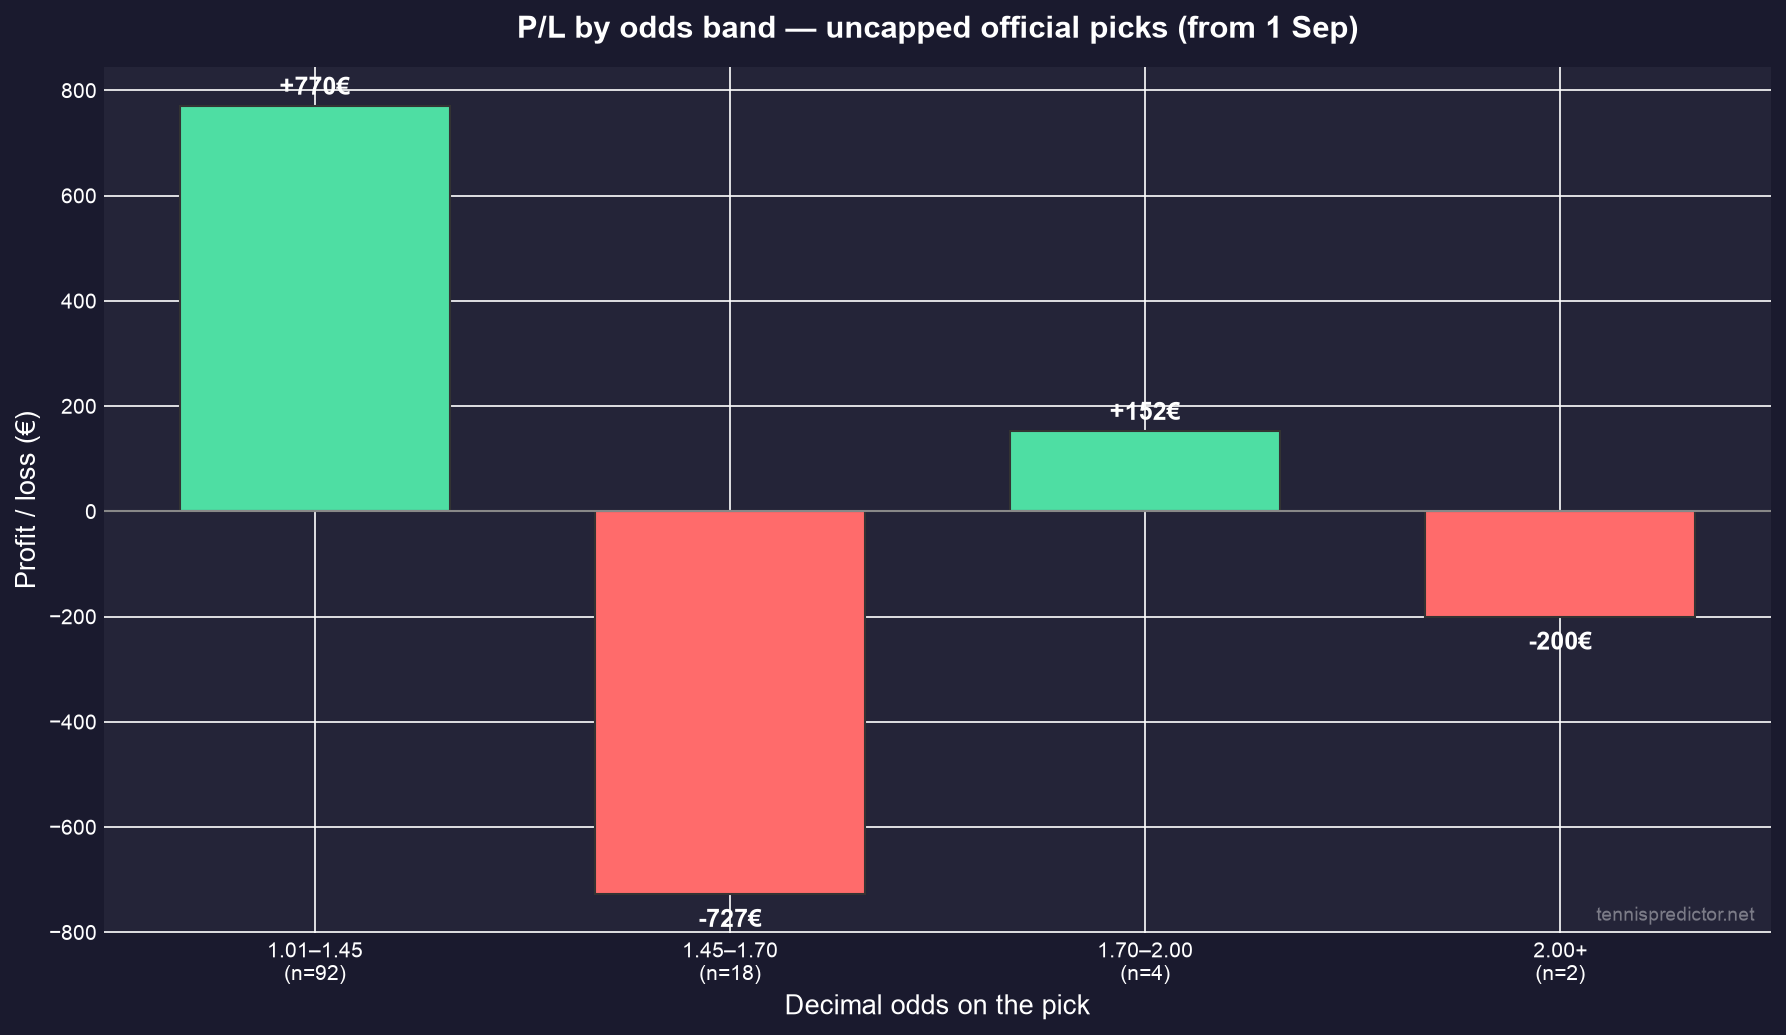 Figure 2: P/L by odds band on the uncapped book. The 1.01–1.45 group is the entire +€770 story.
Breaking the uncapped 116 bets by price:
| Odds band | Bets | Win rate | P/L |
|---|---|---|---|
| 1.01–1.45 | 92 | 89.1% | +€770 |
| 1.45–1.70 | 18 | 38.9% | −€727 |
| 1.70–2.00 | 4 | 75.0% | +€152 |
| 2.00+ | 2 | 0.0% | −€200 |
Read that carefully. The short-odds group alone made +€770. The 1.45–1.70 band alone lost €727. A handful of longer prices added noise, not structure.
Inside the recommended filter, the short band itself is not uniform:
| Odds band | Bets | Win rate | P/L |
|---|---|---|---|
| 1.01–1.15 | 29 | 89.7% | −€93 |
| 1.15–1.25 | 20 | 95.0% | +€267 |
| 1.25–1.35 | 29 | 86.2% | +€329 |
| 1.35–1.45 | 14 | 85.7% | +€267 |
The very shortest prices (1.01–1.15) still won almost 90% of the time but finished slightly negative on this sample — three losses at tiny prices punch hard when you only collect €4–€14 on a win. The sweet spot in this window was roughly 1.15–1.45: still short, still high hit rate, enough juice that a win pays for more than a rounding error.
That nuance matters for readers coming from value betting. Value hunting often pushes you longer. This study says the opposite for official (agreement + high confidence) cards: the published edge lived where the market already priced a heavy favorite — and where our hit rate cleared the break-even bar with room to spare.
Break-even win rate at decimal odds (o) is (1/o). At 1.30 you need about 76.9%. At 1.20 you need 83.3%. At 1.10 you need 90.9%. An 89% book clears 1.20 and 1.30 comfortably; it barely clears ultra-short chalk. That is exactly what the 1.01–1.15 row shows.
The 24 skipped bets in plain language
Skipping 24 official picks feels emotionally hard. Each one cleared agreement and 65% confidence. Each one looked “qualified.” Collectively they were the problem.
Roughly:
- 18 of them lived between 1.45 and 1.70 and returned a 38.9% win rate — a disaster band for that price
- A few longer prices added small samples of noise (one green pocket at 1.70–2.00 on four bets, two total losses above 2.00)
If your process cannot skip a confident-looking 1.55 after a winning streak, you do not have a filter — you have a mood. The whole point of writing the odds cap into the rule is to make the skip boring and automatic.
Where it broke: tournament level
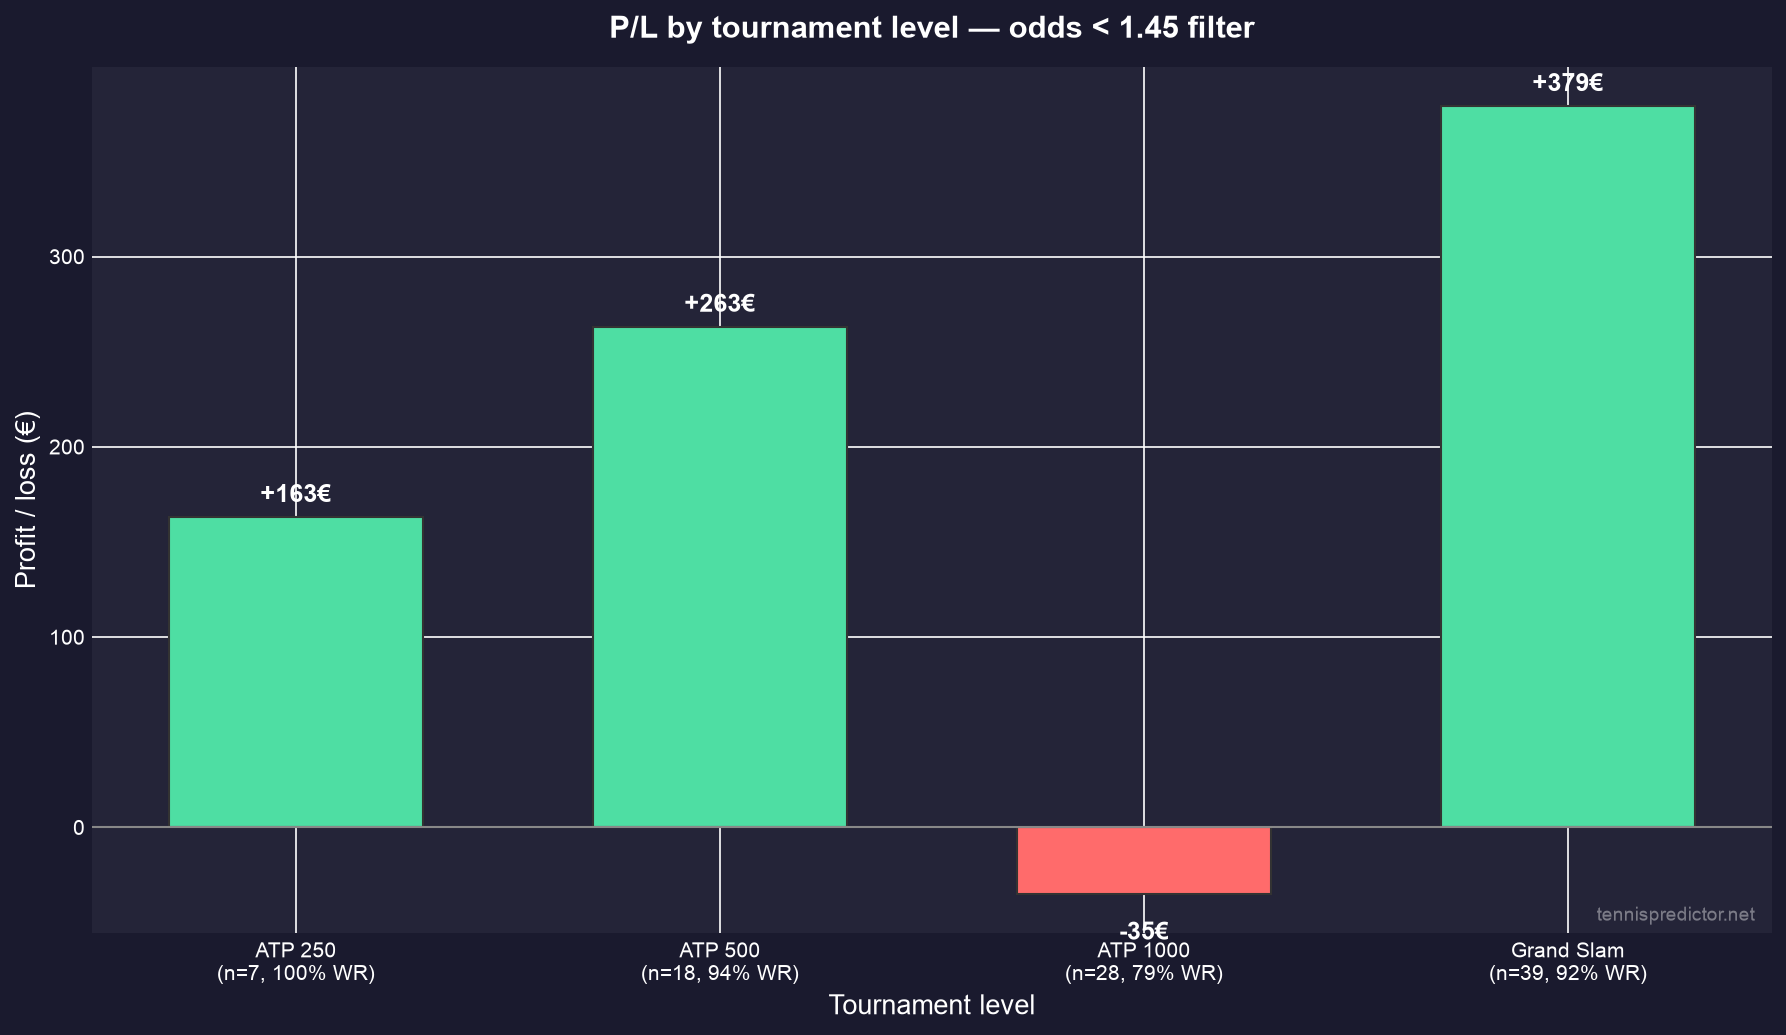 Figure 3: Only ATP 1000 (Shanghai in this window) finished negative under the odds cap.
Mapping each recommended bet to its event level:
| Level | Events in sample | Bets | Win rate | P/L |
|---|---|---|---|---|
| Grand Slam | US Open | 39 | 92.3% | +€379 |
| ATP 500 | Tokyo, Beijing | 18 | 94.4% | +€263 |
| ATP 250 | Hangzhou, Chengdu | 7 | 100% | +€163 |
| ATP 1000 | Shanghai | 28 | 78.6% | −€35 |
US Open alone carried a large share of the profit. ATP 500 and 250 were excellent on small samples. Shanghai Masters was the only level in the red: six of the ten total losses, and the only negative P/L bucket.
That does not mean “never bet Masters 1000.” It means that in this post–1 September window, under this official rule and odds cap, the Asian swing’s flagship hard-court event was where short favorites broke. Six Shanghai losses on 28 bets is enough to flatten a level that should have been a printer at 89% overall.
If you are scanning the dashboard during a stacked Masters week, treat official short-odds picks as usual — but watch for clusters of upset chalk. The next section shows confidence bands behaved the same way: one soft pocket, not a collapse of the whole rule.
Shanghai as a stress test
Shanghai alone hosted 28 of the 92 capped bets and 6 of the 10 losses. That concentration is the definition of a stress test: one venue, one surface week, travel and schedule noise, and a draw that mixes elites with dangerous home or form players at compressed prices.
Three of those six losses were bagels at short prices (Rublev 1.35, Shelton 1.35, Alcaraz 1.06). You can model for years and still eat a week like that. The question is whether your rule survives it. Here the overall book still finished +€770 because US Open, ATP 500, and ATP 250 profit more than covered Shanghai’s −€35. A rule that only “works” when no Masters week goes wrong is not a rule.
We are not proposing a Shanghai ban. We are proposing honesty: when the dashboard lights up green all week in Asia, remember that this sample’s ugly rows lived there.
Confidence is not monotonic profit
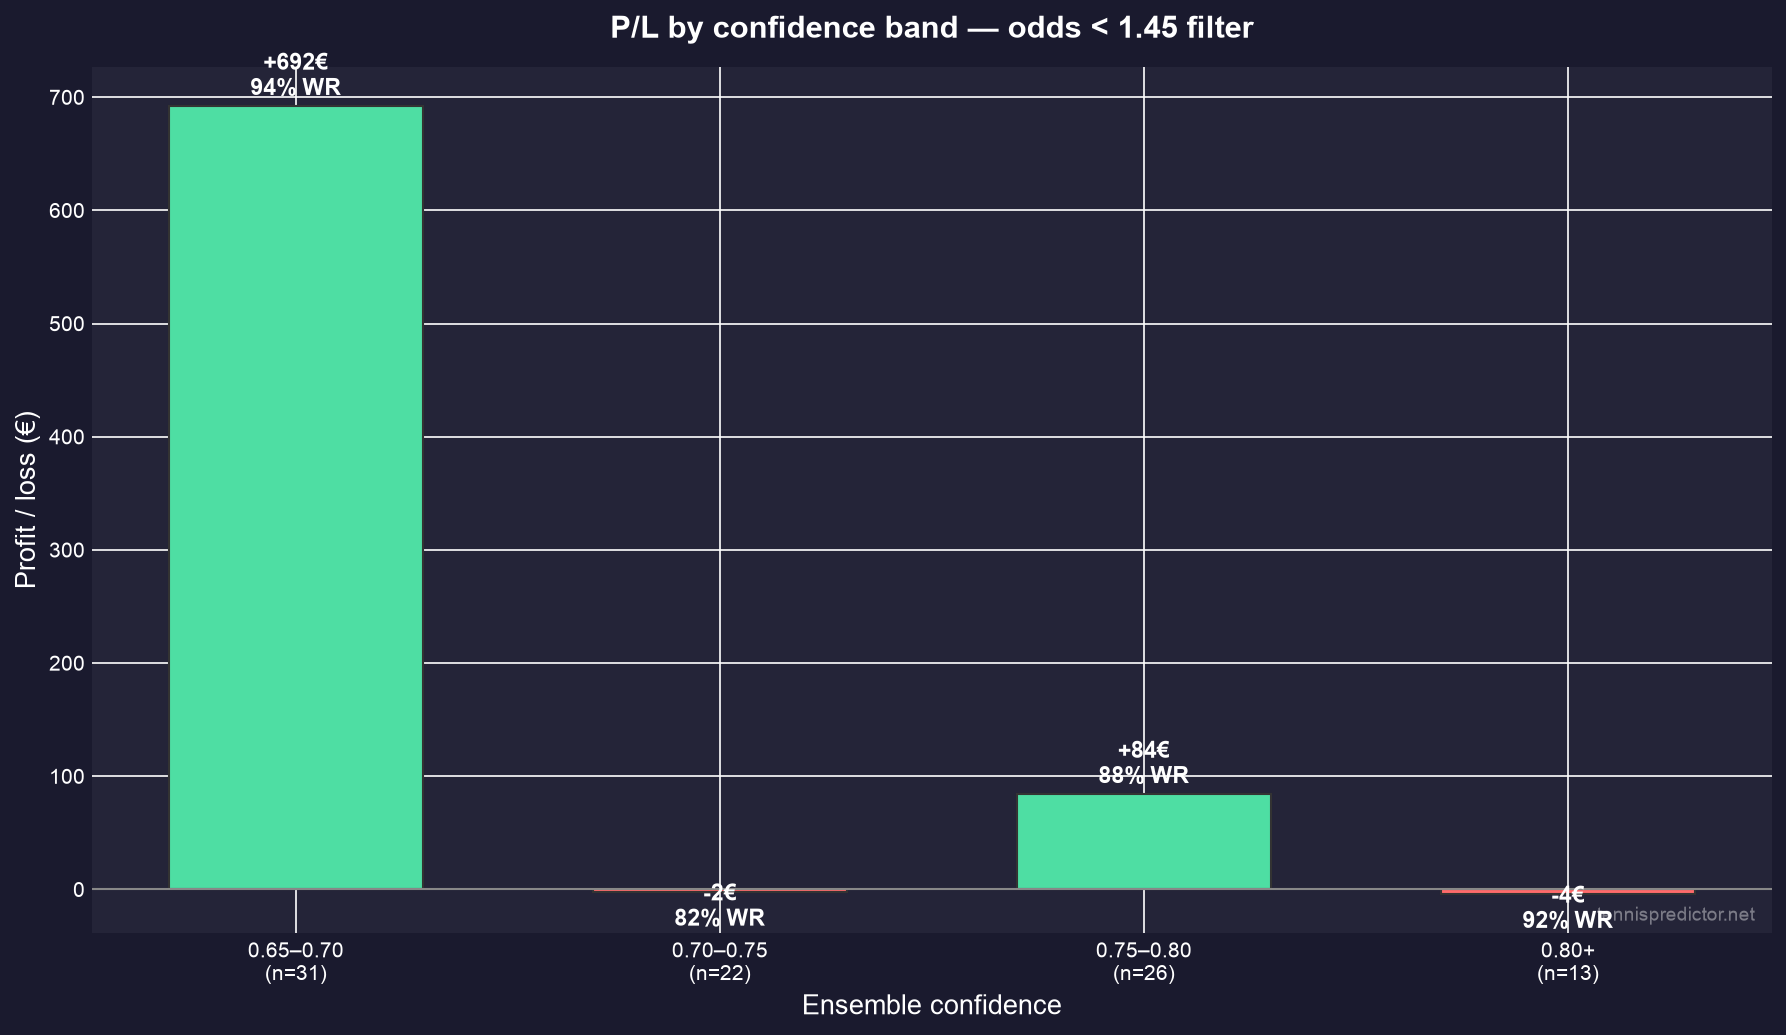 Figure 4: The 0.65–0.70 band led P/L; 0.70–0.75 was the soft pocket.
| Confidence | Bets | Win rate | P/L |
|---|---|---|---|
| 0.65–0.70 | 31 | 93.5% | +€692 |
| 0.70–0.75 | 22 | 81.8% | −€2 |
| 0.75–0.80 | 26 | 88.5% | +€84 |
| 0.80+ | 13 | 92.3% | −€4 |
Intuition says “higher confidence = safer.” This sample disagreed. The 0.65–0.70 band — right above the official floor — produced most of the profit. The 0.70–0.75 pocket went nearly flat: four of the ten losses sat there, including several Shanghai shorts.
Possible explanations (hypotheses, not proven causes):
- Mid-high confidence often flags matches that look “solved” on paper but sit in volatile rounds or travel weeks
- Ultra-high confidence (0.80+) is rare and dominated by tiny prices, so a single bagel wipes many small wins
- The floor itself already filters weak agreements; stacking “more confidence” on top is not free edge
For readers, the practical takeaway is discipline, not a new confidence cut-off. Do not assume 78% confidence is automatically a bigger stake than 66% when both are official and both are short. Stake sizing belongs in a bankroll plan, not in a vibes upgrade.
Early rounds vs late rounds (context)
On the same recommended sample, early rounds (1R–2R) carried most of the volume and profit: 55 bets, 90.9% win rate, +€535. Mid rounds (3R–R16) added 25 bets at 88.0% and +€207. Late rounds (QF and beyond) were only 12 bets: still green at +€28, but thinner and more variance-prone — exactly where Slam and Masters narratives tempt oversized stakes.
We keep that as context rather than a hard “fade late rounds” rule. Twelve bets is a postcard, not a climate report. Still, if you only remember one scheduling habit: do not save your biggest unit for the flashiest quarterfinal chalk just because confidence looks loud.
How the losses looked
Ten losses on the recommended filter. Seven were competitive (the pick still took at least one set). Three were straight-set sweeps — and all three bagels were in Shanghai.
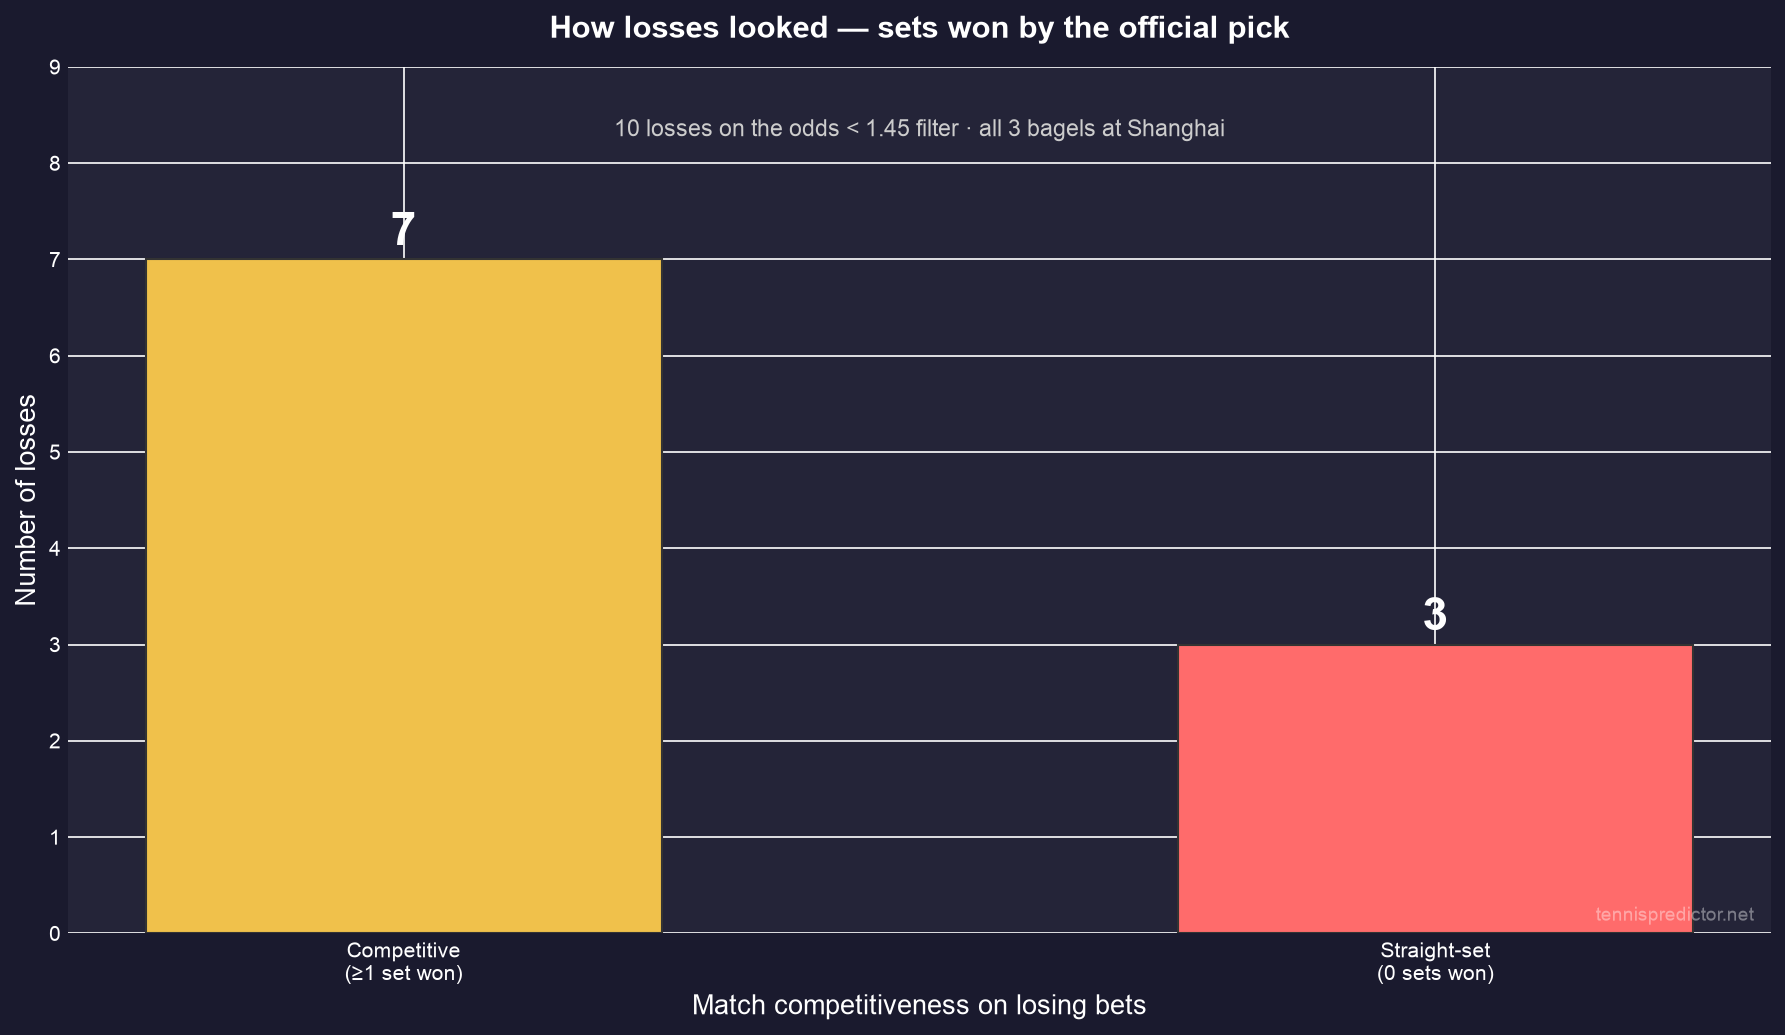 Figure 5: 7 of 10 losses still saw the pick win a set; all 3 bagels were Shanghai.
Straight-set losses (0 sets for the pick):
- Rublev priced 1.35 — lost to Sakamoto in Shanghai (6-4, 6-4)
- Shelton priced 1.35 — lost to Gea in Shanghai (7-6, 7-6)
- Alcaraz priced 1.06 — lost to Bergs in Shanghai (7-5, 7-6)
Competitive losses (pick won ≥1 set): included US Open upsets (Musetti–Sweeny, Fritz–Cerundolo, Alcaraz–Shelton), Fritz–Munar in Tokyo, and three Shanghai three-setters (Bellucci, Musetti, Zverev).
That split is useful psychologically. Most losing official shorts in this window were not total misreads — they were matches that stayed live. The bagels are the dangerous ones for bankroll feel: short price, zero sets, full stake gone. Concentrating those bagels in one Masters event is why the ATP 1000 row went negative even while the overall book printed.
Tournament mix of the ten losses: Shanghai 6 · US Open 3 · Tokyo 1.
Reading a loss without rewriting the rule
After a bagel at 1.06, the temptation is to torch the entire short-odds idea. After a five-set official pick that still loses, the temptation is to say “the model was basically right.” Both reactions are storytelling.
The ledger answer is narrower:
- Did the bet meet the written rule (official + odds cap)?
- Was the stake inside your bankroll policy?
- Does the rolling book still look like the study — or has a new band of prices started to bleed?
If you change the odds cap every time Shanghai sneezes, you will curve-fit yourself into paralysis. If you never revisit the cap after six months of new settled data, you are ignoring evidence. The middle path is scheduled review, not vibes.
What this is not
A few boundaries so the numbers cannot be misread:
Not a tipster claim. We are documenting a settled simulation on published official criteria, not selling a locked “system.”
Not out-of-sample proof. The 1.45 cut was tuned on this window. Future weeks can — and will — differ. The right response is to keep measuring, not to carve 1.45 into stone forever.
Not anti–value betting. Longer prices can still be +EV when your probability exceeds the implied price. This study only covers official picks (agreement + ≥65%). Value spots outside that rule are a different product. See our value betting beginner guide for that frame.
Not a substitute for staking rules. Flat €100 on a €1,000 bankroll is a 10% unit — aggressive by design for a clean comparison. Real bankrolls should use smaller fractions. Pair this filter with proper bankroll management.
Not a license to chase chalk blindly. The 1.01–1.15 band’s slight loss is the warning: if your win rate dips even a few points, ultra-short favorites become a slow bleed. Official agreement is a filter, not a blank cheque. Avoid the common chalk mistakes of betting a name because the price “looks safe.”
Practical takeaway for dashboard readers
If you use the live dashboard around the official ATP card, this window supports a simple operating rule:
Working rule we tested:
- Take official picks (agree + confidence ≥ 65%)
- Prefer decimal odds under 1.45
- Size stakes for variance (do not copy the 10% simulation unit)
- Expect Masters 1000 weeks — especially congested hard-court swings — to produce more short-price upsets
Watch-list, not yet hard filters:
- ATP 1000 clusters (Shanghai was 6/10 losses here)
- Confidence pocket 0.70–0.75 (flat P/L on 22 bets)
- Ultra-short 1.01–1.15 chalk (high WR, thin margin)
Those watch-list items are descriptive for this sample. We are not claiming a second filter on confidence or level without a longer book.
The deeper lesson matches what we argued in how AI predicts tennis: models output probabilities; bankrolls live on selection + price + stake. Agreement and confidence get you into the official set. Odds decide whether that set is a grind or a printer. Stake decides whether a Shanghai bagel week is uncomfortable or fatal.
A simple pre-bet checklist
Before you treat a dashboard row like the bets in this study, run five checks:
- Is it official? Agreement on, confidence ≥ 65%.
- Is the price in band? Decimal odds on the pick under 1.45 (or your reviewed cap).
- Is the stake boring? A small fixed fraction of bankroll — not “I feel good about Alcaraz.”
- Is this a clustered Masters day? If yes, expect more short-price variance; do not pyramid units.
- Am I chasing yesterday’s bagel? If yes, stop. Revenge stake sizing is how −€35 Shanghai weeks become −€500 personal weeks.
Print it. The common mistakes article is full of people who knew better and still skipped step five.
Methodology footnotes
Window: 2026-09-01 → 2026-10-23 (52 days from cutoff; settled matches only).
Why 1 Sep: confidence floor moved on 29 Aug; September 1 avoids mixing rules.
Odds: snapshot decimal odds on the predicted winner at publish time; one eligible pick lacked odds and was skipped in both books.
Correctness: settled against the actual match winner.
Sets on losses: scorelines oriented so “sets won by the pick” reflects the official selection, not the raw string order.
Bankroll path: sequential chronological bets; insufficient-bankroll skips = 0 in both runs (flat €100 never exhausted the simulated roll before the end).
Frequently asked questions
What counts as an official pick?
An official ATP pick is a match where our statistical and ML models agree on the winner and the ensemble confidence is at least 65%. That is the card we treat as the published high-confidence set on the dashboard — not every scored match.
Why cap odds at 1.45?
On this post–1 September sample, bets at 1.45 and longer destroyed the uncapped book (−€727 in the 1.45–1.70 band alone). Keeping only odds under 1.45 left 92 bets at 89.1% win rate and +€770. The number is an in-sample operating choice, not a universal law of tennis pricing.
Is +€770 a realistic expectation going forward?
No. It is the settled result of one ~seven-week window with a filter chosen on that same window. Use it as evidence that price discipline on official picks mattered, not as a forecast of next month’s profit.
Does this mean I should only bet heavy favorites?
Only inside the official rule as tested. Heavy favorites without agreement and confidence are a different animal. And even inside the rule, the shortest band (1.01–1.15) was the thinnest margin. Short ≠ automatic.
How should I size stakes if I follow a similar filter?
Not at 10% of bankroll. The flat €100 / €1,000 setup was for clean comparison. Use a fraction that survives a Masters upset cluster — see our bankroll management guide for Kelly and risk-of-ruin framing.
Where can I see today’s official picks?
On the TennisPredictor dashboard. Cross-check confidence, agreement, and the decimal price before you treat a row as the same kind of bet studied here.
See today's match predictions with confidence scores and value signals.
View Live Predictionsarrow_forwardRelated Articles
Bankroll management: the key to long-term betting success
You've found value bets and your model predicts winners with 70%+ accuracy. But you're still losing money. Why? Poor bankroll management. This guide reveals the mathematical strategies that separate successful bettors from broke ones.
July 17, 2026 · 15 min read

Common tennis betting mistakes (and how to avoid them)
From betting as a fan to over-reaching into thin markets, here are the ten repeatable errors that quietly ruin most tennis bankrolls—plus a checklist, real data, and a FAQ to break the habits for good.
November 16, 2025 · 15 min read

Best tennis markets to bet: match winner vs set betting vs games
Moneyline, sets, totals, first set, live: which market fits your edge? Tables, six charts, myths debunked, and FAQs—built on thousands of ATP matches.
November 3, 2025 · 17 min read
Value betting in tennis: a beginner's guide
Most tennis bettors lose money. Not because they can't predict winners, but because they don't understand value betting. Learn the difference between winning bets and profitable bets.
October 26, 2025 · 8 min read