
When the favorite wins the first set: match close-out rates by surface and odds
Published: May 11, 2026 Reading time: 20 minutes Category: Tennis statistics & probability
When a pre-match favorite wins the opening set, how often do they actually close out the match? The intuitive answer is "almost always." The data-driven answer is more precise — and more useful for anyone who trades live tennis markets.
Across 4,650 ATP matches with pre-match odds available in our tournament database, a favorite who wins set one converts to a match win 80.7% of the time. That is a material lift from their unconditional baseline of 68.7%, but it also means the favorite still drops one in five matches after winning the opener. Knowing which conditions push that number toward 91% — and which drag it toward 66% — is where the edge lives.
This article works through the full picture: the overall set-one boost, the breakdown by pre-match odds strength, the surface-specific rates, and the combined surface-by-odds matrix that gives the most granular anchor for live-market reasoning.
The dataset: how we measure this
Source and scope
All figures come from ATP tournament match records stored in our multi-year database of scored matches (2022–2026 seasons). From that cache we extracted every match satisfying three conditions:
- Both players' pre-match decimal odds are present and differ (evens matches excluded)
- The match score contains at least one completed set with a parseable scoreline
- The match has a clean winner flag
That filtering yielded 4,650 qualifying matches. Surface breakdown:
| Surface | Matches |
|---|---|
| Hard (outdoor) | 2,207 |
| Clay | 1,533 |
| Grass | 593 |
| Hard (indoor) | 317 |
| Total | 4,650 |
How we define "favorite"
The player with the lower decimal odds is the favorite. When both players share the same price, the match is excluded. This gives an unambiguous, market-derived favorite label for every match without relying on rankings or seeds.
First-set winner parsing
We read the first number pair from the score string (e.g. the 6-3 in 6-3, 4-6, 6-4) and compare to player1 / player2. If p1_score > p2_score, player1 won the set; otherwise player2 did. Scores with tiebreak notation (e.g. 7-6(4)) are handled correctly — the tiebreak digit does not affect which player won the set. Rows where parsing fails are dropped rather than guessed.
What we do not claim
- These are conditional frequencies, not match predictions for tonight.
- We do not have court-speed or altitude data per row — surface labels come from the tournament-level metadata in our cache.
- WTA matches are not included; this is ATP only.
The baseline: how often does the favorite win?
Before conditioning on anything, the favorite wins the match 68.7% of the time in this sample. That single figure is worth anchoring to — it is the market's prior before a ball is struck.
It also tells you something about the data quality: a 68.7% unconditional favourite win rate is close to the typical ATP season average reported across other large match databases, which validates that the odds-derived favorite label is behaving as expected.
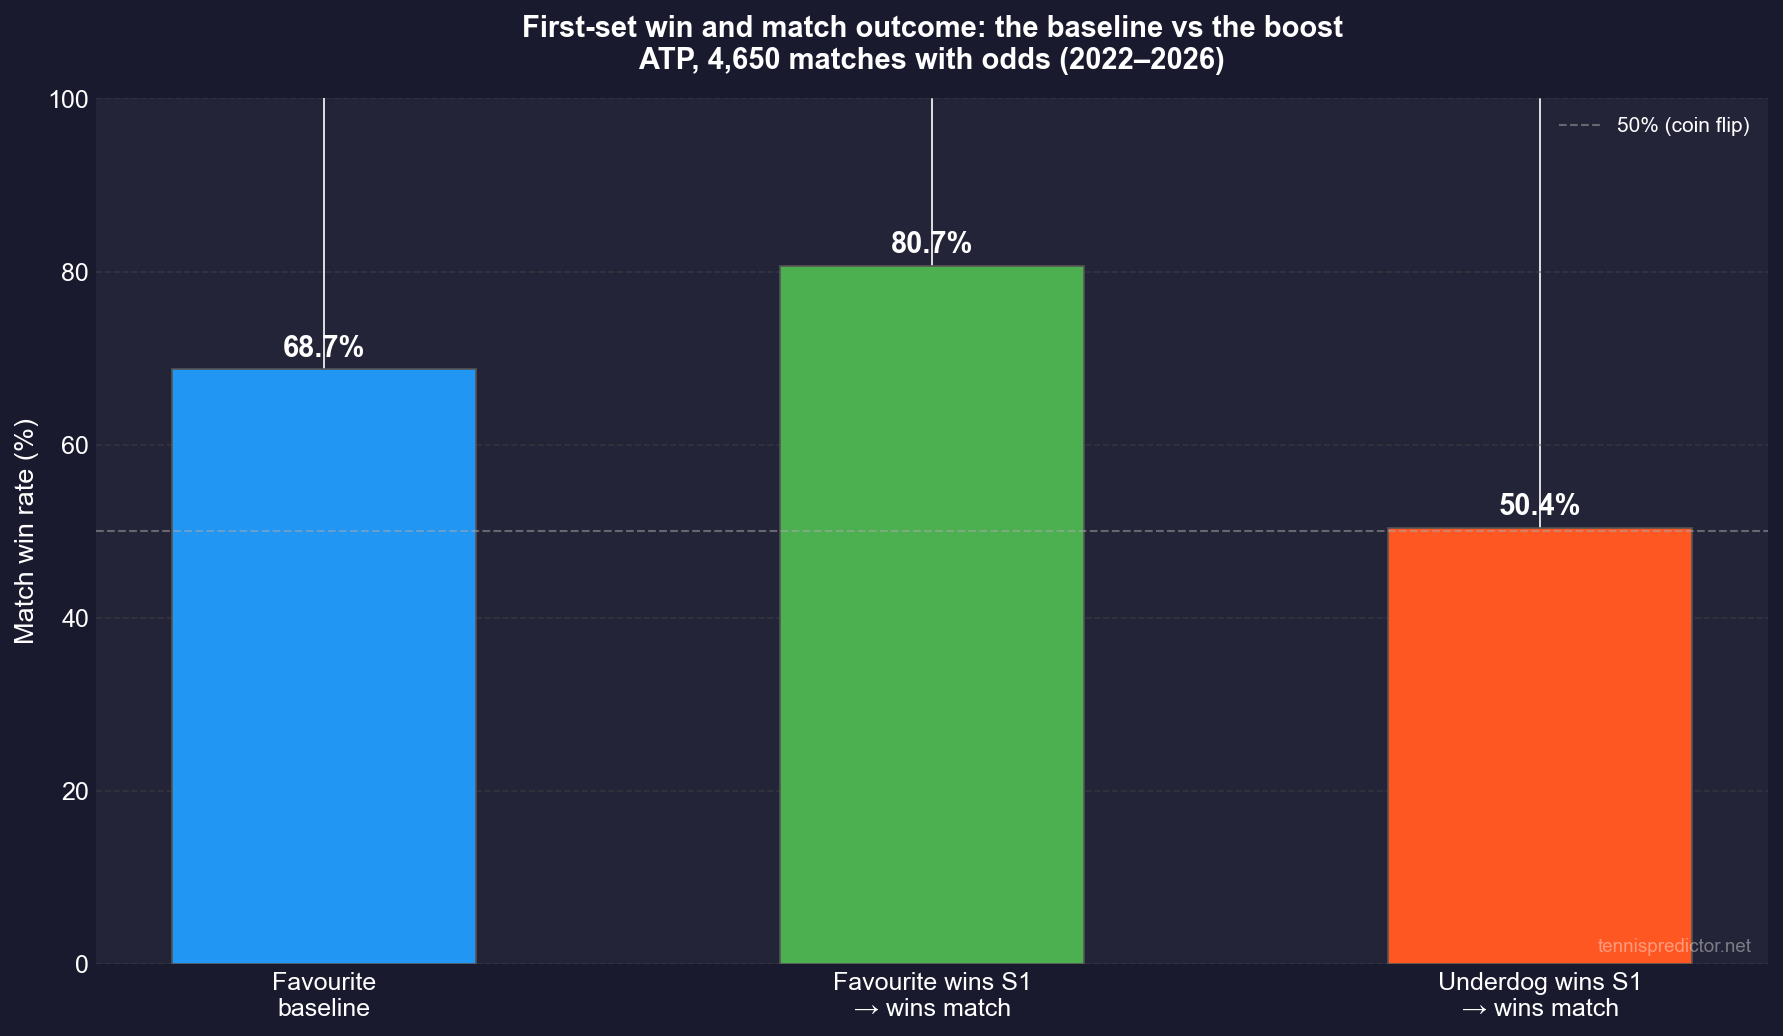
Figure 1: Favorite baseline win rate vs close-out rate after winning set 1, and the underdog close-out rate after winning set 1.
The set-one boost: 68.7% → 80.7%
When the favorite wins the first set, their match win probability jumps to 80.7%. That is a +12 percentage-point lift over their unconditional baseline.
| Scenario | Match win rate |
|---|---|
| Favorite wins match (no conditions) | 68.7% |
| Favorite wins set 1 → wins match | 80.7% |
| Underdog wins set 1 → wins match | 50.4% |
The underdog figure is the most surprising number in the table. An underdog who wins the first set closes the match just 50.4% of the time — barely above a coin flip. That asymmetry is not obvious from watching tennis. It means bookmakers are roughly right to be cautious about underdog set-one leads; the favorite retains meaningful equity even after losing an opener.
How to read the 80.7% correctly: it is not a point-level or game-level guarantee inside the second set. It is the fraction of matches, in this ATP sample, where a favorite who took set one also took the match. Some of those matches ended in quick straights; others went to a tight decider. The statistic describes historical frequency, not a live-model output.
Odds strength matters more than you might expect
Not all favorites are equal. A player priced at 1.10 is a very different risk profile from one priced at 1.80 — and the data shows clearly that set-one close-out rates track pre-match odds strength closely.
| Favorite's pre-match odds | Won set 1 (n) | Won match | Close-out % |
|---|---|---|---|
| Heavy favorite (< 1.30) | 962 | 881 | 91.6% |
| Clear favorite (1.30–1.60) | 1,059 | 842 | 79.5% |
| Mild favorite (1.60–1.90) | 736 | 513 | 69.7% |
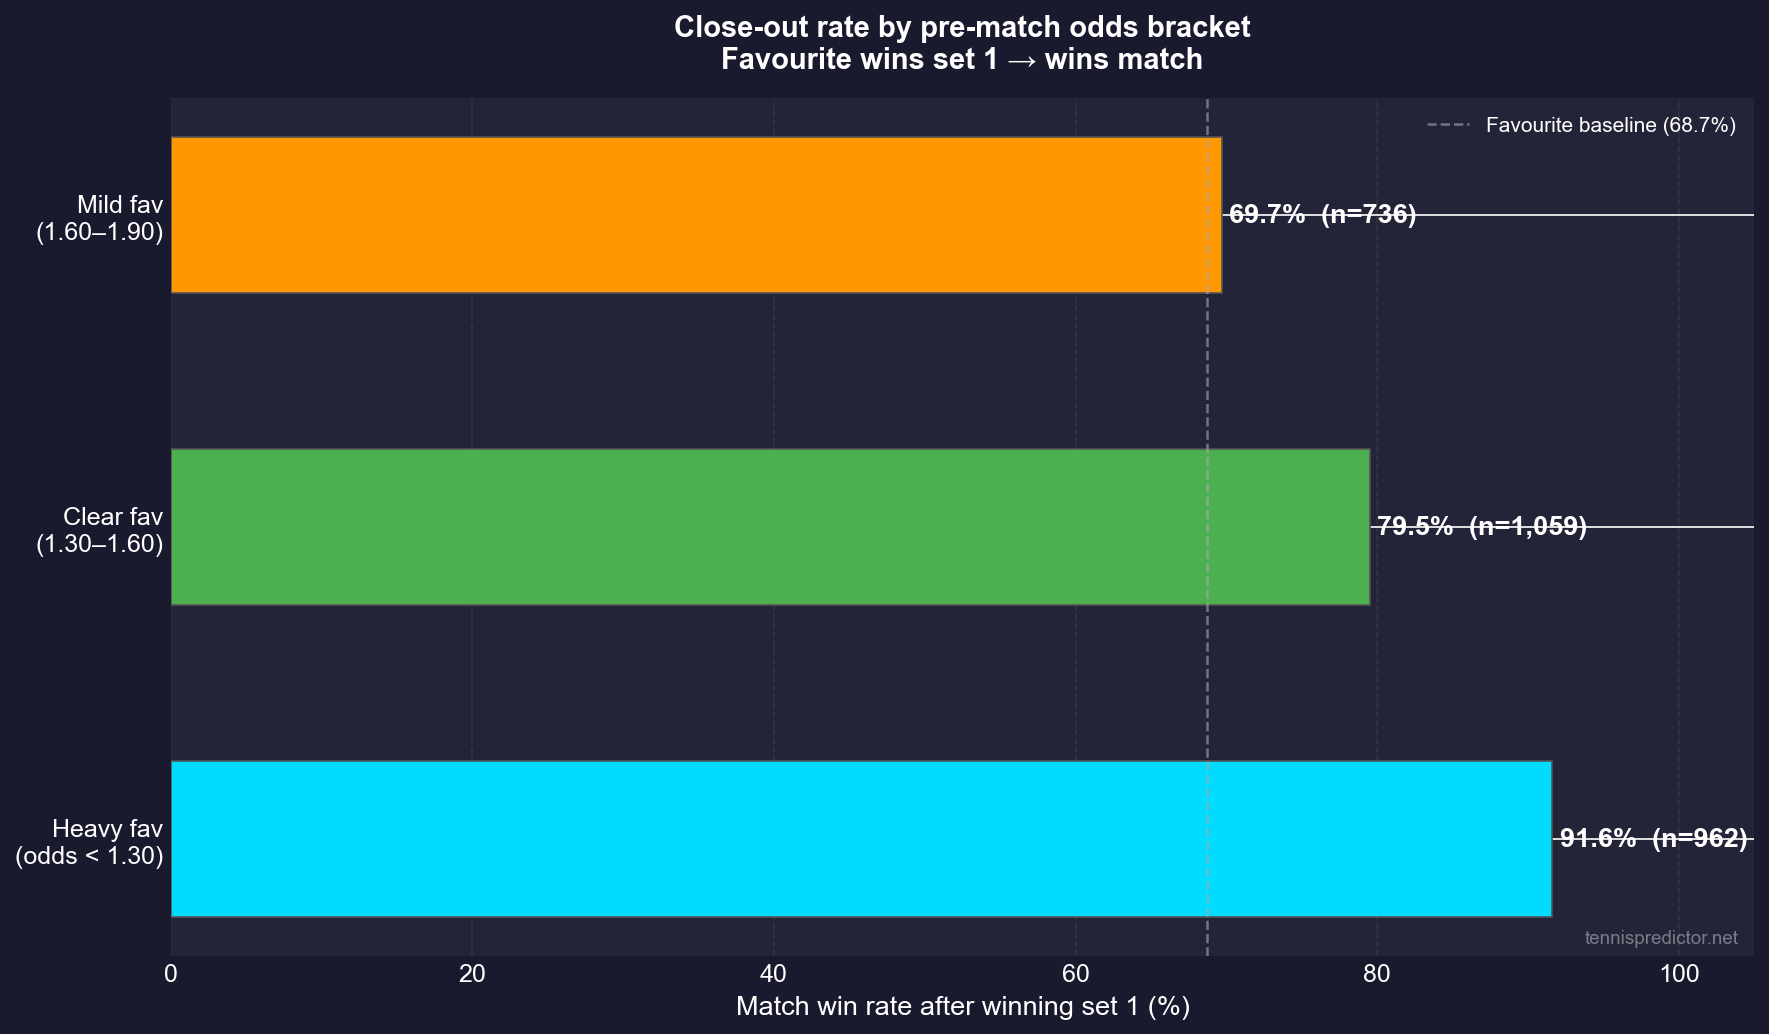
Figure 2: Match win rate for favorites who won set 1, segmented by pre-match odds bracket.
The range is striking: from 91.6% for heavy favorites to 69.7% for mild ones. That 22 percentage-point spread explains a great deal about live-market mispricing after set one.
Heavy favorites (< 1.30): when a heavy favorite wins the first set, there is very little match variance left. The opponent was already priced as a heavy underdog, and the set-one loss compounds their deficit. A live price on the heavy favorite after set one should be very short — yet in-play markets sometimes drift these prices more than the statistical reality supports if the underdog put up a competitive set (e.g. a 7–5 or 7–6 opener).
Clear favorites (1.30–1.60): this is the busiest range in the dataset (n=1,059) and the most relevant for normal tour tennis. The 79.5% close-out rate is close to the overall average, but "close" is not "identical" — a 3–4 percentage-point deviation still translates to meaningful expected value across a large volume of bets.
Mild favorites (1.60–1.90): at 69.7%, the mild favorite who wins set one is only marginally better than their own pre-match unconditional win rate. The match is genuinely open after one set. Live markets should reflect that — and often they do, which is why this is not automatically an edge, but a calibration check.
Surface splits: grass is the outlier
Pooling all matches into a single close-out rate hides real variation by surface. Clay, hard, indoor hard, and grass each produce meaningfully different numbers.
| Surface | Fav baseline | Fav wins S1 | Fav S1 → match | Udog S1 → match |
|---|---|---|---|---|
| Hard (indoor) | 71.0% | 58.7% | 83.9% | 47.3% |
| Clay | 68.9% | 62.4% | 81.1% | 51.2% |
| Hard (outdoor) | 68.1% | 61.3% | 80.6% | 51.7% |
| Grass | 68.8% | 60.0% | 78.4% | 45.6% |
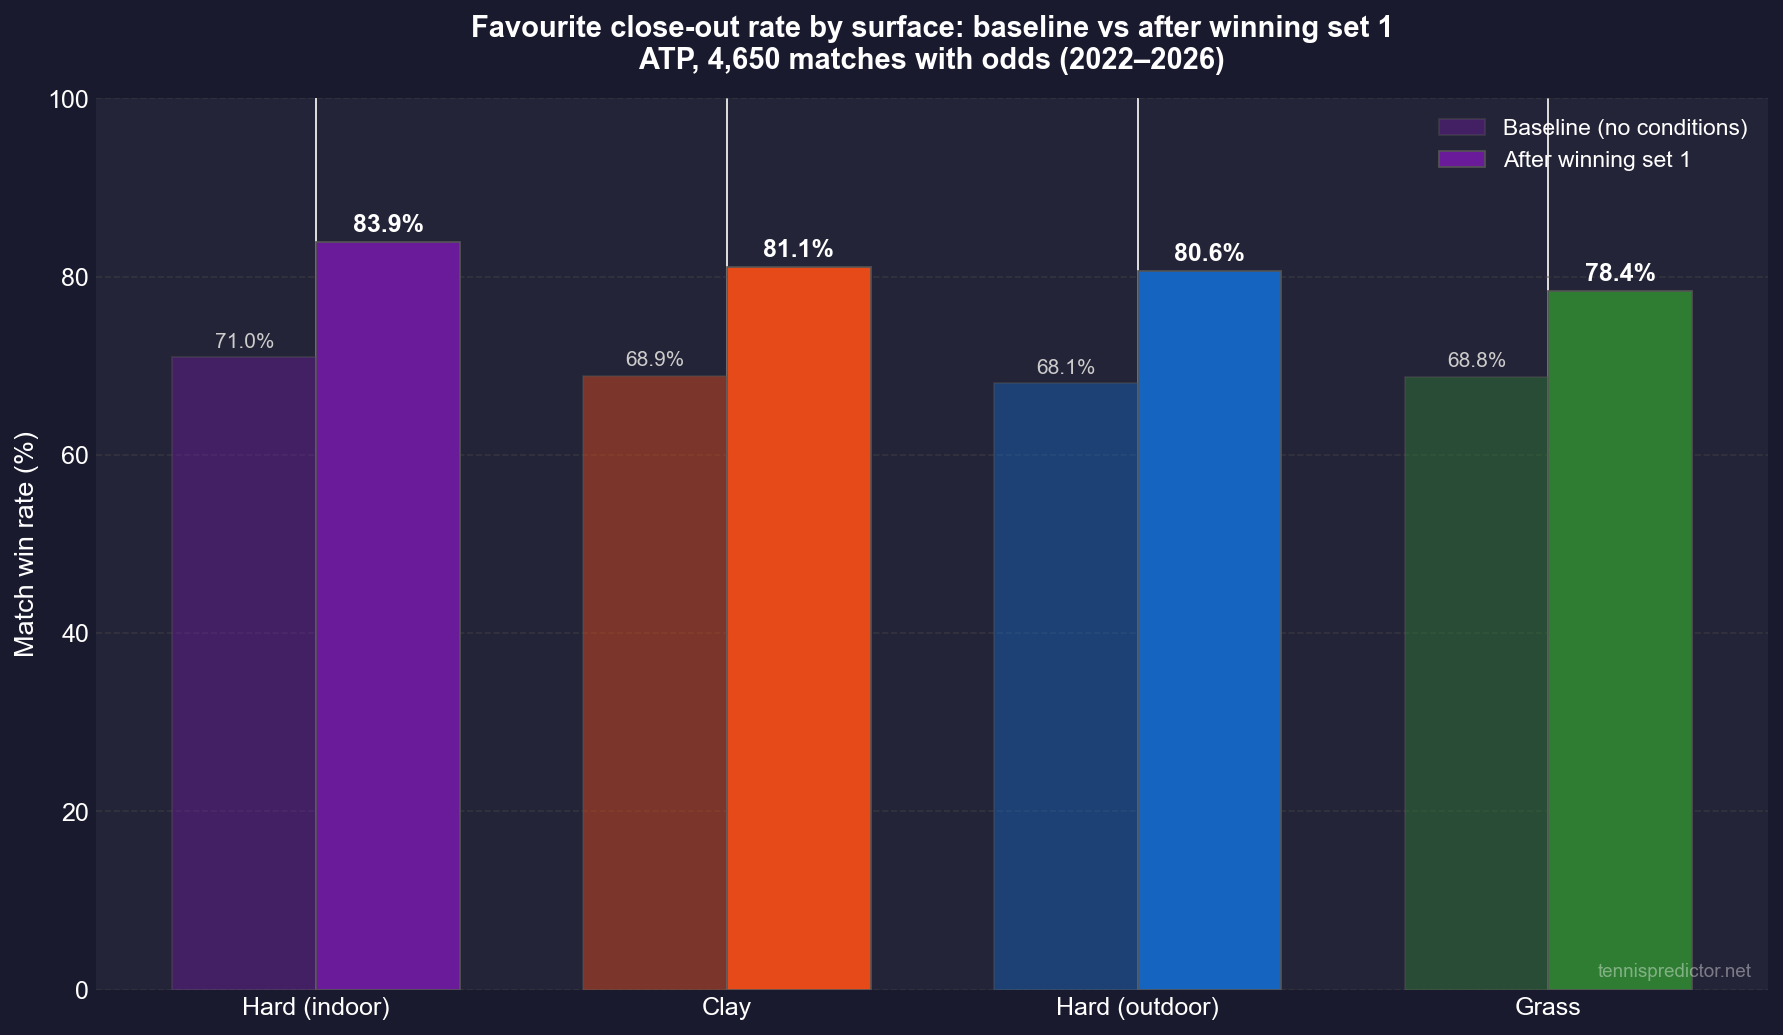
Figure 3: Favorite close-out rate after winning set 1, broken down by surface.
Grass: the most volatile surface after set one
Grass produces the lowest favorite close-out rate at 78.4%. The underdog's close-out rate after winning set one is also the lowest — just 45.6% — which means both players struggle to bank leads on grass more than on any other surface.
This makes structural sense. Grass is the most serve-dominated surface, which means a single break of serve can swing any set quickly regardless of who won the previous one. Opponents can reset mentally between sets faster because the format punishes tactical adjustment less; if you can hold serve, you are never out of a set. The result is more variance in scorelines even conditional on who took the opener.
For live betting this means: do not price a grass-court favorite as if they are on a hard court. The same 80-point pre-match odds that implies a 91% hard-court close-out rate implies only an 87% close-out rate on grass (see the matrix section below).
Indoor hard: the most predictable surface
Indoor hard shows the highest favorite close-out rate at 83.9%, and the underdog's post-set-one win rate drops to 47.3% (below 50%). Conditions are controlled — no wind, no sun, predictable bounce — which reduces variance and lets the better player's game quality assert itself over multiple sets.
Clay: reliable but not infallible
Clay's 81.1% close-out rate sits just above the overall average. Conventional wisdom might expect clay to be even higher — the surface rewards physical endurance and rewards the better player over long rallies. And indeed, among heavy favorites, clay is close to indoor hard at 92.3%. But for mild favorites (1.60–1.90 odds), clay actually produces the highest close-out rate of any surface (73.0%) relative to that bracket. We explore that in the combined matrix below.
The combined view: surface × odds matrix
Combining surface and odds bracket produces the most granular baseline available for live-market calibration. Each cell shows the favorite's close-out rate conditional on having won set one, for a specific surface and odds bracket.
| Surface | Heavy fav (< 1.30) | Clear fav (1.30–1.60) | Mild fav (1.60–1.90) |
|---|---|---|---|
| Hard (indoor) | 94.3% (n=53) | 85.0% (n=80) | 70.2% (n=47) |
| Clay | 92.3% (n=284) | 79.7% (n=385) | 73.0% (n=270) |
| Hard (outdoor) | 92.0% (n=501) | 79.4% (n=466) | 66.3% (n=315) |
| Grass | 87.1% (n=124) | 75.8% (n=128) | 71.2% (n=104) |
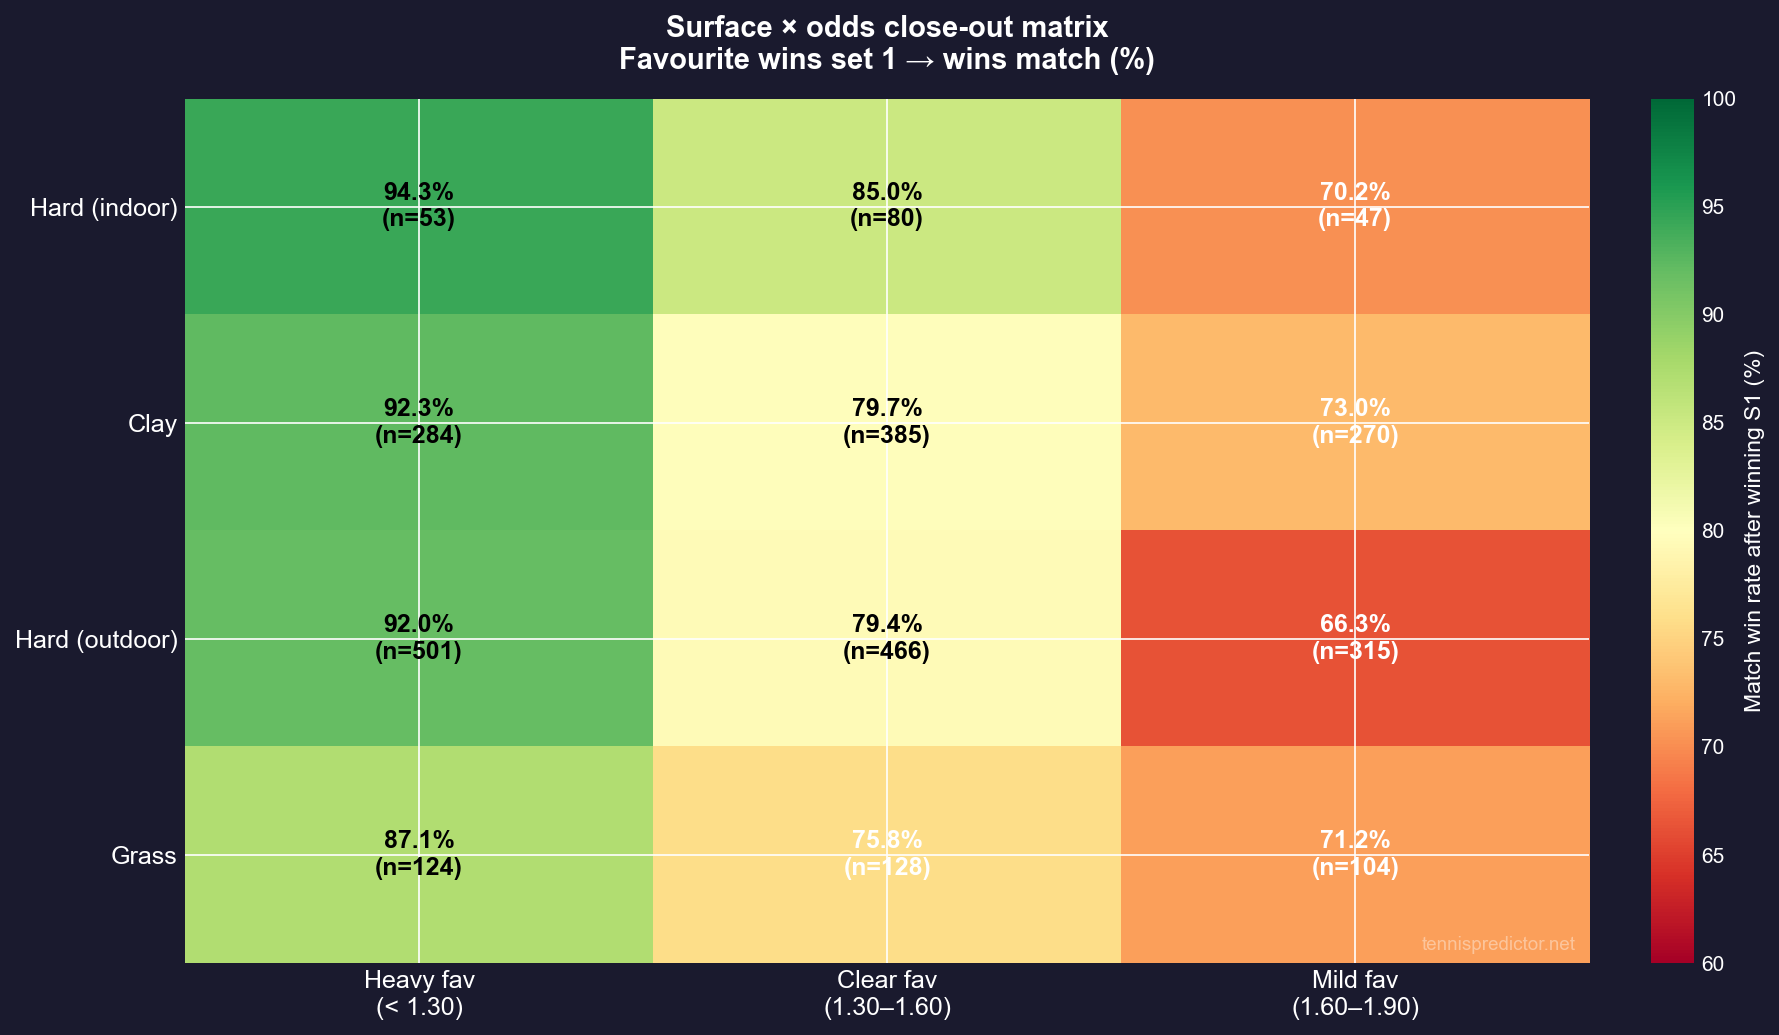
Figure 4: Heatmap of favorite close-out rates by surface and odds bracket (after winning set 1).
Reading the matrix
Top-left corner (indoor hard, heavy fav: 94.3%): when a player priced below 1.30 wins the first set indoors, the match is essentially decided. A live counter-bet on the underdog at this point needs a very attractive price to be rational.
Bottom-right corner (outdoor hard, mild fav: 66.3%): this is the most volatile cell in the matrix. A mild outdoor-hard-court favorite who wins set one still loses more than one in three matches. The live market will likely have already shortened their price after set one — if it has shortened too aggressively, the underdog may offer value.
Grass outlier at 1.30–1.60 (75.8%): grass clear-favorites are roughly 3–4 percentage points lower than the equivalent clay or hard figure. For a bettor who holds a pre-match favorite ticket and is considering hedging after set one, the lower grass conversion rate means less certainty that the hedge is unnecessary.
Clay mild favorite (73.0%) vs outdoor hard mild favorite (66.3%): the 6.7-point gap between these cells is one of the more actionable findings in the matrix. On clay, even mild favorites who win the first set have a meaningfully higher close-out rate than the same odds tier on hard courts. One interpretation: clay rewards consistent baseline endurance, which tends to persist across sets, more reliably than hard courts do.
The set-one boost by surface
Another way to look at this data is through the boost lens: how much does winning set one add to a favorite's match win probability beyond their pre-match baseline?
| Surface | Fav baseline | Fav S1 → match | Boost |
|---|---|---|---|
| Hard (indoor) | 71.0% | 83.9% | +12.9 pp |
| Clay | 68.9% | 81.1% | +12.2 pp |
| Hard (outdoor) | 68.1% | 80.6% | +12.5 pp |
| Grass | 68.8% | 78.4% | +9.6 pp |
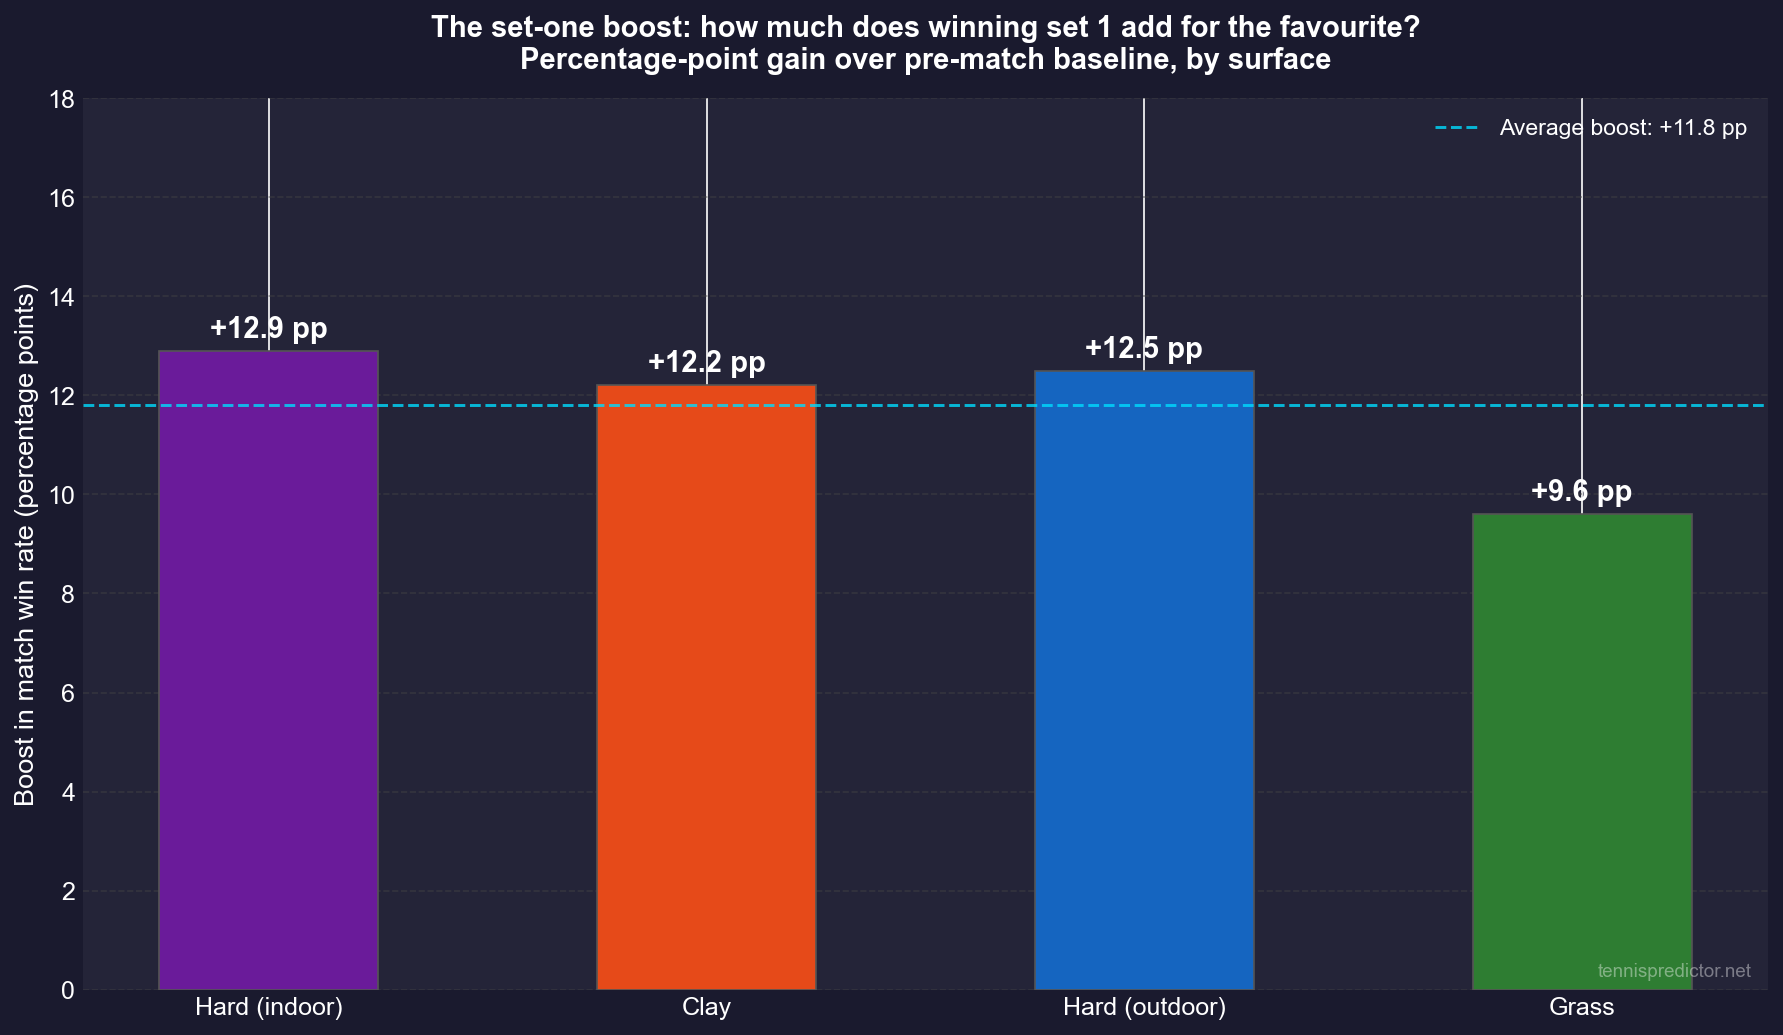
Figure 5: The percentage-point boost in match win probability for favorites who win set 1, by surface.
The boost is remarkably stable across clay, hard, and indoor — all within a 0.7-point range around +12.5 pp. Grass is the clear outlier at just +9.6 pp, reinforcing the structural volatility finding from the surface splits section.
For a practical frame: on any surface except grass, winning the first set as a favorite adds roughly 12–13 percentage points to your match win probability. On grass, the informational value of the first set is materially lower.
Why the underdog's 50.4% matters
The underdog's close-out rate after winning set one deserves its own discussion. 50.4% overall — effectively a coin flip — might seem to argue that the first set is irrelevant for underdogs. But the surface breakdown reveals important nuance:
| Surface | Udog S1 → match |
|---|---|
| Hard (outdoor) | 51.7% |
| Clay | 51.2% |
| Hard (indoor) | 47.3% |
| Grass | 45.6% |
On grass and indoor hard, an underdog who wins set one actually loses the match more than half the time — 54.4% and 52.7% respectively. The favorite's ability to reassert game quality after an opening-set loss is strongest in these controlled, serve-dominated environments.
On outdoor hard and clay, the underdog's close-out rate edges just above 50%, meaning a first-set win is genuinely meaningful information — but only marginally. The market tends to overreact to underdog set-one wins by shortening their price more aggressively than these close-out rates justify.
Practical implication: if you hold a pre-match favorite position and your player loses the first set, the statistical argument for hedging is weak on outdoor hard and clay (the favorite still wins roughly half the remaining matches from that position). On grass, the argument for a partial hedge is somewhat stronger given the lower set-one informational value.
Grand Slam matches: a different animal
Grand Slams are best-of-five and draw the strongest fields on the calendar. Both factors widen the gap between favourites and underdogs once the first set is decided. Across 1,068 Grand Slam matches with available odds in our database:
| Tournament | Matches | Fav baseline | Fav S1 → match | Udog S1 → match | Fav wins decider (if needed) |
|---|---|---|---|---|---|
| Australian Open | 308 | 67.9% | 81.6% | 50.0% | 83.5% (n=115) |
| French Open | 252 | 77.4% | 84.0% | 34.8% | 82.8% (n=116) |
| Wimbledon | 254 | 76.4% | 82.2% | 32.4% | 84.8% (n=99) |
| US Open | 254 | 71.7% | 86.4% | 54.3% | 90.4% (n=114) |
| All Grand Slams | 1,068 | 73.0% | 83.6% | 43.4% | 85.4% (n=444) |
| Non-Slam ATP | 3,582 | 67.4% | 79.9% | 52.5% | — |
Several findings stand out.
The Slam premium is real but not massive. The overall Slam close-out rate (83.6%) is +3.7 percentage points above the non-Slam ATP figure (79.9%). That gap is consistent with the best-of-five format giving the superior player more time to assert quality — and with the stronger field at majors meaning the favourites are genuinely more dominant.
Underdogs struggle severely after winning set one at Slams. The underdog close-out rate falls to just 43.4% at majors — nearly 10 points below the non-Slam rate of 52.5%. At Wimbledon (32.4%) and the French Open (34.8%) in particular, an underdog who wins set one is still a significant underdog to win the match. Best-of-five gives the favourite more opportunities to recover; clay and grass both amplify the baseline quality of the better player over a long match.
The US Open is the most decisive. A US Open favourite who wins set one closes the match 86.4% of the time — the highest of the four majors. More strikingly, if that match still reaches a fifth set, the favourite wins 90.4% of those deciders. The hard-court surface, the conditions at Flushing Meadows, and the tournament's historically lower upset rate (confirmed in our Grand Slam betting guide) all contribute.
When the decider arrives at a Slam, it is even more lopsided than at tour level. Favourites win 85.4% of deciding sets at Grand Slams when they had won the opener — versus 69.9% across the full ATP sample. The best-of-five format concentrates variance across more sets, meaning a dominant favourite who wins the first set has already demonstrated control in a longer-format match. Losing set two does not erase that signal.
For live betting at majors: the broader calibration remains the same as on tour, but all the directional signals are amplified. A Slam favourite who wins set one warrants less hedging than the equivalent tour situation. An underdog who wins set one at Wimbledon or Roland Garros should be priced cautiously — the historical close-out rate is closer to one in three than one in two.
Connecting this to the broader set-by-set picture
This analysis uses pre-match odds to identify the favorite, which is methodologically different from the population-level first-set statistics in our companion articles. The first set wins article reports a 69.1% carry-through rate for whoever wins the first set — regardless of whether they were the pre-match favorite or underdog. Our 80.7% is higher because it conditions on the winner being the favorite: it excludes the many cases where an underdog wins the opener (who, as we now know, only converts 50.4% of the time).
Similarly, the decisive set statistics article reports that 42.35% of matches reach a deciding set. That figure is unconditional — it includes both favorites and underdogs winning the first set. Within our sample, when a favorite wins set one, a far smaller fraction of those matches reaches a deciding third or fifth set, because the favorite's 80.7% close-out rate implies a large straight-sets component.
The two analyses complement each other:
- Use the first set article to reason about who is likely to win set one before the match starts.
- Use the decisive set article to reason about total sets markets.
- Use this article to reason about live match pricing after set one has been completed.
When the deciding set still comes
Winning the first set does not always end the match in two sets — even for the favourite. About 40.3% of matches where the favourite wins set one still reach a deciding third or fifth set. That figure is remarkably close to the overall tour-wide deciding-set rate of ~42%, which tells you that winning the opener does not dramatically reduce the chance of going the distance.
What changes dramatically is who wins the deciding set when it arrives.
| Scenario | Goes to decider | Favourite wins decider | Underdog wins decider |
|---|---|---|---|
| Favourite wins set 1 | 40.3% (1,150/2,851) | 69.9% (804/1,150) | 30.1% |
| Underdog wins set 1 | 48.5% (873/1,799) | 59.7% (521/873) | 40.3% |
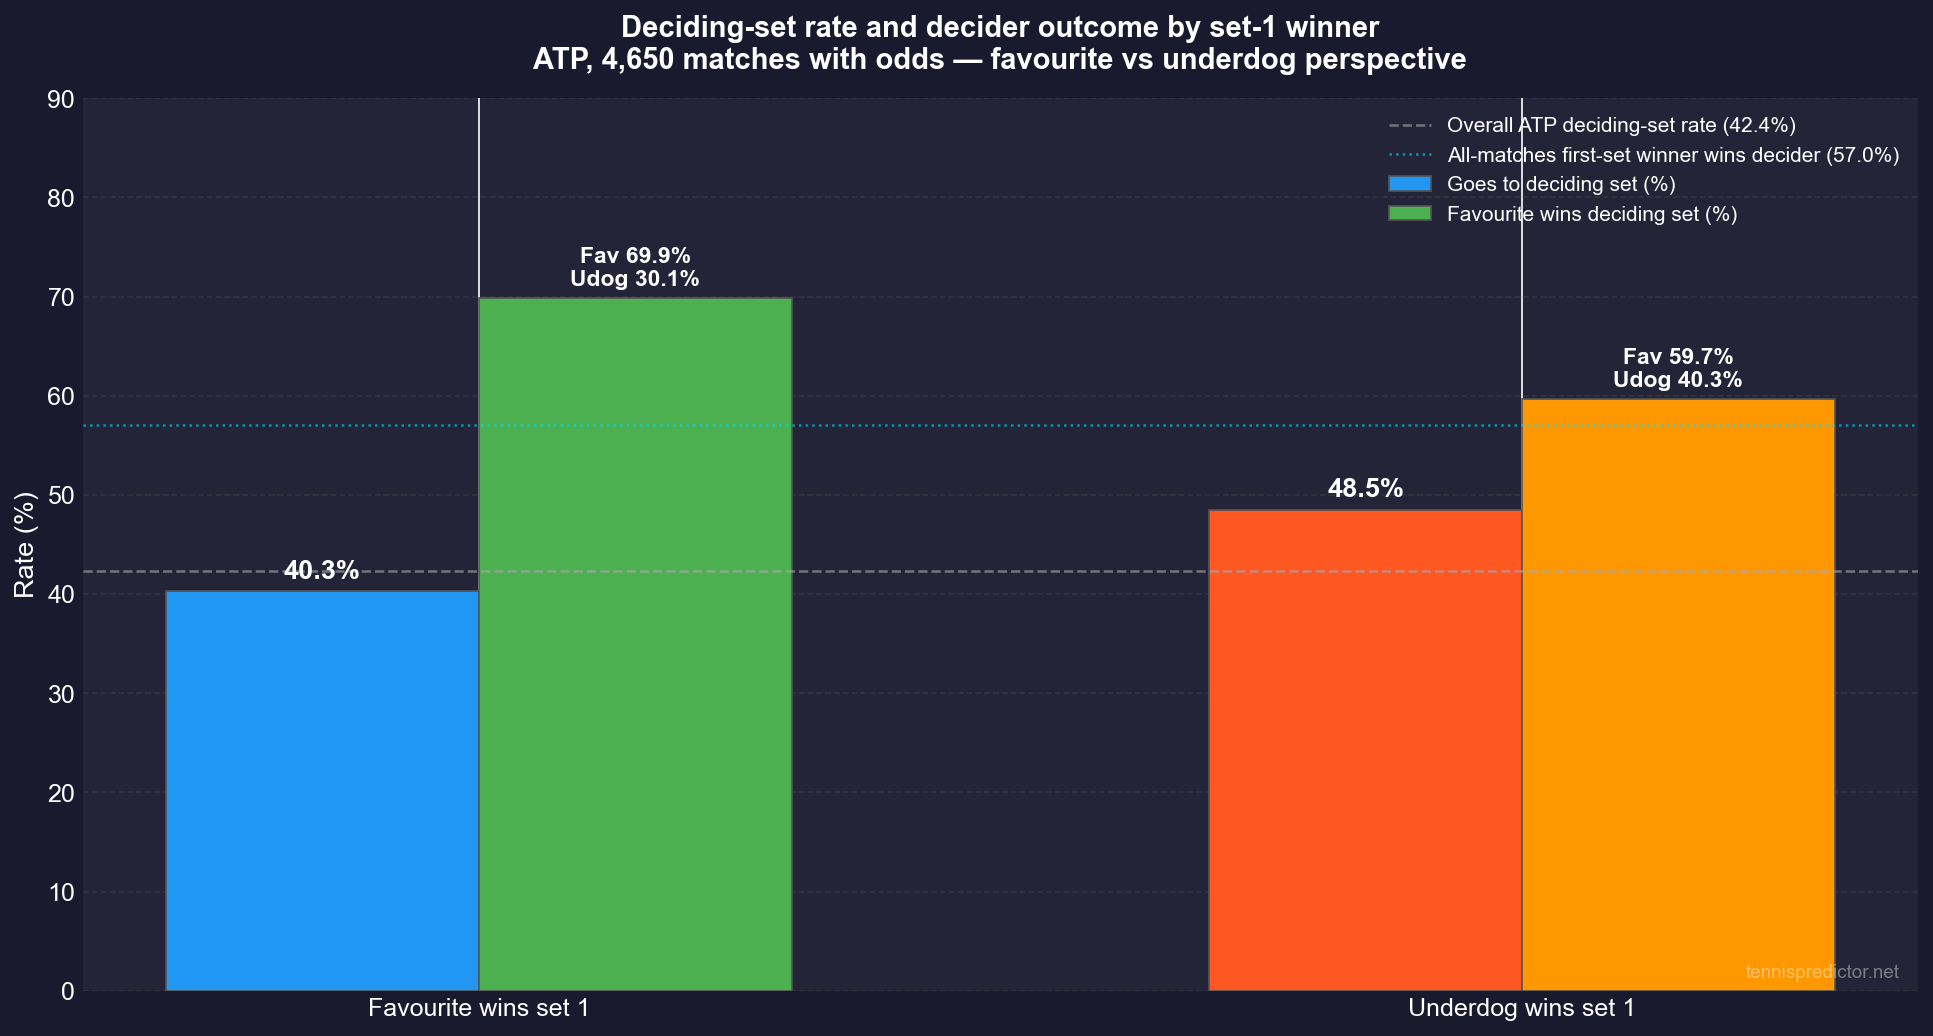
Figure 6: How often each set-1 outcome leads to a deciding set, and who wins that decider.
The favourite who needs a decider still wins it 70% of the time
When the favourite wins set one but the opponent fights back to force a third (or fifth) set, the favourite's market quality reasserts itself. They win those deciders 69.9% of the time — a high rate that reflects the underlying talent gap that made them favourites in the first place. Only 30.1% of those deciders produce the upset.
This is a useful anchor for live betting. A match priced at, say, 1.50 for the favourite before the match, where the favourite wins set one but loses set two, should not swing wildly in the underdog's direction just because the decider has arrived. The favourite is still expected to win that third set roughly 70% of the time.
The underdog who can't close in two loses the decider 60% of the time
The most counter-intuitive finding in this table: an underdog who wins set one but cannot close the match in straight sets — meaning the favourite won set two — goes on to lose the deciding set 59.7% of the time.
Put differently: if an underdog wins set one but the favourite is strong enough to win set two and force a decider, the favourite has already demonstrated resilience under pressure and tends to take the match from there. The underdog's first-set win is "banked" but no longer decisive once the favourite has levelled.
The contrast with the 50.4% overall underdog close-out rate is instructive. That figure averages across all matches where the underdog won set one — including the 51.5% where they closed immediately in straight sets. Condition only on matches that reach the deciding set after an underdog set-1 win, and the underdog wins just 40.3% of those deciders.
How this connects to the decisive-set baseline
The decisive set article reports that across all ATP matches, the first-set winner wins 57.0% of deciding-set matches. Our odds-conditioned data adds a sharper layer:
- When the favourite won set one and a decider is needed: 69.9% (the first-set winner is also the favourite)
- When the underdog won set one and a decider is needed: the first-set winner (underdog) wins only 40.3% — well below the 57% baseline
The 57% population figure is an average that masks this asymmetry. Knowing whether the set-one winner was the pre-match favourite or underdog meaningfully shifts the conditional probability in the deciding set.
A practical checklist for live betting after set one
Before you act on any live price after set one:
Step 1 — Identify the surface and odds bracket. Pull up the article's matrix. If the favorite (1.45 pre-match) just won set one on clay, your historical anchor is 79.7%. If the same scenario plays out on outdoor hard, it is 79.4%. On grass, 75.8%.
Step 2 — Compare to the live price. Convert the live offered price on the favorite to an implied probability. If it reflects 85% (≈ 1.18), the market has overpriced the favorite relative to the 79.7% anchor — and you may have an argument for a counter-position. If it reflects 75% (≈ 1.33), the market has underpriced them relative to the historical base.
Step 3 — Apply match-specific adjustments. The matrix is a population prior. Today's specific match may differ because of:
- Physical state: did the favorite look laboured in set one, or did they cruise?
- Schedule: is one player on two hours' rest while the other had a day off?
- Head-to-head pattern: does the opponent historically raise their level in the second set against this particular player?
- Score within set one: a 6–1 first set is not the same as a 7–6(5) first set, even if both produce the same "favorite wins set one" outcome.
Step 4 — Size appropriately. Even the highest-confidence cell in the matrix (indoor hard, heavy fav: 94.3%) implies a 5.7% miss rate. Volatility in live markets can be extreme. Use the matrix as a calibration tool, not as a certainty machine. For a broader discussion of bankroll discipline around live events, see our guide on common tennis betting mistakes.
Step 5 — Confirm you are not chasing steam. After a major first-set result, liquidity concentrates in the live market and prices move fast. If the market has already moved well past the historical anchor by the time you see the price, the opportunity has likely closed.
When this analysis applies and when it does not
This analysis is built on ATP main-draw matches from 2022–2026 seasons. It does not apply directly to:
- WTA matches: serve dynamics, physical endurance profiles, and set-one momentum differ between tours.
- Challenger or ITF matches: the player quality range is wider; heavy favorites may be far more dominant than ATP heavy favorites, and the close-out rates could be systematically higher.
- Best-of-five matches at Grand Slams: the dynamic of winning set one in a five-set format is different from best-of-three. Our Grand Slam rows in this dataset are primarily from rounds where best-of-three is not the format; the decisive set article specifically addresses five-set dynamics.
- Retirements and walkovers: matches that did not complete cleanly are excluded from this dataset. If you are trading a match where one player appears physically compromised, these base rates do not capture that risk.
For surface splits, the Indoor Hard bucket has the smallest sample at n=317 total qualifying matches (n=53 for heavy fav, n=80 for clear fav, n=47 for mild fav). The directional reading is robust, but individual cell percentages for indoor hard carry wider uncertainty than the clay and outdoor hard figures.
Limitations
No Challenger or WTA data. The odds-equipped match cache used here covers ATP main-draw events. Expanding to lower tiers or the women's tour would require separate extraction and validation.
Surface metadata at tournament level. Surface is recorded in the tournament-level JSON block, not at the per-match level. If a multi-surface tournament reported a single surface incorrectly, all its matches would inherit the error. We have no evidence this affects more than a small number of rows.
Odds source. Pre-match odds come from the single odds field stored in our tournament cache. We do not know whether this represents opening odds, closing odds, or an aggregated market. Closing odds would theoretically be the sharpest proxy for true match probability; if the cached odds are pre-movement, heavy-favorite close-out rates could be slightly overstated (some "heavy favorites" at market open may have drifted toward the field by kick-off).
Year range. The 2022–2026 window covers four full seasons plus early 2026. Generation-level player changes — a new dominant champion, a crop of big-serving juniors hitting the tour — can shift these rates gradually. We recommend treating these figures as priors for the current era rather than permanent constants.
Frequently asked questions
1. Does 80.7% mean I should always back the favorite after they win set one?
No. 80.7% is a historical frequency. The practical question is whether the live price on the favorite reflects a true probability below 80.7%. If the market already prices them at 85–90%, backing them has negative expected value relative to this historical anchor. Compare the anchor to the live implied probability, then decide.
2. Why is the underdog's close-out rate so low (50.4%) if they just won a set?
Winning the first set is meaningful information, but the favorite still has superior baseline quality — that is why they were the favourite before the match. The 50.4% figure reflects a balancing of those two factors: the informational boost from the set win versus the underlying match-quality gap. On surfaces where quality differentials assert themselves most persistently (indoor hard, grass), the underdog's close-out rate is below 50%.
3. Why is grass the most volatile surface for close-out rates?
Grass is the most serve-dominated surface on the ATP Tour. High first-serve percentages mean any player, regardless of ranking, can hold serve comfortably for stretches. That reduces the ability of the superior player to convert quality into breaks, which introduces more variance between sets. A player who loses set one on grass can regain control quickly if their serve is clicking — more so than on clay or hard courts where baseline quality is a stronger leveller.
4. How is this different from the "first set wins" article?
The first set wins article reports the population frequency for whoever wins set one — both favorites and underdogs — to win the match (69.1%). This article conditions on the winner being the pre-match favorite (80.7%) or underdog (50.4%), using market odds as the separator. The two figures measure related but different things.
5. Does the 12-point set-one boost apply to Grand Slams?
Our sample is predominantly best-of-three ATP matches. Grand Slam best-of-five matches are included where they appear in the tournament cache, but five-set dynamics differ from three-set dynamics. The decisive set article shows that Grand Slam first-set conversion rates are specifically 69.09% when conditioning on a deciding set being played. For a Grand Slam-specific live betting framework, start with that article.
6. What counts as a "mild favorite" in this dataset?
We define mild favorite as a player whose pre-match decimal odds fall in the 1.60–1.90 range. This corresponds roughly to an implied win probability of 53–63%. In practical match terms, this is a matchup where both players are competitive but one player is consistently preferred by the market — think a top-20 player vs a top-40 player in the second round of a Masters 1000.
7. Can I use this for the "over 2.5 sets" market?
Indirectly, yes. An 80.7% favorite close-out rate after winning set one implies a high proportion of straight-set completions within that bracket — which means fewer three-set matches in the favorite-wins-S1 population. However, the "over 2.5 sets" market is priced before set one is played, not after. The relevant prior for that market is the unconditional deciding-set rate (~42% across ATP matches); see the decisive set article for that analysis.
Related reading
These articles use overlapping data but answer different questions. Used together, they cover the pre-match, in-play, and set-level angles for betting on ATP tennis.
- First set wins: the most undervalued betting market? — population-level first-set carry rates (69.1%), score-shape breakdown, and Grand Slam vs tour splits.
- The decisive set: third set & fifth set statistics that matter for bettors — how often matches go to a deciding set and who wins when they do.
- Clay court betting guide: how to win during Roland Garros season — surface-specific strategy for clay season with tournament comparison data.
- Common tennis betting mistakes (and how to avoid them) — bankroll, discipline, and the most frequent errors live bettors make.
For today's pre-match probabilities, check the live predictions dashboard.


