Does tournament environment change favourite win rates?
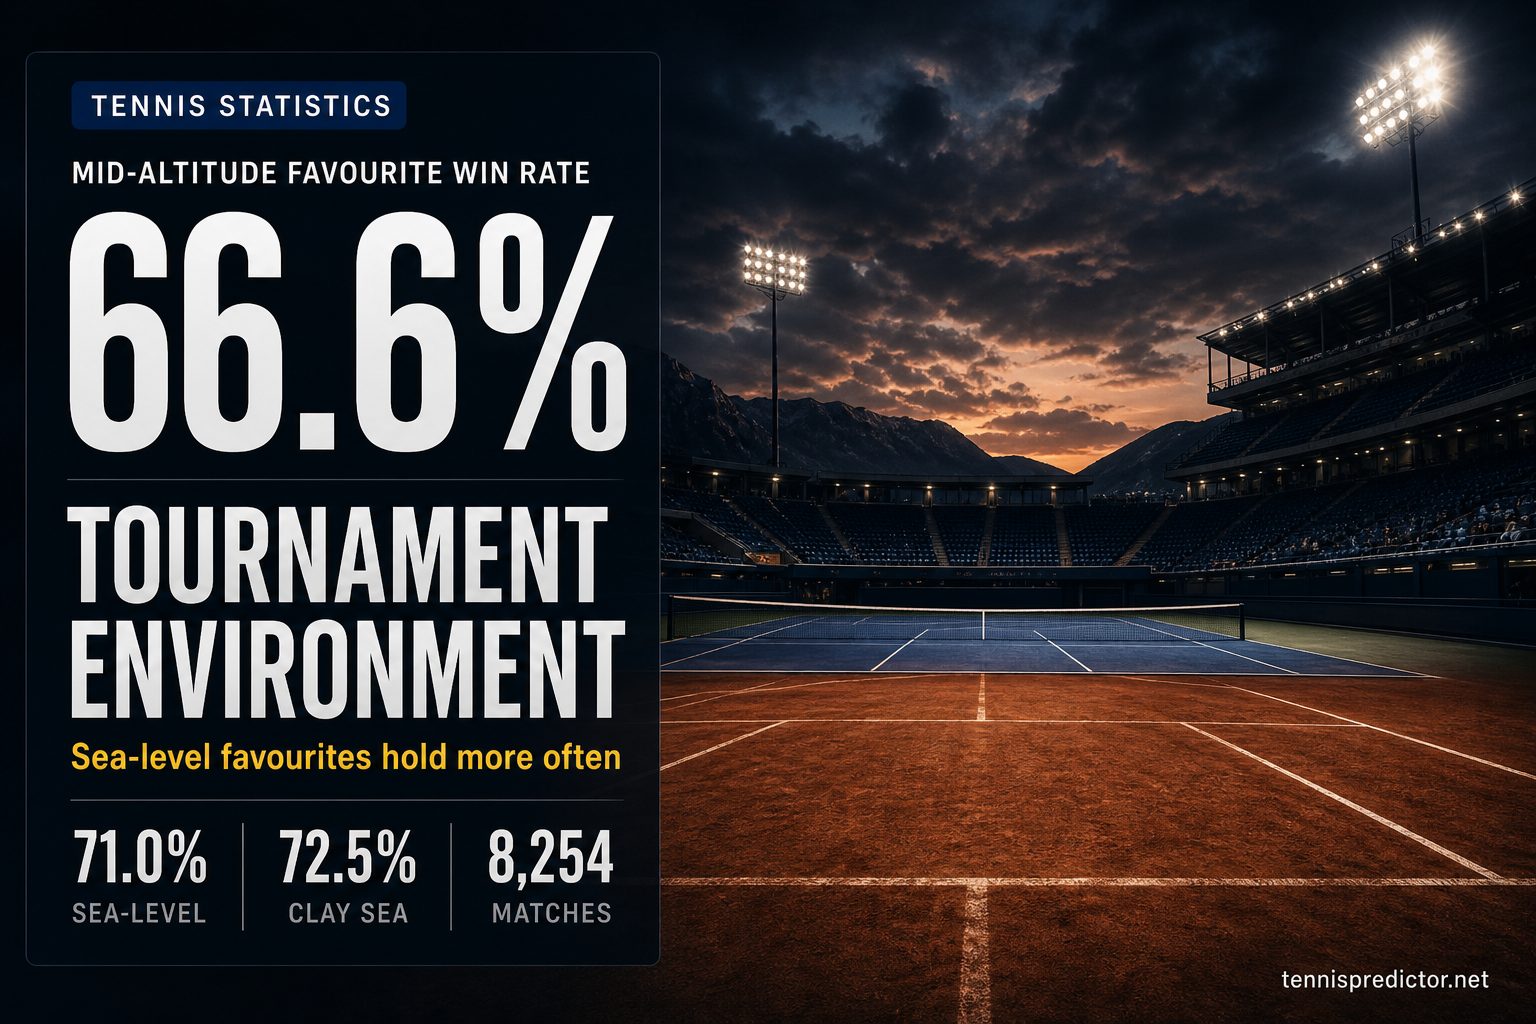
Favourites win most ATP matches. That is not news. What is less obvious is whether the place—how high the court sits, how humid the month usually is, whether the roof is closed—shifts how often those favourites actually close.
We joined 8,254 ATP matches with bookmaker odds (2022–2025) to a curated venue table (altitude, region, indoor/outdoor) and to monthly climate normals for outdoor sites: average temperature and relative humidity for the calendar month of the match at that latitude/longitude. Across the full sample, favourites won 70.3% of matches (5,804 / 8,254; 95% Wilson interval 69.3–71.3%). The environment cuts that matter are not “Asia vs Europe” in the aggregate. They are altitude on clay and, on outdoor hard, humid mild months vs mid-humidity mild months.
This is descriptive association, not a causal claim that thin air causes upsets. It is also not match-day weather: we use multi-year monthly normals, not the thermometer on the afternoon of the match. Indoor events are kept as their own bin for climate cuts.
Published: July 30, 2026
How we measured environment
Every match in this study has a tournament name, a date, a surface, two decimal odds lines, and a winner. We drop rows without usable odds. The favourite is the player with the lower decimal price.
We map each tournament name to a venue record with approximate elevation in metres, region, and whether the event is typically indoor. For outdoor venues we attach climate normals for the match’s calendar month: mean 2 m temperature and mean relative humidity from a multi-year archive window (2010–2019), aggregated by month. Venue join coverage is 8,254 / 8,260 matches with odds (99.9%); the six unmatched rows are non-tour league noise. Outdoor climate coverage is 7,353 / 7,353 (100%). Indoor matches (n = 901) are excluded from temperature and humidity bins.
Bins used throughout:
- Altitude: sea 0–200 m, mid 200–800 m, high 800 m+
- Temperature (monthly avg): cool <18°C, mild 18–26°C, hot >26°C
- Humidity (monthly avg): dry <55%, mid 55–70%, humid >70%
- Region: Europe, North America, Asia, South America, Oceania, Middle East
- Indoor vs outdoor (venue default or indoor surface label)
We report sample size n, favourite win rate, upset rate, and a Wilson 95% interval on every cut. Cells with n < 100 are flagged and treated as exploratory only.
If you care more about how markets behave once a set is decided, our first-set closeout analysis is the complementary view. Surface folklore—especially grass—has its own deep dive in the grass court specificity guide. Clay swing readers can cross-check tournament context in the clay court betting guide.
Why monthly normals instead of match-day weather
Day-level forecasts are noisy, incomplete in historical caches, and easy to overfit. A tournament’s typical May or September climate is stable: you can ask whether humid late-summer hard courts or mild Mediterranean spring clay months associate with favourite hold without scraping thousands of hourly archives. If normals show no signal, day-level weather is unlikely to be a first-order favourite-hold feature. If normals do show signal—as mid-altitude clay and mild+humid hard do here—then day-level weather becomes a candidate for a later study, not a requirement for v1.
Overall favourite baseline
Before slicing environment, sanity-check the market:
| Metric | Value |
|---|---|
| Matches with odds | 8,260 |
| Joined to venues | 8,254 |
| Favourite wins | 5,804 |
| Favourite WR | 70.3% |
| Upset rate | 29.7% |
| Wilson 95% | 69.3–71.3% |
Seventy percent is the tour’s “favourites usually win” rhythm with closing-style decimal odds in our cache. Every environment cut below should be read as a deviation from that baseline, not as a standalone probability of winning a random match. When a cut moves favourite hold by three to six percentage points on a sample of hundreds or thousands of matches, that is the scale of signal we care about—large enough to notice in research, small enough that bankroll rules still matter more than any single environmental story.
Altitude bands: mid-elevation is the soft spot
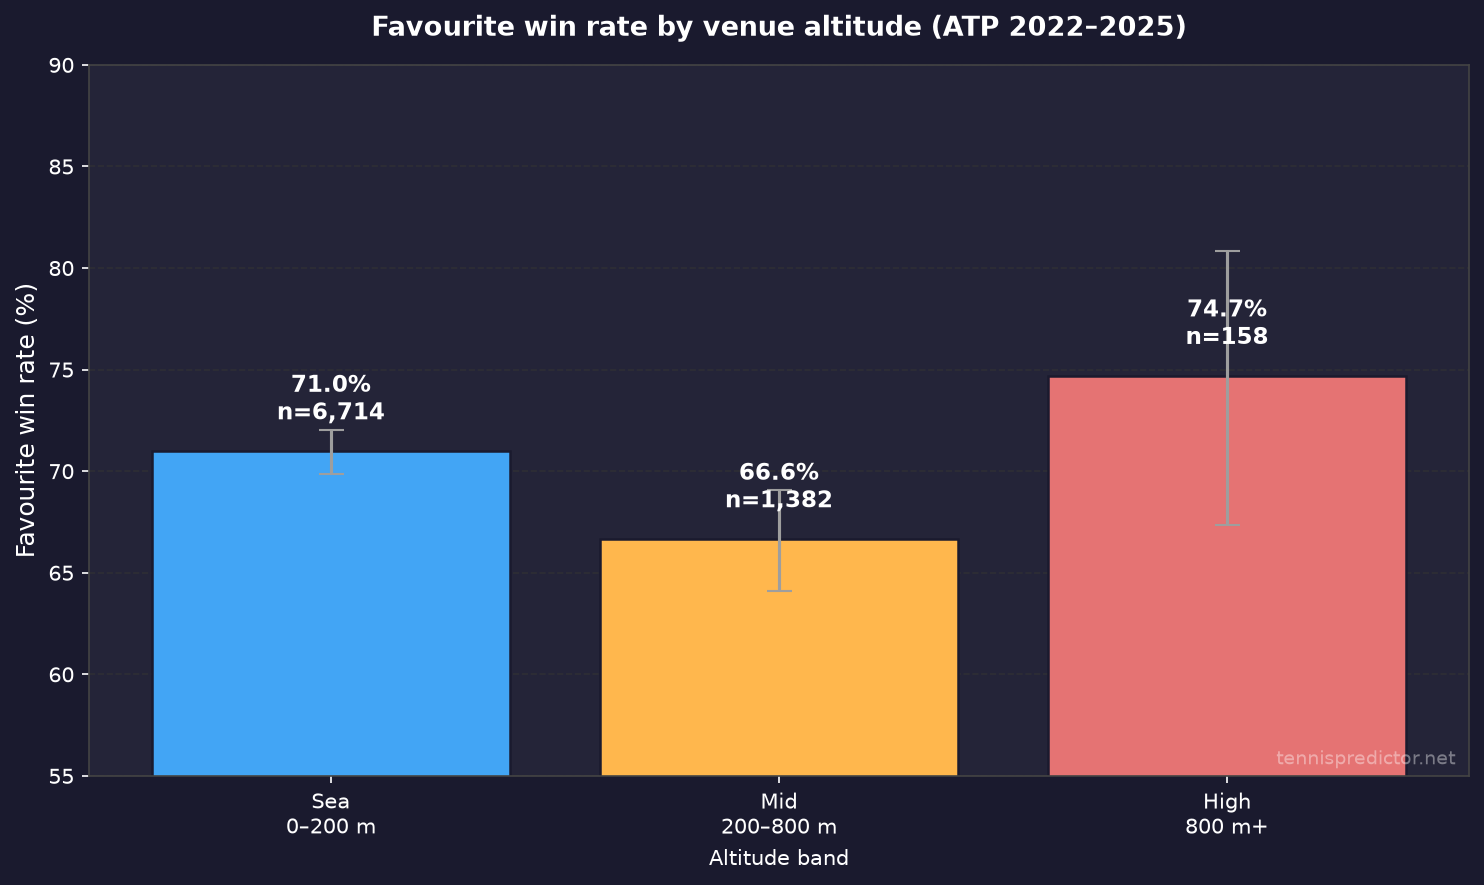 Figure 1: Favourite win rate by altitude band, ATP 2022–2025, matches with odds. Error bars are Wilson 95% intervals.
Favourite win rate by altitude:
| Altitude band | Matches | Favourite WR | Upset rate | Wilson 95% |
|---|---|---|---|---|
| Sea 0–200 m | 6,714 | 71.0% | 29.0% | 69.9–72.0% |
| Mid 200–800 m | 1,382 | 66.6% | 33.4% | 64.1–69.1% |
| High 800 m+ | 158 | 74.7% | 25.3% | 67.4–80.8% |
Sea-level venues dominate the calendar, so the 71.0% baseline is the tour’s everyday rhythm. Mid-altitude venues sit 4.4 percentage points lower at 66.6% (n = 1,382). The Wilson intervals barely overlap the sea-level band, which is why this cut survives a first look.
The high-altitude band (74.7%, n = 158) looks more favourite-friendly, but the sample is thin and mixes indoor and outdoor events at the extremes. Treat the 800 m+ row as a pointer, not a policy.
What this does not prove:
- That every Madrid clay week is an automatic upset factory (Madrid sits in the mid band by elevation, but week-to-week field strength still dominates)
- That thin air alone explains the gap (player pools, event levels, and surface mix co-vary with altitude)
It does show that lumping all outdoor clay or all outdoor hard together hides a real altitude split in favourite hold rates.
Which venues sit where?
Elevation bands are approximate city/venue elevations, not court-by-court surveys. In plain language:
Sea (0–200 m) covers most of the calendar: Australian Open and Melbourne-week events, Miami, Indian Wells (low desert elevation in our table), Roland Garros, Rome, Monte Carlo, Wimbledon and the London grass swing, US Open, Shanghai, and the bulk of European summer clay near the coast.
Mid (200–800 m) is where the soft favourite-hold signal lives. Think Madrid-class clay elevation, Munich, parts of the South American clay swing inland, and other inland European stops. These weeks still feature strong favourites—but historically those favourites have closed less often than at sea-level clay.
High (800 m+) is a small bag: Gstaad-scale outdoor clay and a handful of indoor stops at elevation. Sample sizes collapse quickly, which is why we refuse to let the high band drive the story.
The important discipline is not memorising every city’s metres above sea level. It is noticing when a clay week sits inland and elevated versus when it sits near sea level—and checking whether the market favourite’s price already embeds that week’s usual chaos.
Clay × altitude: the main finding
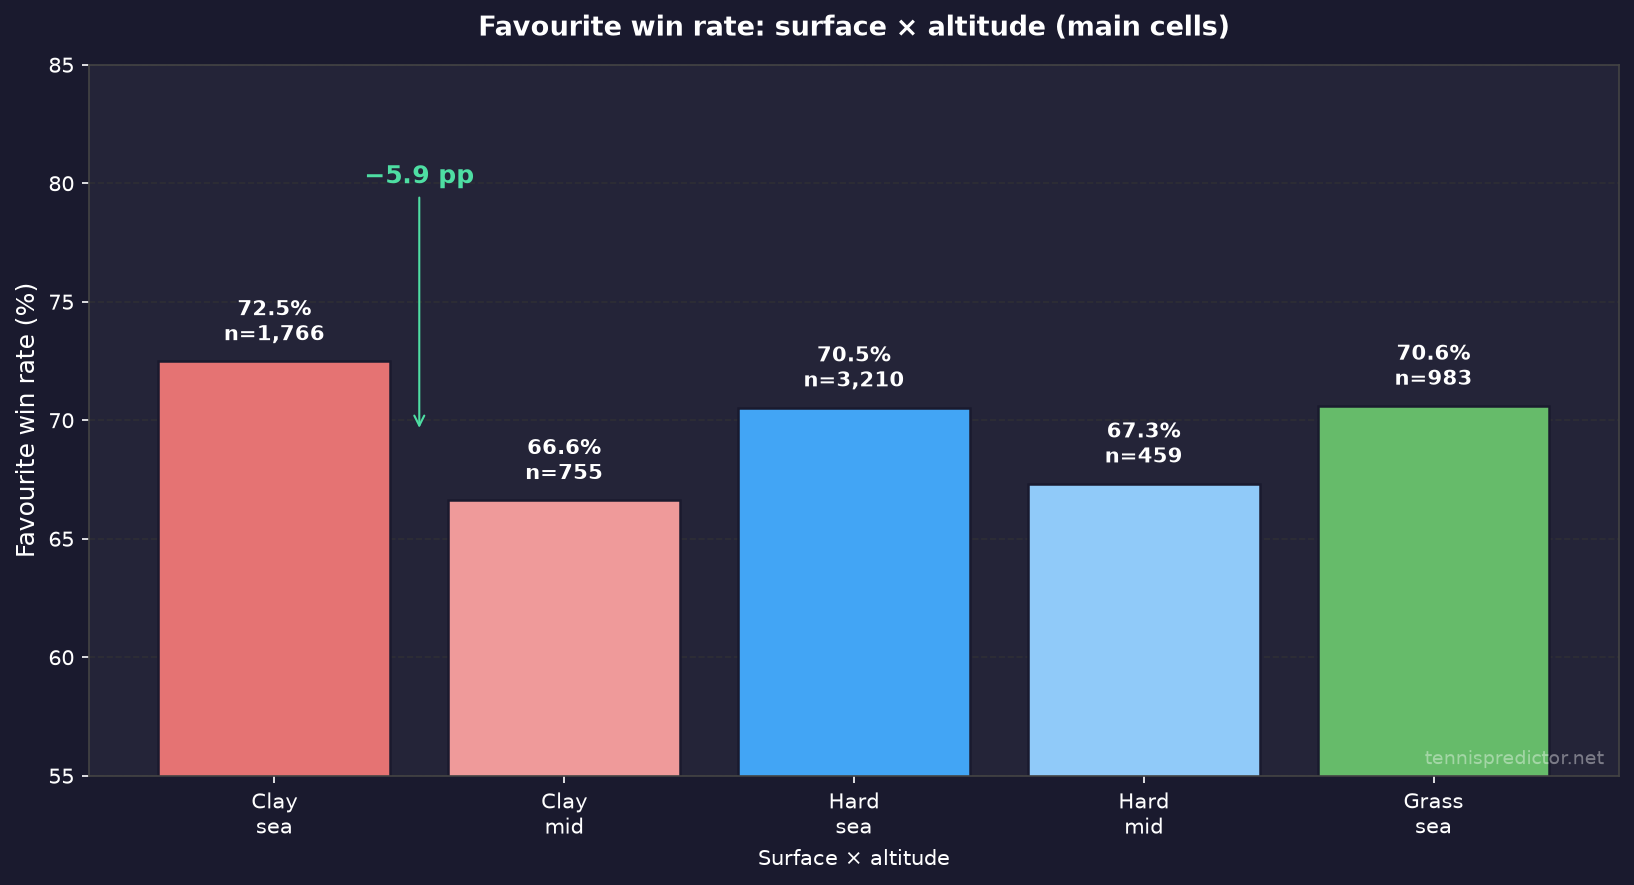 Figure 2: Surface × altitude favourite win rates for the main cells. The clay sea vs clay mid gap is the headline.
When we cross surface with altitude, the mid-band soft spot concentrates on clay:
| Cell | Matches | Favourite WR | Upset rate |
|---|---|---|---|
| Clay · sea 0–200 m | 1,766 | 72.5% | 27.5% |
| Clay · mid 200–800 m | 755 | 66.6% | 33.4% |
| Hard · sea 0–200 m | 3,210 | 70.5% | 29.5% |
| Hard · mid 200–800 m | 459 | 67.3% | 32.7% |
| Grass · sea 0–200 m | 983 | 70.6% | 29.4% |
Sea-level clay favourites hold at 72.5%. Mid-altitude clay favourites hold at 66.6%—a 5.9 pp gap across hundreds of matches on each side. Hard courts move in the same direction (70.5% → 67.3%) but with a smaller sample at mid altitude (n = 459).
True high-altitude clay (Gstaad-scale events in the 800 m+ bucket) shows 73.1% favourite WR on only 93 matches—low n. Do not build a narrative on that cell alone. The robust story is mid-elevation clay versus coastal / low-elevation clay.
Key findings:
- Mid-altitude clay is where favourites bleed relative to sea-level clay
- Hard mid-altitude leans the same way but with wider uncertainty
- “High altitude clay chaos” is not supported in this sample once you demand n ≥ 100
For clay-season betting frames that start from surface rather than elevation, pair this section with the Roland Garros–oriented clay guide and remember elevation is an extra axis, not a replacement for form and matchup.
Priors we tested (and what held)
Before running the cuts, three priors showed up in tennis conversation:
-
High-altitude clay is chaos (Madrid / Gstaad / Mexico folklore).
Result: The robust clay gap is mid vs sea (66.6% vs 72.5%), not the tiny high-altitude clay cell (n = 93). Madrid-class elevation falls in the mid band in our bins. “High altitude” as a single slogan oversells a thin Gstaad-scale sample and undersells the mid band where most elevated clay actually lives. -
Hot + humid outdoor hard is softer for favourites (US Open / Cincinnati month normals).
Result: On outdoor hard, the well-sampled contrast is mild+humid (68.4%, n = 1,501) vs mild+mid humidity (72.0%, n = 1,421). Explicit hot×humid cells print high favourite rates but with n < 100—we do not promote them. -
Indoor favourites are more stable.
Result: Rejected at this cut. Indoor 69.4% vs outdoor 70.4%.
Those three answers are the spine of the article. Everything else is context.
Surface overall (for orientation)
Environment cuts should not be confused with raw surface favourite rates in the same sample:
| Surface | Matches | Favourite WR | Upset rate |
|---|---|---|---|
| Clay | 2,614 | 70.8% | 29.2% |
| Grass | 1,070 | 70.6% | 29.4% |
| Hard | 3,669 | 70.1% | 29.9% |
| Indoors | 901 | 69.4% | 30.6% |
Surfaces alone sit within about a point of each other. Altitude inside clay moves the needle more than switching from clay to hard at the tour aggregate. That is the point of crossing dimensions instead of stopping at surface labels.
Indoor vs outdoor: almost no gap
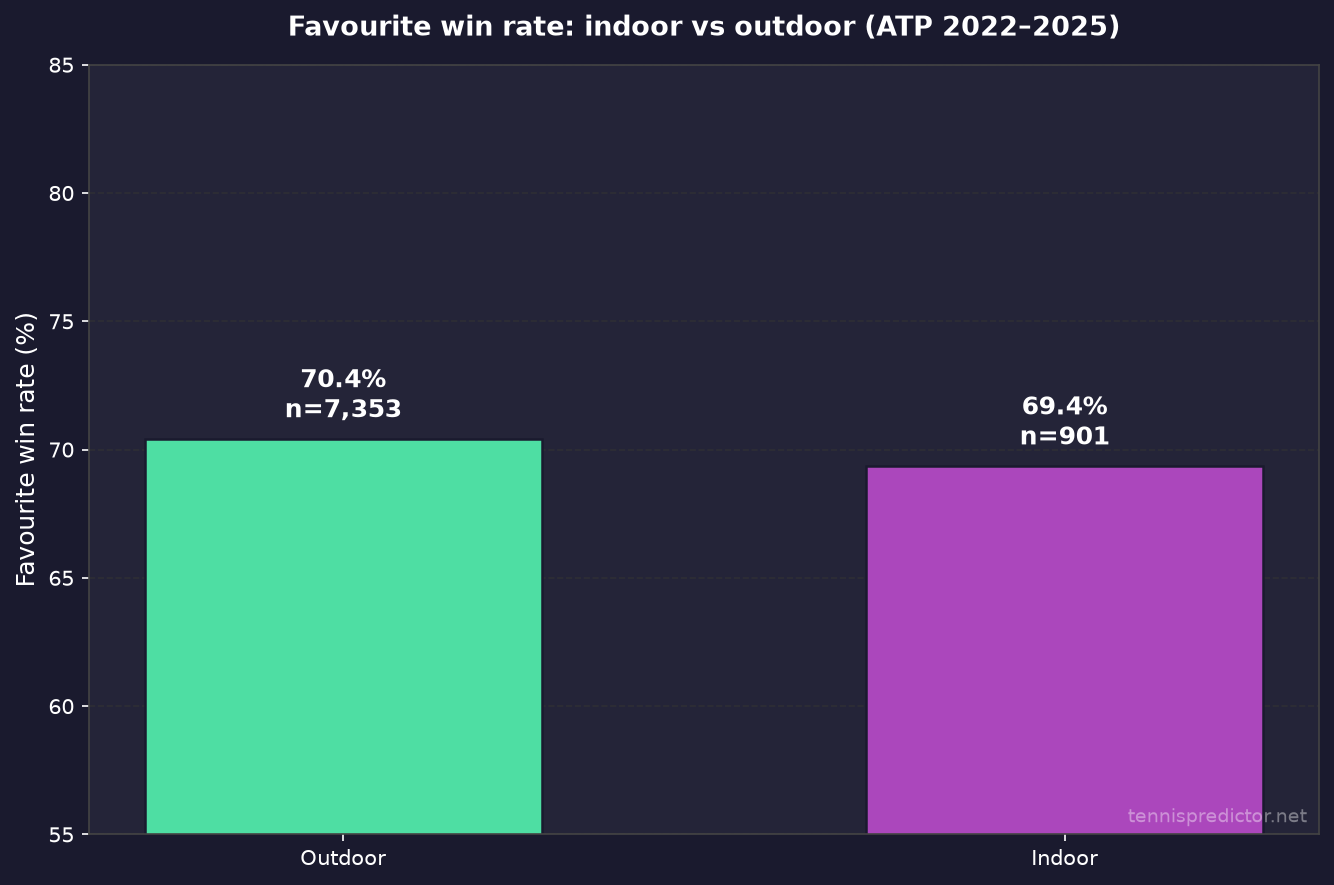 Figure 3: Indoor and outdoor favourite win rates are nearly identical.
Indoor vs outdoor favourite win rate:
| Setting | Matches | Favourite WR | Upset rate | Wilson 95% |
|---|---|---|---|---|
| Outdoor | 7,353 | 70.4% | 29.6% | 69.4–71.5% |
| Indoor | 901 | 69.4% | 30.6% | 66.3–72.3% |
A one-point gap with overlapping intervals is not a story. Controlled indoor conditions do not, in this sample, produce a meaningfully more favourite-stable market than outdoor tennis overall. If you expected indoor events to lock favourites in, the data does not back a large edge.
That does not mean serve-speed or bounce variance are identical indoors and outdoors. It means that once the market has set a favourite, the hold rate is statistically similar at this cut.
Indoor tennis still changes how matches play—shorter points on fast carpets or hard courts under a roof, different return positions, less wind. Markets appear to absorb much of that into the opening price. Favourite hold after the price is set does not jump. If you are hunting indoor edges, look at serve/return profiles and schedule congestion, not at a blanket “indoor favourites cash more often” rule. This sample does not support that rule.
Region: small spread, no clean hierarchy
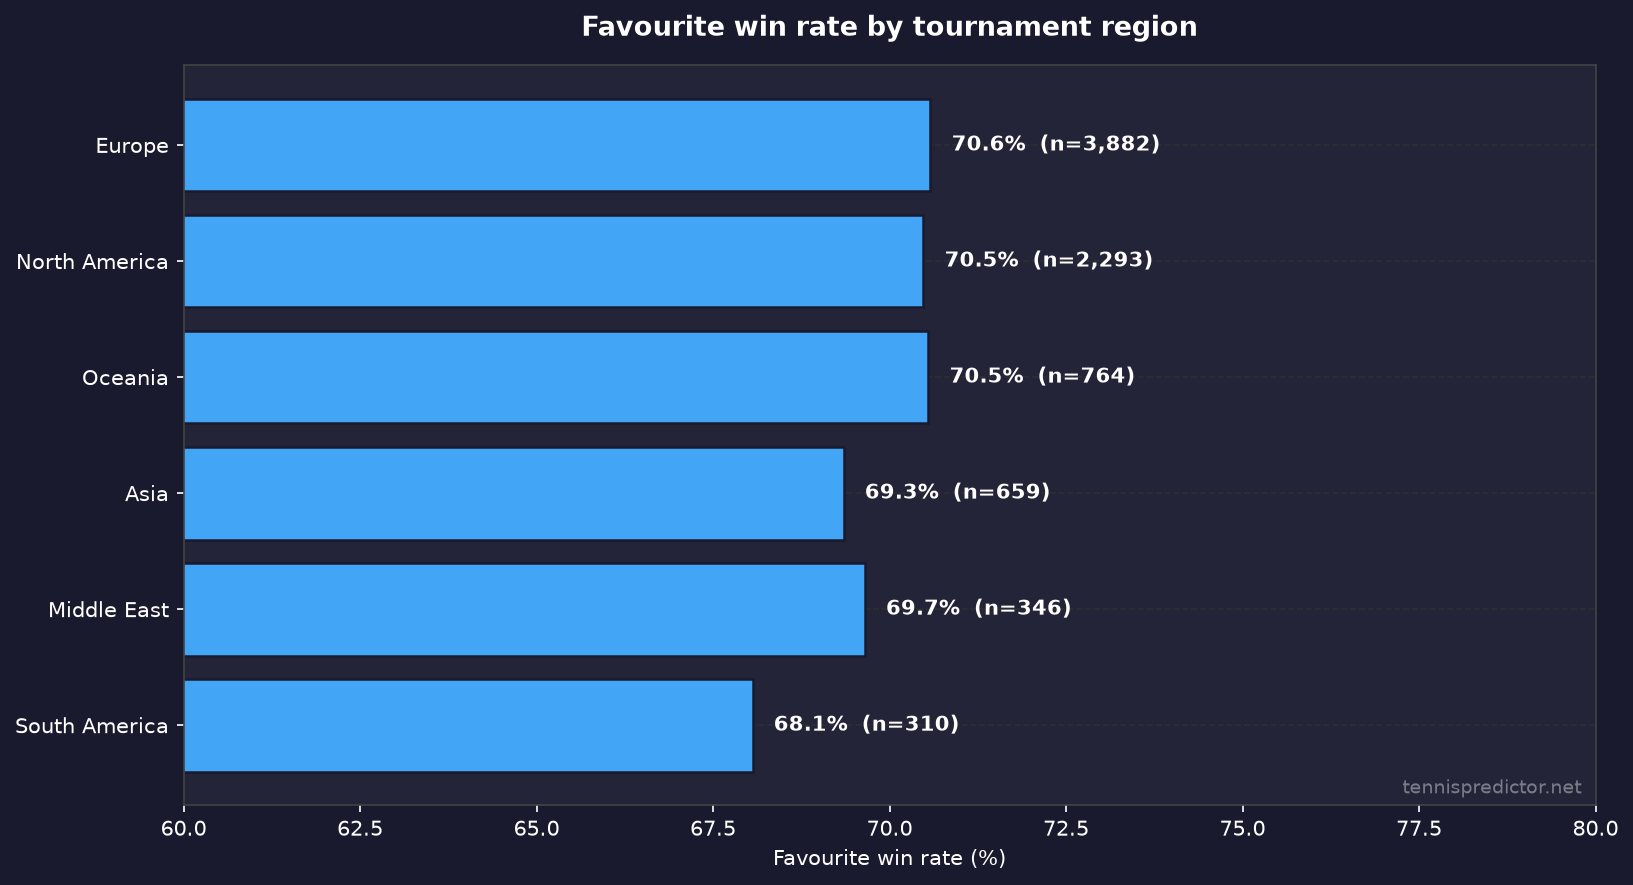 Figure 4: Favourite win rates by region. Europe and North America dominate the sample; all regions sit roughly 68–71%.
Favourite win rate by region:
| Region | Matches | Favourite WR | Upset rate |
|---|---|---|---|
| Europe | 3,882 | 70.6% | 29.4% |
| North America | 2,293 | 70.5% | 29.5% |
| Oceania | 764 | 70.5% | 29.4% |
| Asia | 659 | 69.3% | 30.6% |
| Middle East | 346 | 69.7% | 30.3% |
| South America | 310 | 68.1% | 31.9% |
The tour’s continental labels look dramatic on a calendar graphic and quiet in a favourite-hold table. Europe, North America, and Oceania sit on top of each other near 70.5–70.6%. Asia and the Middle East are within a point. South America is the softest at 68.1% (n = 310), still inside a range you would expect from sampling noise plus a clay-heavy slate.
Takeaway: region alone is a weak favourite-hold feature. If humidity or altitude matter, they matter through venue physics and calendar month—not through the passport stamp on the tournament poster.
Asia’s humid outdoor hard weeks and South America’s clay elevation mix are better analysed through the climate and altitude cuts above than through a single “Asia upset rate” number. The region table is useful mainly as a negative result: it tells you where not to invent a story.
Monthly temperature and humidity normals
Climate here means typical conditions for that venue in that month, not whether Tuesday was sticky. Indoor matches stay in an “indoor” climate bin and are not assigned outdoor normals.
Temperature bands (outdoor months)
| Temp band (monthly avg) | Matches | Favourite WR | Upset rate |
|---|---|---|---|
| Mild 18–26°C | 4,436 | 70.1% | 29.9% |
| Cool <18°C | 2,682 | 70.7% | 29.3% |
| Hot >26°C | 235 | 74.0% | 26.0% |
| Indoor (excluded) | 901 | 69.4% | 30.6% |
Mild and cool months are essentially tied. The hot band (74.0%) looks favourite-friendly but rests on only 235 matches—enough to notice, not enough to crown a heat rule.
Humidity bands (outdoor months)
| Humidity band (monthly avg) | Matches | Favourite WR | Upset rate |
|---|---|---|---|
| Humid >70% | 4,665 | 70.5% | 29.5% |
| Mid 55–70% | 2,044 | 70.8% | 29.2% |
| Dry <55% | 644 | 68.6% | 31.4% |
Aggregate humidity alone barely moves the needle. The interesting cut appears when we restrict to outdoor hard and cross temperature with humidity.
Outdoor hard: mild + humid vs mild + mid humidity
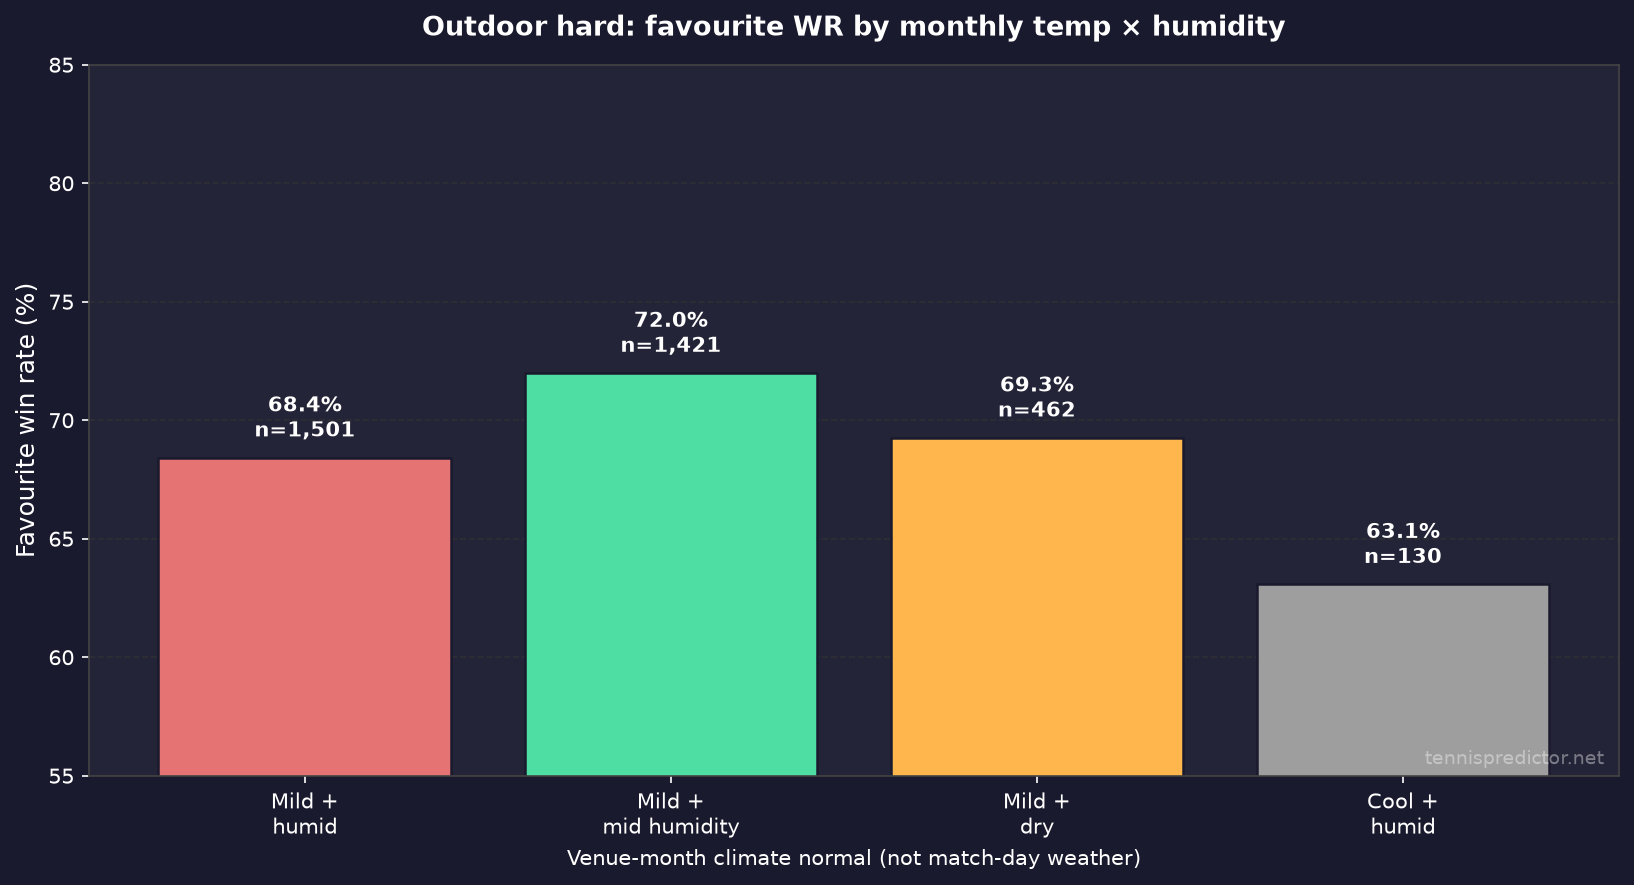 Figure 5: Outdoor hard courts only. Mild + humid months show lower favourite hold than mild + mid-humidity months.
Outdoor hard · monthly climate cells (n ≥ 100):
| Climate cell | Matches | Favourite WR | Upset rate |
|---|---|---|---|
| Mild + humid (>70%) | 1,501 | 68.4% | 31.6% |
| Mild + mid humidity (55–70%) | 1,421 | 72.0% | 28.0% |
| Mild + dry (<55%) | 462 | 69.3% | 30.7% |
| Cool + humid | 130 | 63.1% | 36.9% |
The cleanest climate contrast: on outdoor hard in mild months, favourites hold 68.4% when the month is typically humid versus 72.0% when humidity sits in the mid band—about 3.6 pp, with both samples above 1,400 matches.
Hot × humid and hot × mid cells print high favourite rates (~76–77%) but on n < 100. We list them in the study appendix tables and leave them out of the headline.
Honest framing:
- This supports “humid mild hard-court months are slightly softer for favourites” as a calendar-normal pattern
- It does not say “bet the underdog whenever the forecast shows 80% humidity tomorrow”
- US Open / Cincinnati weeks often land in humid late-summer normals; that is context, not a betting system
How to read a hard-court week with this lens
When an outdoor hard event lands in a mild month whose long-run humidity normal is above 70%, favourites have held less often than in otherwise similar mild months with mid-range humidity. That is a 3.6 pp gap on large samples—real, modest, and easy to overtrade.
Practical use:
- Check whether the week’s climate story is “mild and sticky” versus “mild and moderate.”
- Ask whether the market favourite is already priced like a coin flip or like a -200 chalk.
- Only then decide whether environment is a tie-breaker. It is rarely the whole bet.
Cool+humid outdoor hard (63.1%, n = 130) is directionally softer still, but the sample is thinner—note it, do not build a product around it.
What this means for reading matches
Environment is a background variable. It should not overpower ranking gaps, surface fit, or recent form. Used carefully, the study suggests a short checklist:
Useful checks:
- On clay, ask whether the venue is mid-elevation (roughly 200–800 m) or near sea level. Mid-altitude clay has been the softer favourite-hold bucket in 2022–2025.
- On outdoor hard, ask whether the month’s climate normal is mild + humid versus mild + mid humidity. The hold gap is modest but well sampled.
- Do not expect indoor vs outdoor alone to change favourite hold rates much.
- Do not treat continental region as a strong favourite-stability signal.
How we use this on TennisPredictor:
Live projections already fold surface, form, and market context into match-level probabilities. Environment cuts like these are research signals—candidate features for later model work, not live toggles on the site today. For today’s board, use the live dashboard and treat altitude/climate as secondary context when two players look close on clay or humid hard.
If you are building a mental model of when favourites close after winning the opener, stack this article with the favourite first-set closeout rates piece. If grass season framing is the question, start from the grass court specificity guide and remember altitude is rarely the grass story—almost all grass in this sample sits at sea level.
What we are not claiming
Environment research attracts overclaim. Here is the explicit reject list for this article:
- We are not saying markets are inefficient by X units of expected value.
- We are not publishing a staking plan keyed to metres above sea level.
- We are not substituting climate normals for injury news, travel, or matchup.
- We are not asserting that thin air causes upsets without a physical mediation study.
- We are not mixing this favourite definition with older blog cuts that used a different odds-to-winner mapping.
What we are claiming is narrower: in this 2022–2025 ATP odds sample, mid-altitude clay and mild+humid outdoor hard months show lower favourite hold rates than their natural comparison cells, with sample sizes large enough to take seriously and confidence intervals that do not shrug the gaps away.
Method notes readers should keep
Favourite definition. Lower decimal odds. Ties on price are rare; we treat the first listed side as favourite only when odds are equal (effectively absorbed in the sample).
Climate normals. Open-Meteo archive daily means, averaged within each calendar month over 2010–2019 for each outdoor venue coordinate. That answers “is this tournament’s typical climate associated with favourite WR?” It does not answer “did humidity spike on match day?”
Altitude. Curated approximate venue elevation. Cities with multiple courts share one elevation. Bands are chosen for interpretability, not as physics thresholds.
Coverage. 99.9% venue join; 100% outdoor climate join among joined outdoor matches; indoor climate deliberately N/A.
Low-n cells. High-altitude clay (n = 93), hot outdoor-hard climate cells (n < 100), and a few indoor × altitude splits are shown in study tables but not treated as headline evidence.
Reference: selected venues
The table below is a reader-facing slice of the venue file used in the study, ordered by event month (calendar order). Event month is the most common match month for that tournament in our 2022–2025 odds sample. Temp / humidity are that month’s climate normals at the venue coordinates (outdoor only). Indoor events show climate as N/A.
| Tournament | Region | Altitude | Band | Setting | Event month | Month normal |
|---|---|---|---|---|---|---|
| Australian Open | Oceania | 30 m | sea | outdoor | Jan | 20.6°C / 64% |
| Santiago | South America | 570 m | mid | outdoor | Feb | 21.6°C / 54% |
| Indian Wells | North America | 50 m | sea | outdoor | Mar | 19.8°C / 35% |
| Miami | North America | 5 m | sea | outdoor | Mar | 22.1°C / 68% |
| Barcelona | Europe | 10 m | sea | outdoor | Apr | 13.9°C / 76% |
| Madrid | Europe | 650 m | mid | outdoor | Apr | 12.6°C / 61% |
| Monte Carlo | Europe | 40 m | sea | outdoor | Apr | 13.8°C / 75% |
| Munich | Europe | 520 m | mid | outdoor | Apr | 9.2°C / 71% |
| French Open | Europe | 40 m | sea | outdoor | May | 14.1°C / 72% |
| Rome | Europe | 30 m | sea | outdoor | May | 17.2°C / 73% |
| Queen's Club | Europe | 20 m | sea | outdoor | Jun | 15.7°C / 74% |
| Gstaad | Europe | 1,050 m | high | outdoor | Jul | 16.1°C / 80% |
| Kitzbühel | Europe | 760 m | mid | outdoor | Jul | 17.4°C / 80% |
| Wimbledon | Europe | 30 m | sea | outdoor | Jul | 18.0°C / 72% |
| Cincinnati | North America | 220 m | mid | outdoor | Aug | 24.2°C / 69% |
| US Open | North America | 10 m | sea | outdoor | Aug | 23.6°C / 73% |
| Basel | Europe | 260 m | mid | indoor | Oct | N/A |
| Paris Masters | Europe | 40 m | sea | indoor | Oct | N/A |
| Shanghai | Asia | 5 m | sea | outdoor | Oct | 18.9°C / 76% |
| ATP Finals | Europe | 240 m | mid | indoor | Nov | N/A |
Madrid’s April normal (12.6°C) is cool relative to coastal clay in May—useful context for why elevation and calendar month should be read together, not as slogans.
Appendix: all venues in the study
Full curated list (78 ATP venues), ordered by event month then name. Event month is the modal match month in the 2022–2025 odds sample.
| Tournament | Region | Altitude | Band | Indoor | Event month |
|---|---|---|---|---|---|
| Adelaide | Oceania | 50 m | sea | no | Jan |
| Auckland | Oceania | 30 m | sea | no | Jan |
| Australian Open | Oceania | 30 m | sea | no | Jan |
| Brisbane | Oceania | 30 m | sea | no | Jan |
| Hong Kong | Asia | 30 m | sea | no | Jan |
| Sydney | Oceania | 20 m | sea | no | Jan |
| Acapulco | North America | 30 m | sea | no | Feb |
| Buenos Aires | South America | 25 m | sea | no | Feb |
| Cordoba | South America | 400 m | mid | no | Feb |
| Dallas | North America | 130 m | sea | yes | Feb |
| Delray Beach | North America | 5 m | sea | no | Feb |
| Doha | Middle East | 10 m | sea | no | Feb |
| Dubai | Middle East | 10 m | sea | no | Feb |
| Marseille | Europe | 10 m | sea | yes | Feb |
| Montpellier | Europe | 30 m | sea | yes | Feb |
| Pune | Asia | 560 m | mid | no | Feb |
| Rio de Janeiro | South America | 10 m | sea | no | Feb |
| Rotterdam | Europe | 5 m | sea | yes | Feb |
| Santiago | South America | 570 m | mid | no | Feb |
| Indian Wells | North America | 50 m | sea | no | Mar |
| Miami | North America | 5 m | sea | no | Mar |
| Barcelona | Europe | 10 m | sea | no | Apr |
| Belgrade | Europe | 120 m | sea | no | Apr |
| Bucharest | Europe | 90 m | sea | no | Apr |
| Estoril | Europe | 20 m | sea | no | Apr |
| Houston | North America | 15 m | sea | no | Apr |
| Madrid | Europe | 650 m | mid | no | Apr |
| Marrakech | Middle East | 450 m | mid | no | Apr |
| Monte Carlo | Europe | 40 m | sea | no | Apr |
| Munich | Europe | 520 m | mid | no | Apr |
| French Open | Europe | 40 m | sea | no | May |
| Geneva | Europe | 375 m | mid | no | May |
| Lyon | Europe | 170 m | sea | no | May |
| Rome | Europe | 30 m | sea | no | May |
| Eastbourne | Europe | 10 m | sea | no | Jun |
| Halle | Europe | 100 m | sea | no | Jun |
| Hertogenbosch | Europe | 5 m | sea | no | Jun |
| Mallorca | Europe | 30 m | sea | no | Jun |
| Queen's Club | Europe | 20 m | sea | no | Jun |
| Stuttgart | Europe | 250 m | mid | no | Jun |
| Atlanta | North America | 320 m | mid | no | Jul |
| Bastad | Europe | 10 m | sea | no | Jul |
| Gstaad | Europe | 1,050 m | high | no | Jul |
| Hamburg | Europe | 10 m | sea | no | Jul |
| Kitzbühel | Europe | 760 m | mid | no | Jul |
| Newport | North America | 10 m | sea | no | Jul |
| Umag | Europe | 5 m | sea | no | Jul |
| Wimbledon | Europe | 30 m | sea | no | Jul |
| Cincinnati | North America | 220 m | mid | no | Aug |
| Los Cabos | North America | 10 m | sea | no | Aug |
| Montreal | North America | 40 m | sea | no | Aug |
| Toronto | North America | 80 m | sea | no | Aug |
| US Open | North America | 10 m | sea | no | Aug |
| Washington | North America | 50 m | sea | no | Aug |
| Winston Salem | North America | 290 m | mid | no | Aug |
| Beijing | Asia | 50 m | sea | no | Sep |
| Chengdu | Asia | 500 m | mid | no | Sep |
| Hangzhou | Asia | 20 m | sea | no | Sep |
| Metz | Europe | 180 m | sea | yes | Sep |
| San Diego | North America | 20 m | sea | no | Sep |
| Seoul | Asia | 40 m | sea | no | Sep |
| Sofia | Europe | 550 m | mid | yes | Sep |
| Tel Aviv | Middle East | 10 m | sea | yes | Sep |
| Almaty | Asia | 800 m | high | yes | Oct |
| Antwerp | Europe | 10 m | sea | yes | Oct |
| Basel | Europe | 260 m | mid | yes | Oct |
| Brussels | Europe | 50 m | sea | yes | Oct |
| Florence | Europe | 50 m | sea | yes | Oct |
| Gijon | Europe | 10 m | sea | yes | Oct |
| Napoli | Europe | 20 m | sea | no | Oct |
| Paris Masters | Europe | 40 m | sea | yes | Oct |
| Shanghai | Asia | 5 m | sea | no | Oct |
| Stockholm | Europe | 30 m | sea | yes | Oct |
| Tokyo (Japan Open) | Asia | 40 m | sea | no | Oct |
| Vienna | Europe | 170 m | sea | yes | Oct |
| Athens | Europe | 70 m | sea | yes | Nov |
| ATP Finals | Europe | 240 m | mid | yes | Nov |
| Next Gen ATP Finals | Middle East | 15 m | sea | yes | Nov |
Bands: sea 0–200 m · mid 200–800 m · high 800 m+.
Frequently asked questions
Does altitude cause more upsets?
We do not claim causation. Mid-altitude venues (200–800 m) show a lower favourite win rate (66.6%, n = 1,382) than sea-level venues (71.0%, n = 6,714). The gap is largest on clay (72.5% sea vs 66.6% mid). Field strength, event level, and surface still matter more than elevation alone.
Is this match-day weather?
No. Temperature and humidity here are monthly climate normals for the venue’s coordinates in the match’s calendar month. Indoor events are not assigned outdoor climate values.
Do indoor tournaments favour the favourite more?
Not in this sample. Indoor favourite WR is 69.4% (n = 901) versus 70.4% outdoor (n = 7,353). The intervals overlap; the gap is not material.
Which climate pattern shows the clearest hard-court signal?
Outdoor hard in mild months: humid normals (68.4%, n = 1,501) versus mid-humidity normals (72.0%, n = 1,421). Hot-month cells are too small (n < 100) for strong claims.
How many matches are in the study?
8,254 ATP matches with odds from 2022–2025 joined to the venue table. Overall favourite win rate is 70.3% (Wilson 95%: 69.3–71.3%).
Should I bet underdogs at altitude?
Not as a blanket rule. Use elevation and climate as context when prices already look soft—especially on mid-altitude clay—and always size risk responsibly. Environment does not replace matchup analysis.
Bottom line
Across 8,254 ATP matches with odds (2022–2025), favourites win about seven in ten. Environment does not rewrite that baseline, but it does carve meaningful niches:
The numbers that stick:
- Mid-altitude favourites: 66.6% vs sea-level 71.0%
- Clay sea vs clay mid: 72.5% vs 66.6% (−5.9 pp)
- Outdoor hard mild+humid vs mild+mid humidity: 68.4% vs 72.0%
- Indoor vs outdoor: essentially flat (69.4% vs 70.4%)
- Regions: roughly 68–71%, no dramatic hierarchy
Altitude on clay and humid mild hard-court months are the environment signals worth remembering. Everything else in this cut is either noise-adjacent or too small to trust.
See today's match predictions with confidence scores and value signals.
View Live Predictionsarrow_forwardRelated Articles

When breaks happen: ATP set patterns from 2,798 charted matches
Most ATP breaks are isolated — not part of a streak. Yet they cluster in the final third of sets, and clay courts trade breaks far more often than grass. We analysed 2,798 charted men's matches from 2022 onward to map when breaks happen, how often players break back, and what set-one patterns look like by surface.
July 15, 2026 · 18 min read
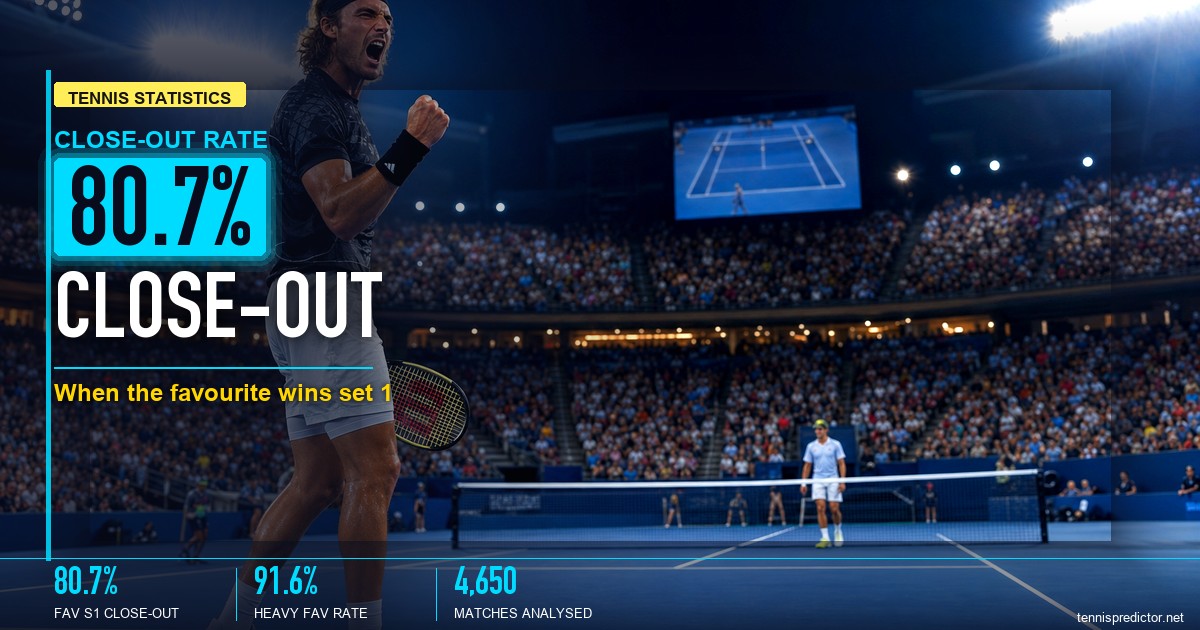
First set betting: close-out rates, carry-through, and market context
When a pre-match favourite wins the first set, they close out the match 80.7% of the time — a 12-point boost over their baseline. But that number swings from 66% to 94% depending on their odds and the surface. Here's the full data-backed breakdown across 4,650 ATP matches.
May 11, 2026 · 29 min read
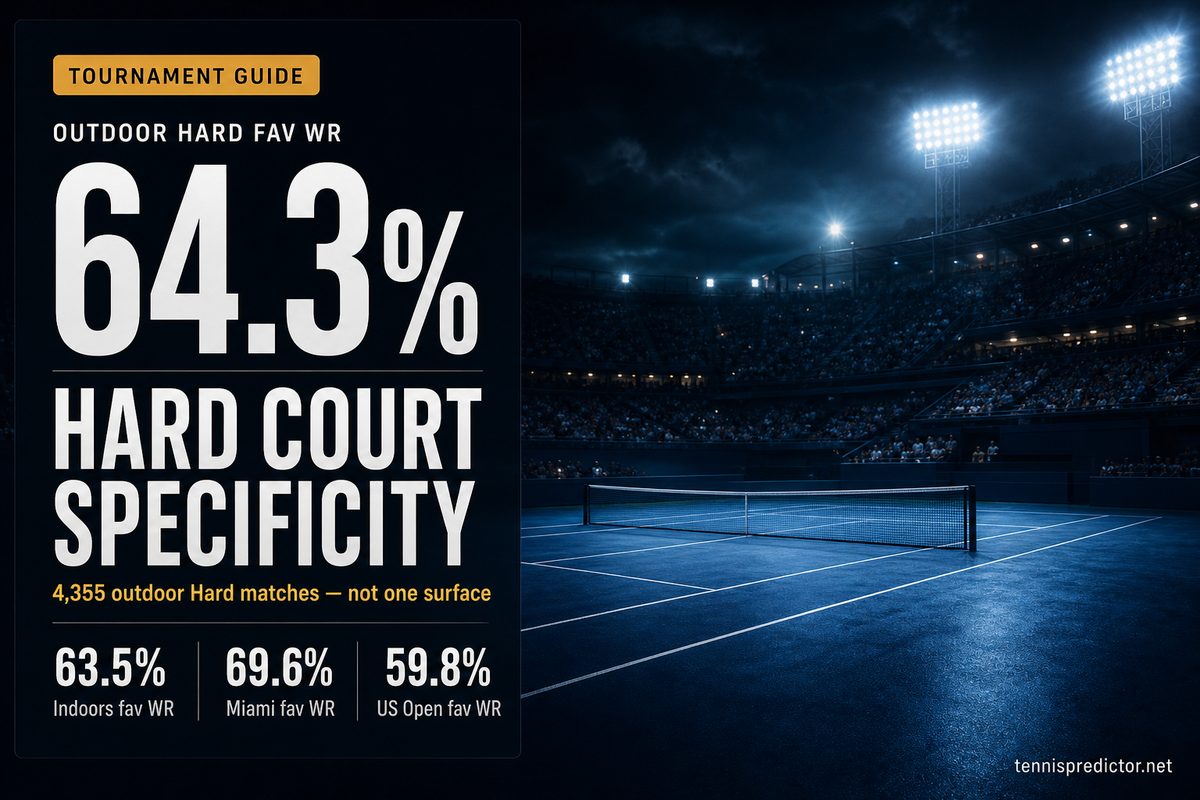
ATP hard courts are not one surface: what 4,355 matches show
Hard courts are treated as tennis’s neutral baseline — the surface where “real” form shows. Our 2022–2025 ATP cache says otherwise: outdoor Hard and Indoors are different animals, Miami favourites hold far more often than US Open chalk, and clay specialists can lose 30+ points transferring north.
September 4, 2026 · 14 min read
ATP grass court specificity: what 1,215 matches really tell us
Everyone repeats the same myths about grass — that it's random, that serve specialists always win, that clay court form means nothing. Our model disagrees. We dug into 1,215 ATP grass matches from 2022 to 2025 to separate the folklore from the numbers.
June 13, 2026 · 16 min read