The most predictable tennis players of 2026 so far
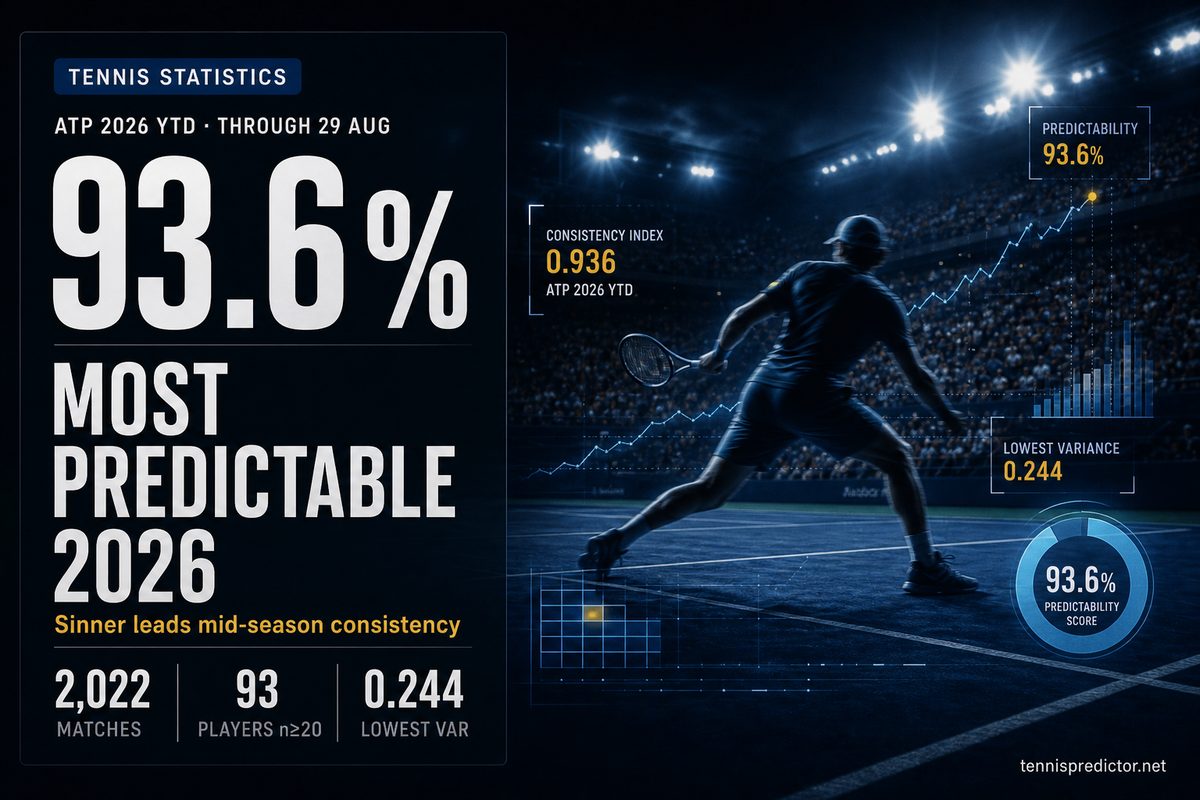
The 2025 season is closed. For who is delivering right now, we need a separate cut: 2026 year-to-date.
We scored every ATP main-draw match in our tournament cache from 4 January through 29 August 2026: 2,022 matches, 93 players with at least 20 matches. The metric matches our full-season 2025 study — same formula, incomplete calendar. US Open matches after the cache cutoff are not included yet.
What consistency means here
Every match is a win or a loss. From a player’s season win rate, we can measure how “noisy” those results are — call that variance in this article.
Plain English:
- A player who wins ~90% of the time rarely surprises you. Most matches go the expected way → low variance (around 0.25–0.30).
- A player who wins ~50% of the time is a coin flip. Anything can happen → maximum variance (0.500).
- So variance here is not a fancy “mood” score. It is how unpredictable a binary win/loss record is at that win rate.
Consistency score = win rate / (variance + 0.1).
High win rate + low variance → ultra-predictable favourite. Near-50% win rate + 0.500 variance → coin-flip trap.
Honesty check: at this definition, variance is a pure function of win rate. Raise the win rate and variance falls automatically. So the top of this board largely is a win-rate ranking dressed as “consistency.” It still works as a simple reliability screen — dominant winners look “safe” — but it does not measure clutch swings, surface splits, or form volatility. We keep the same formula so 2026 YTD stays comparable to 2025.
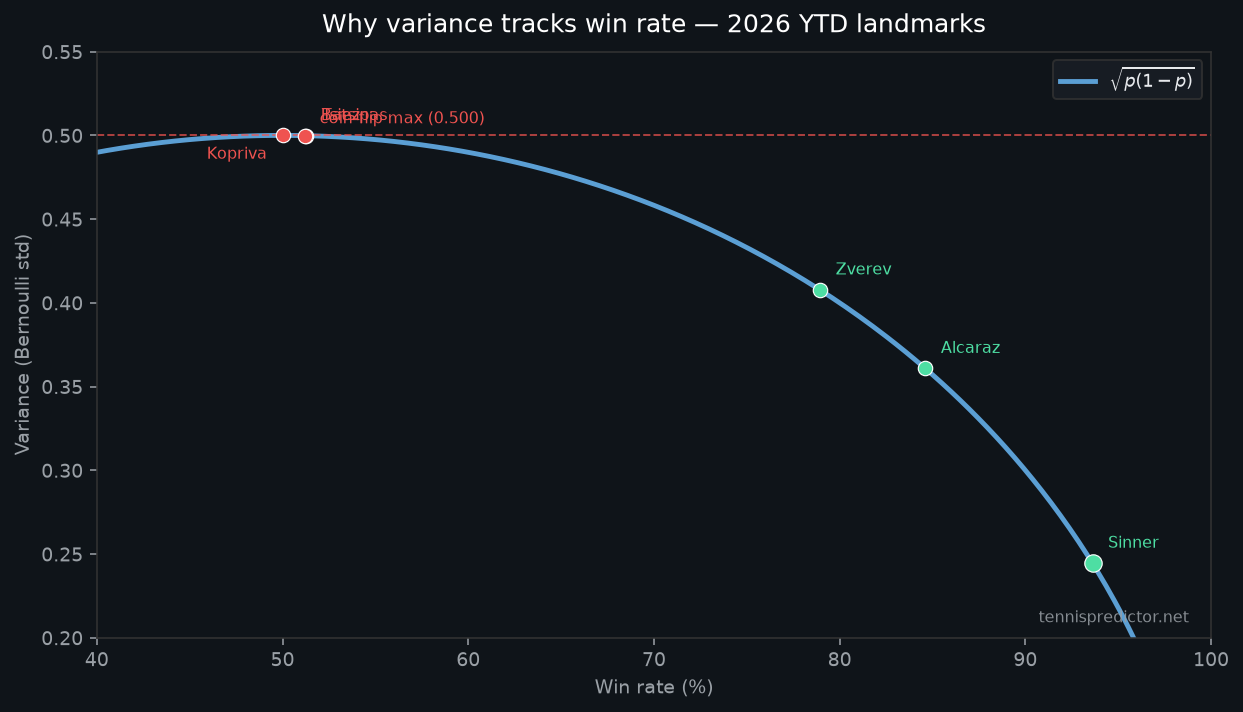 Bernoulli std (\sqrt{p(1-p)}) peaks at 50% win rate. Sinner sits far left/low; Tsitsipas, Baez, and Kopriva hug the coin-flip ceiling.
(For the stats-curious: variance = (\sqrt{p(1-p)}) where (p) is the win rate.)
The 2026 YTD scatter
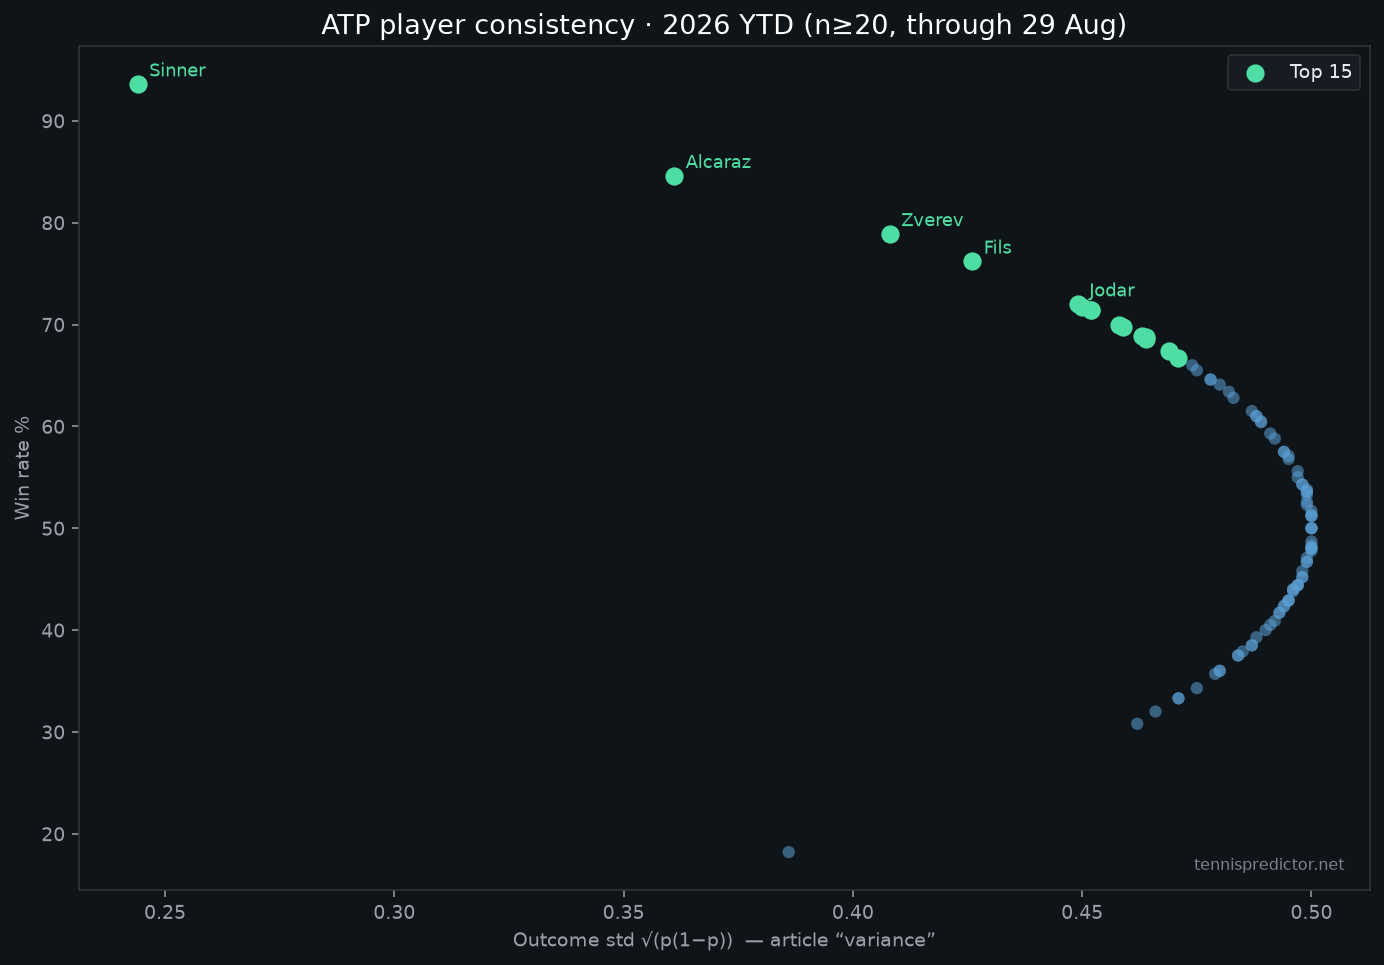 93 ATP players with ≥20 main-draw matches in 2026 through 29 Aug. Top-left = high win rate, low variance. Green = top-15 consistency scores.
Sinner separates from everyone else. Alcaraz remains second, but on a much thinner sample than 2025 — treat that ranking with more caution until the sample fills out.
Top 15 most predictable players (2026 YTD)
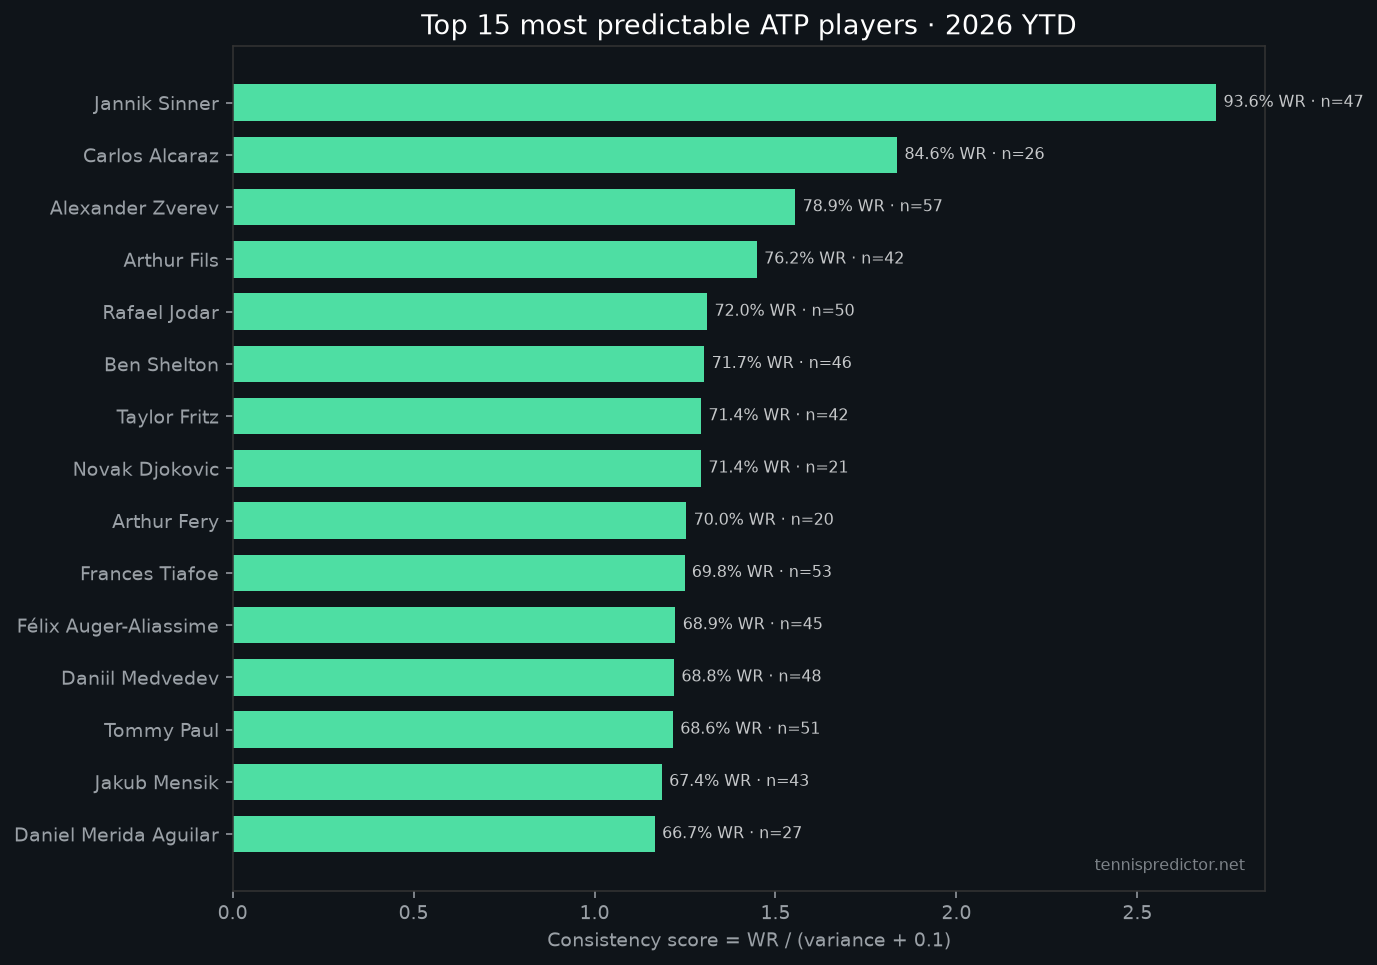 Ranked by consistency score = WR / (variance + 0.1). Source: 2,022 ATP matches, 2026 through 29 Aug.
| Rank | Player | Win rate | Variance | Matches | Tier |
|---|---|---|---|---|---|
| 1 | Jannik Sinner | 93.6% | 0.244 | 47 | Ultra-predictable |
| 2 | Carlos Alcaraz | 84.6% | 0.361 | 26 | Ultra-predictable* |
| 3 | Alexander Zverev | 78.9% | 0.408 | 57 | Highly predictable |
| 4 | Arthur Fils | 76.2% | 0.426 | 42 | Highly predictable |
| 5 | Rafael Jodar | 72.0% | 0.449 | 50 | Highly predictable |
| 6 | Ben Shelton | 71.7% | 0.450 | 46 | Highly predictable |
| 7 | Taylor Fritz | 71.4% | 0.452 | 42 | Highly predictable |
| 8 | Novak Djokovic | 71.4% | 0.452 | 21 | Highly predictable* |
| 9 | Arthur Fery | 70.0% | 0.458 | 20 | Highly predictable* |
| 10 | Frances Tiafoe | 69.8% | 0.459 | 53 | Moderately predictable |
| 11 | Félix Auger-Aliassime | 68.9% | 0.463 | 45 | Moderately predictable |
| 12 | Daniil Medvedev | 68.8% | 0.464 | 48 | Moderately predictable |
| 13 | Tommy Paul | 68.6% | 0.464 | 51 | Moderately predictable |
| 14 | Jakub Mensik | 67.4% | 0.469 | 43 | Moderately predictable |
| 15 | Daniel Merida Aguilar | 66.7% | 0.471 | 27 | Moderately predictable |
*Thin sample (n ≤ 26) — ranking is informative but unstable. For sizing bets on volume, use the strict board below.
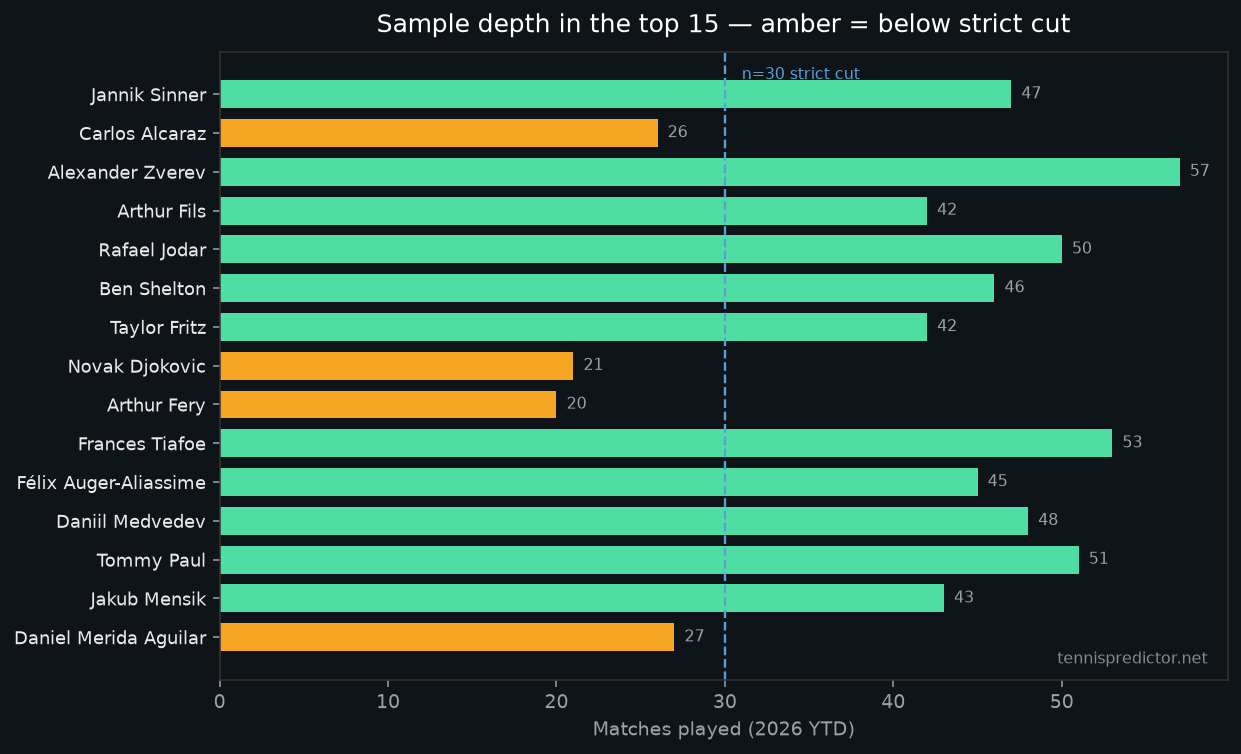 Amber bars are below the n=30 strict cut (Alcaraz, Djokovic, Fery, Merida Aguilar). Green = already volume-eligible.
Strict board (n ≥ 30) — bet with volume
Same formula, harder sample filter. Alcaraz, Djokovic, Fery, and Merida Aguilar drop off; the board is who has already logged a real mid-season workload.
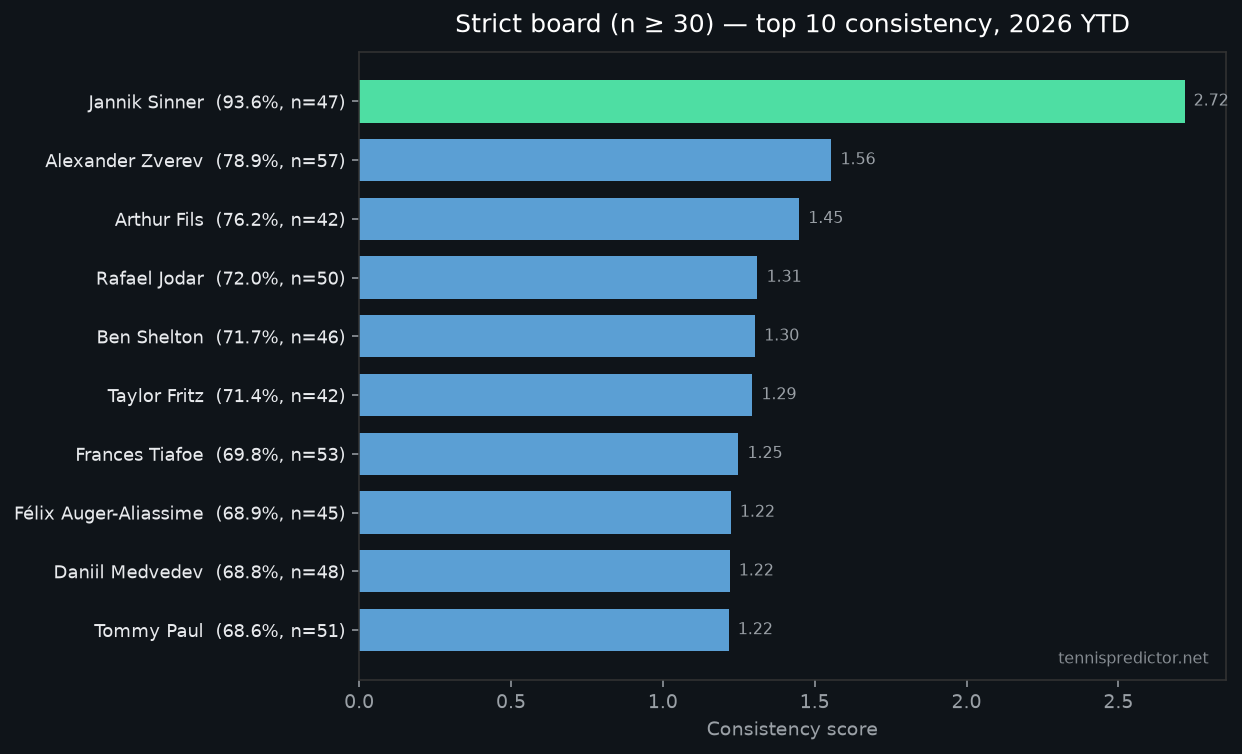 Consistency score with n ≥ 30 only — the “bet with volume” view of 2026 YTD.
| Rank | Player | Win rate | Matches |
|---|---|---|---|
| 1 | Jannik Sinner | 93.6% | 47 |
| 2 | Alexander Zverev | 78.9% | 57 |
| 3 | Arthur Fils | 76.2% | 42 |
| 4 | Rafael Jodar | 72.0% | 50 |
| 5 | Ben Shelton | 71.7% | 46 |
| 6 | Taylor Fritz | 71.4% | 42 |
| 7 | Frances Tiafoe | 69.8% | 53 |
| 8 | Félix Auger-Aliassime | 68.9% | 45 |
| 9 | Daniil Medvedev | 68.8% | 48 |
| 10 | Tommy Paul | 68.6% | 51 |
Notes on the leaders
- Sinner is the clear mid-season story: 93.6% with the lowest variance in the field (0.244) across 47 matches.
- Alcaraz is still Tier-1 on the n≥20 board, but 26 matches is not a full-season sample — he does not appear on the strict board yet.
- Fils, Jodar, Shelton, and Fery show how 2026 YTD elevates names that were mid-pack or outside the 2025 top 15.
- Djokovic at 71.4% on 21 matches is a small-n elite line, not a volume leader.
Who moved vs 2025
Same consistency formula, players with ≥20 matches in both the 2025 full season and 2026 YTD. Rank change: positive = better consistency rank in 2026.
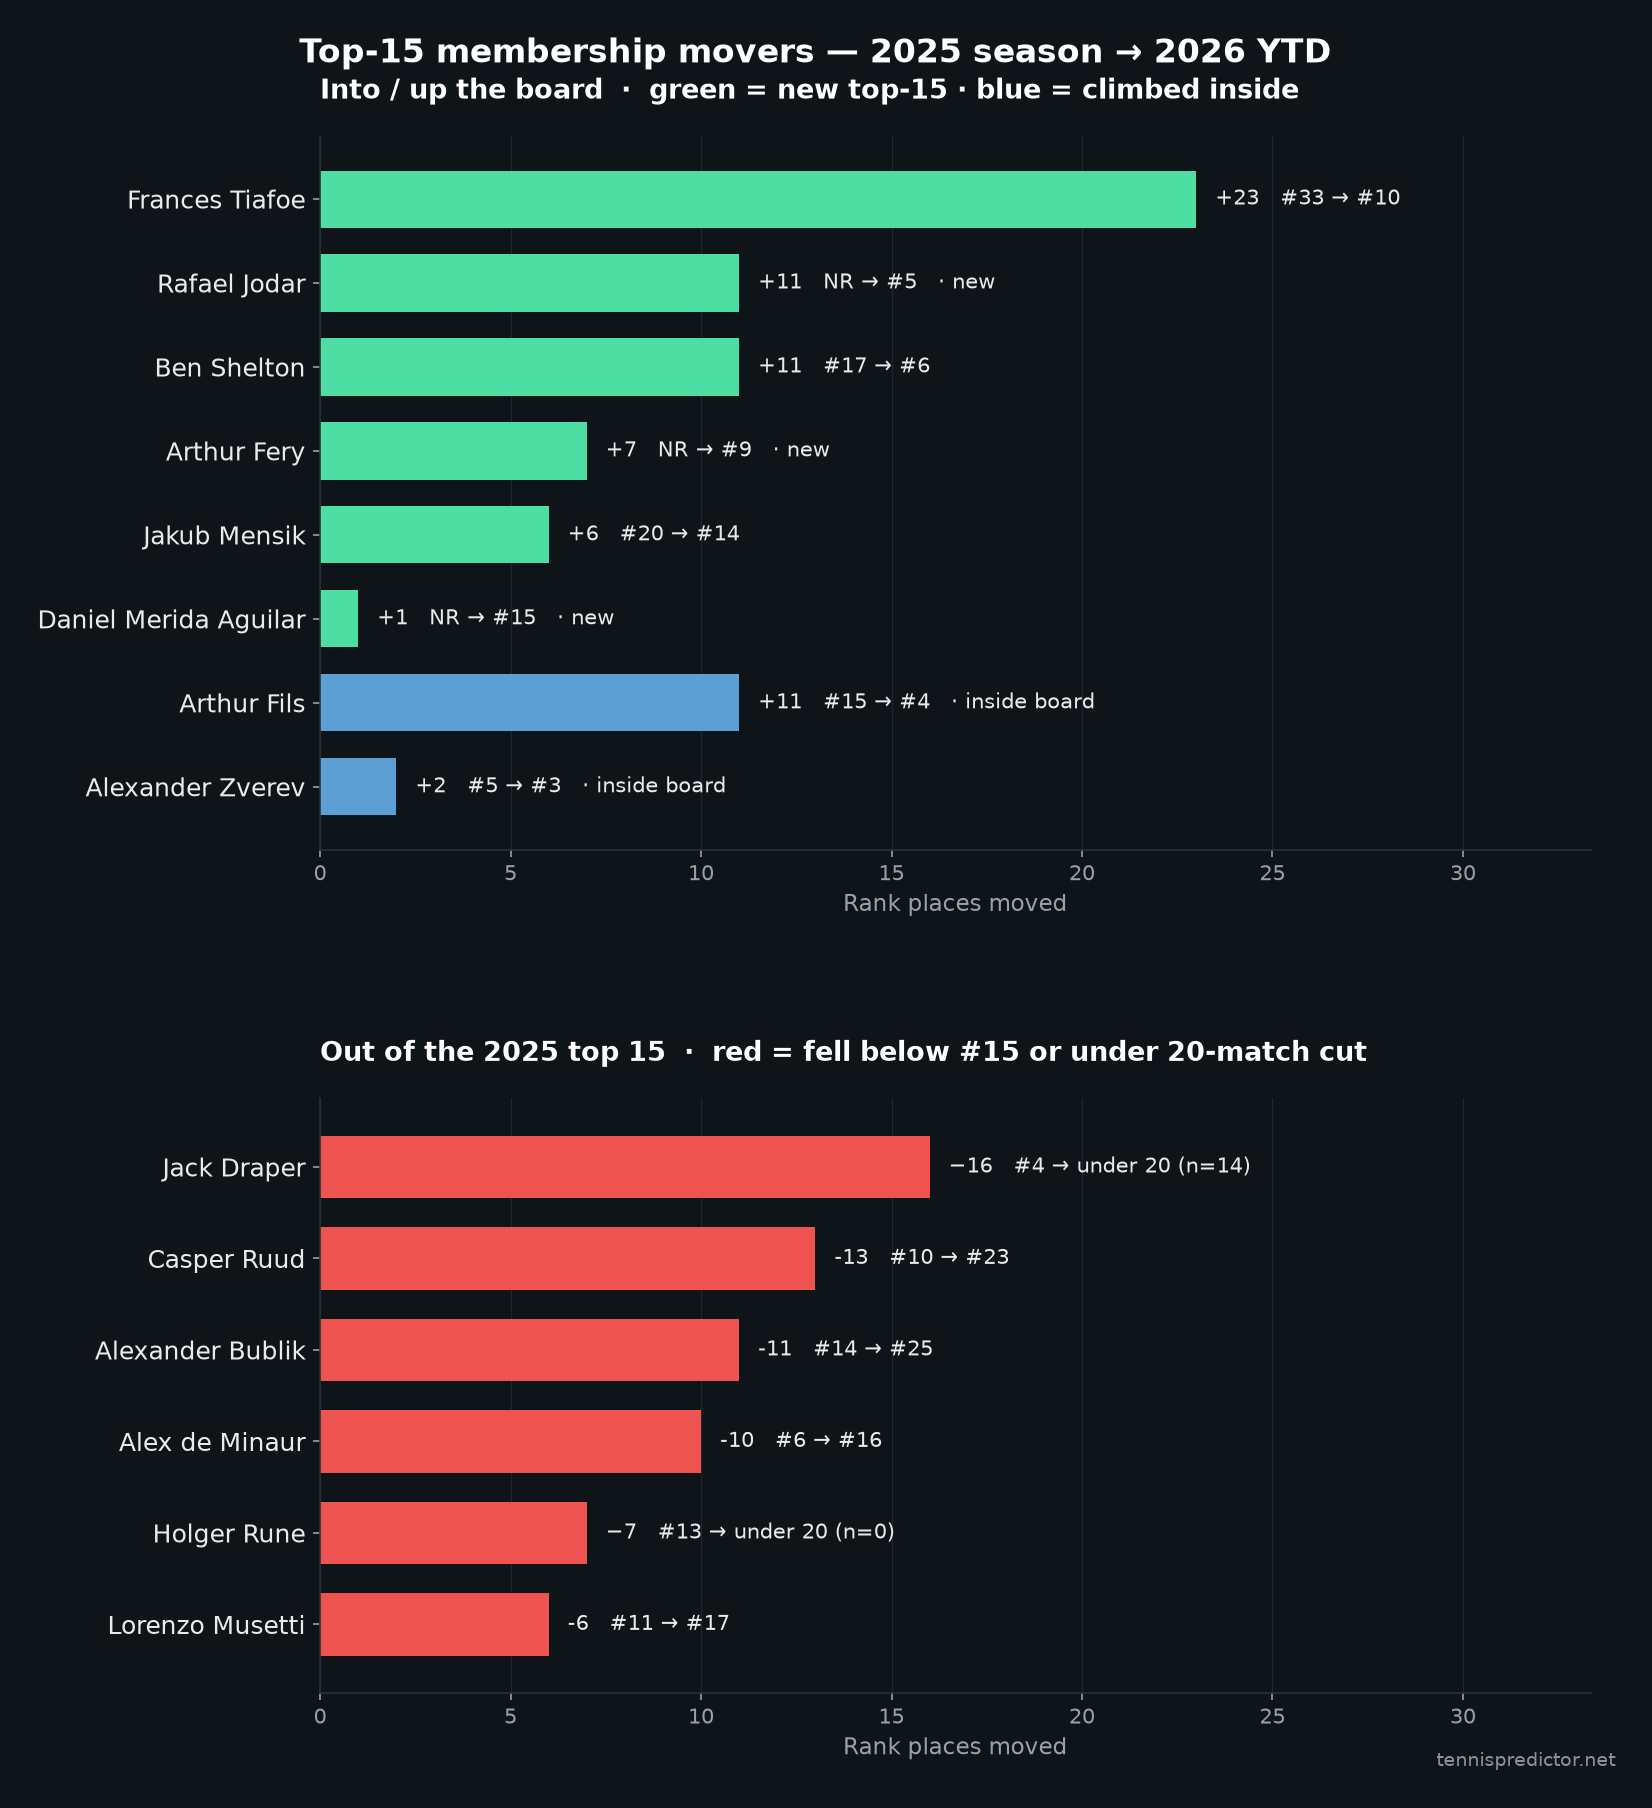 Top: green = entered the 2026 top 15; blue = Fils/Zverev climbing inside the board. Bottom: red = left the 2025 top 15 (including thin-sample exits). Bar length = rank places moved.
Into the 2026 top 15 (not in the 2025 top 15):
- Rafael Jodar — new on the board (#5, 72.0%, 50 matches)
- Ben Shelton — #17 → #6
- Arthur Fery — thin-sample entrant (#9, n=20)
- Frances Tiafoe — #33 → #10 (biggest household-name jump)
- Jakub Mensik — #20 → #14
- Daniel Merida Aguilar — #15 YTD
Out of the 2025 top 15 (so far):
- Jack Draper and Holger Rune — under 20 matches YTD (not ranked yet)
- Alex de Minaur — #6 → #16
- Casper Ruud — #10 → #23
- Lorenzo Musetti — #11 → #17
- Alexander Bublik — #14 → #25
Also climbing hard inside the board: Arthur Fils (#15 → #4) and Shelton/Tiafoe as above. Zverev edged up (#5 → #3) on a stronger win rate.
Predictability year-over-year (consistency score)
Rank jumps tell membership. The consistency score itself answers a different question: is the player more or less predictable than in the full 2025 season? Same formula, players with ≥20 matches in both years.
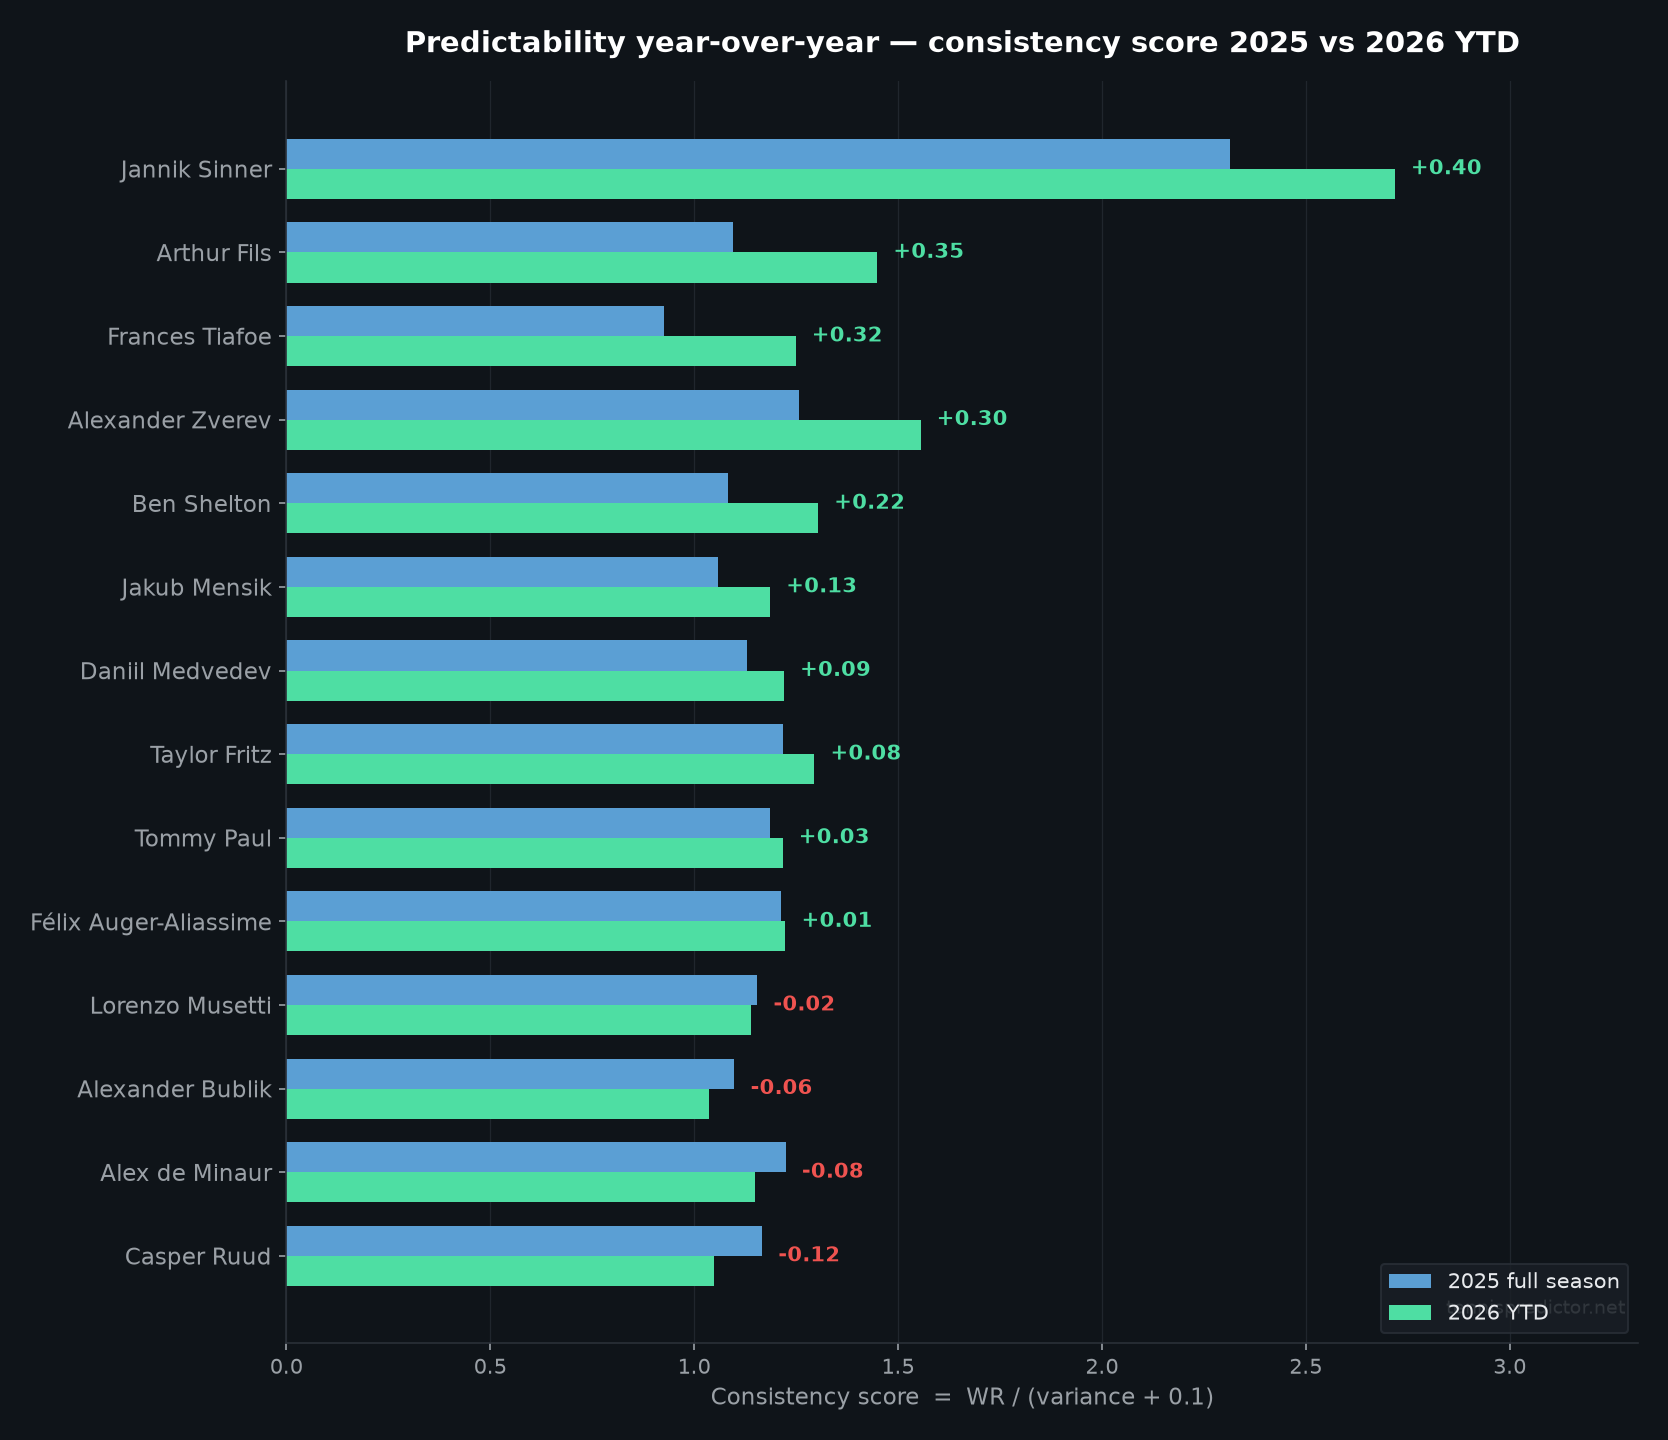 Grouped bars: blue = 2025 full-season consistency, green = 2026 YTD. Labels show score change (Δ). Sorted by biggest rise.
Biggest rises in predictability:
- Sinner — 2.32 → 2.72 (+0.40); still #1, and the score gap to the field widened
- Fils — 1.10 → 1.45 (+0.35); the clearest mid-pack → Tier-2 jump
- Tiafoe — 0.93 → 1.25 (+0.32); biggest household-name score climb
- Zverev — 1.26 → 1.56 (+0.30); Shelton — 1.08 → 1.30 (+0.22)
Softening vs 2025:
- Ruud — 1.17 → 1.05 (−0.12)
- de Minaur — 1.22 → 1.15 (−0.08)
- Bublik — 1.10 → 1.04 (−0.06)
- Musetti — almost flat (−0.02) but slipped out of the top 15 on relative ranking
No 2025 comparable line (under 20 matches last season, or new to the board): Jodar (1.31), Fery (1.25), Merida Aguilar (1.17) — YTD scores only.
For how nationality clusters interact with reliability, see The nationality factor. For high-leverage set moments, see Tiebreak mastery.
Least predictable: the 50% trap
Among players with ≥25 matches, these sat closest to a coin flip (variance ≈ 0.500):
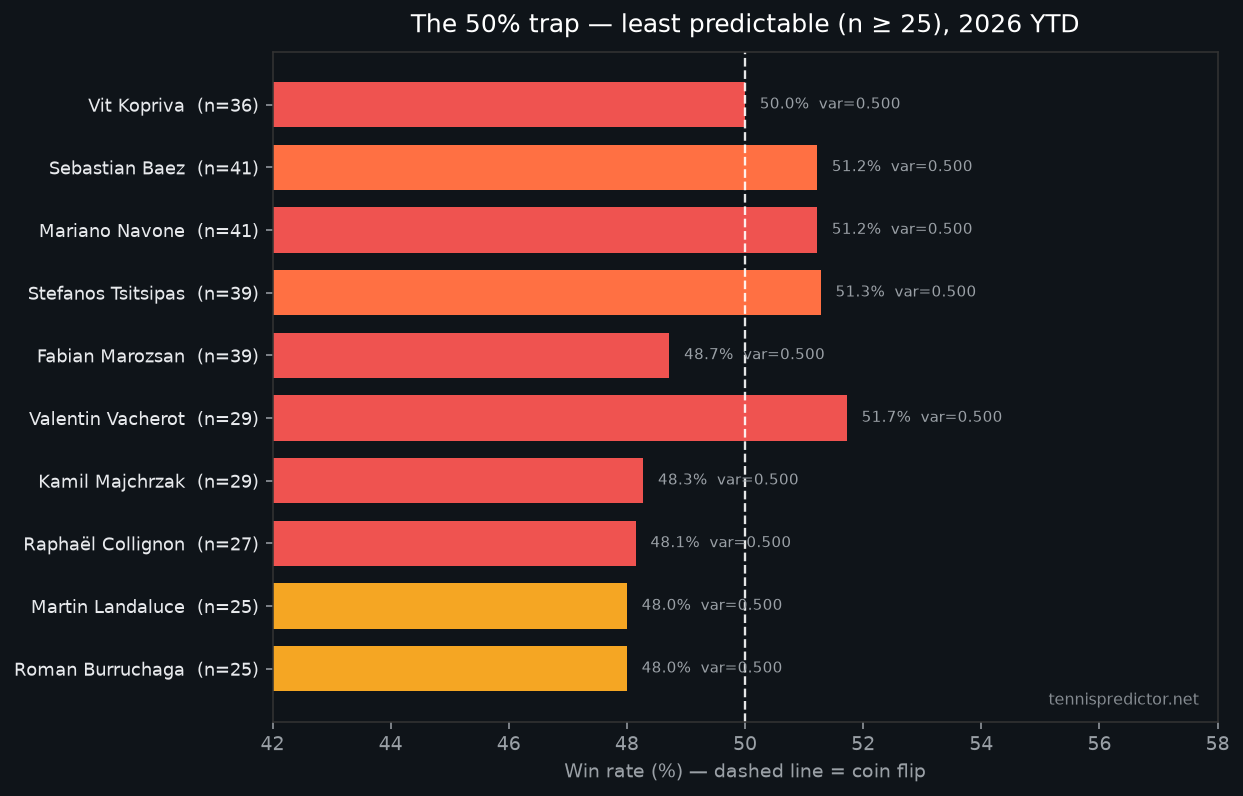 Win rates hugging the dashed 50% line — maximum Bernoulli variance. Orange bars flag household names (Tsitsipas, Baez).
- Vit Kopriva — 50.0% (36 matches)
- Sebastian Baez — 51.2% (41)
- Mariano Navone — 51.2% (41)
- Stefanos Tsitsipas — 51.3% (39)
- Fabian Marozsan — 48.7% (39)
- Valentin Vacherot — 51.7% (29)
- Kamil Majchrzak — 48.3% (29)
- Raphaël Collignon — 48.1% (27)
- Martin Landaluce — 48.0% (25)
- Roman Burruchaga — 48.0% (25)
A 50% win rate at maximum variance means ranking gaps and “form stories” explain less than they feel like they should.
That list is not a “bad players” board. Tsitsipas (51.3%, 39 matches) and Baez (51.2%, 41) are still household ATP names — a mid-season near-50% line usually means uneven results and tougher draws, not that the brand is broken. Treat them as higher-variance legs until the sample tilts clearly above or below the coin flip.
How to use this in betting
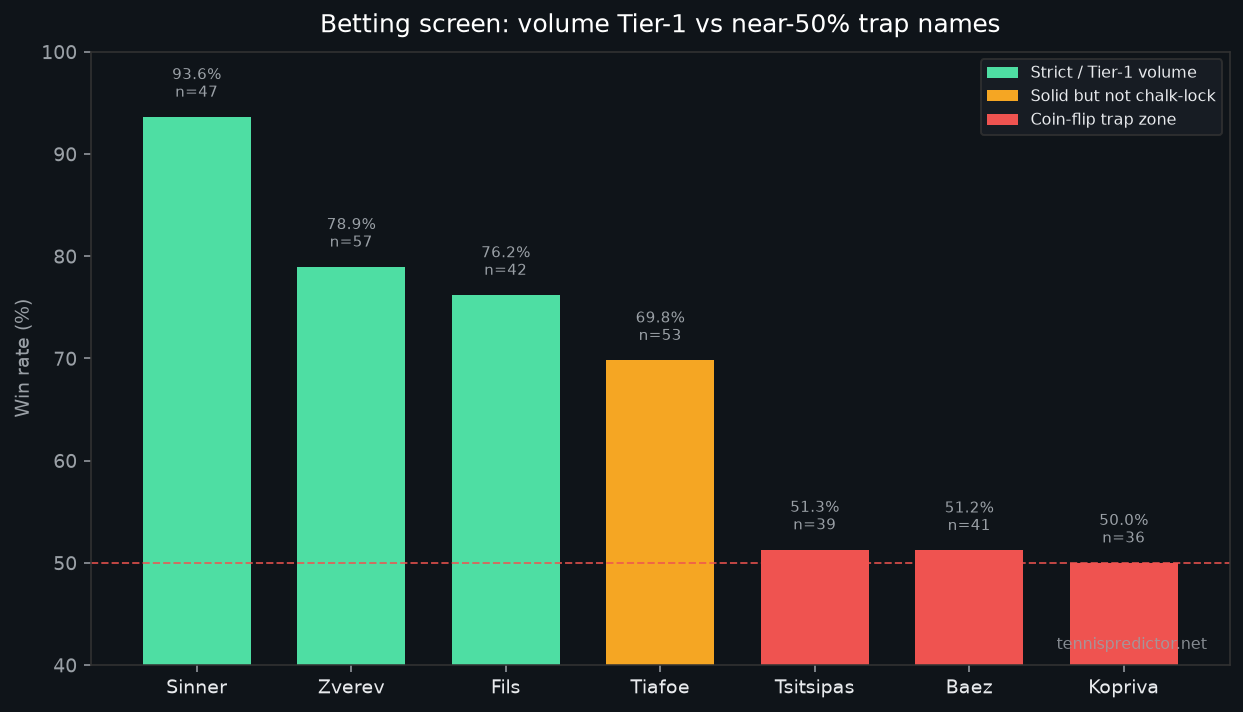 Same YTD window: Sinner / Zverev / Fils sit in the volume Tier-1 zone; Tsitsipas, Baez, and Kopriva sit on the coin-flip line.
For Tier 1–2 favourites (especially Sinner, Zverev, Fils on volume):
- Prefer clear favourites against lower-ranked opponents
- Size stakes larger when surface also matches their profile
- Do not confuse “predictable” with “always overlays”
For near-50% players:
- Avoid treating them as safe chalk
- Look for model disagreement + large price edges
- Fade blind accumulator legs built on hot-streak narratives
Worked example: suppose today’s dashboard shows Sinner as a heavy favourite against a mid-pack opponent, and a separate match with Tsitsipas or Baez priced like a “safe” chalk because of name recognition. The YTD board says the opposite: Sinner’s 93.6% / 47-match line is the volume Tier-1 screen; a near-50% name is closer to a coin flip than a lock. You might still pass on short Sinner odds if there is no price edge — predictable ≠ +EV — but you should not build an accumulator on the trap-list chalk the same way you would on strict-board leaders.
Live slate context: always re-check today’s dashboard before sizing any pick.
FAQ
Is this the final 2026 ranking?
No. This is a year-to-date snapshot through 29 August 2026. The US Open and the rest of the season will change samples and possibly the order. For a closed season, use Most predictable players of 2025.
Who is the most predictable player in 2026 so far?
Jannik Sinner — 93.6% win rate, 0.244 variance, 47 matches. He is well clear of the field on consistency score.
Why is Alcaraz second with only 26 matches?
Consistency score still ranks him second, but the sample is thin. We flag n ≤ 26 as unstable until more matches land.
How many matches did you analyse?
2,022 ATP main-draw matches from 4 Jan–29 Aug 2026. Rankings use players with ≥20 matches (93 players). The strict companion board uses ≥30 matches.
Is variance just win rate in disguise?
Yes, for this study. Because variance = (\sqrt{p(1-p)}), every win-rate maps to exactly one variance. Ranking by consistency mostly reorders the same dominant winners. We still publish it as a readable reliability screen and to keep the series comparable with 2025 — not as a claim that we measured “clutch” or day-to-day form swings.
Data: ATP tournament cache, 2026 YTD through 29 Aug 2026. Metric: win-rate noise (“variance”) and consistency = WR / (variance + 0.1). Analytics only — not betting advice.
See today's match predictions with confidence scores and value signals.
View Live Predictionsarrow_forwardRelated Articles
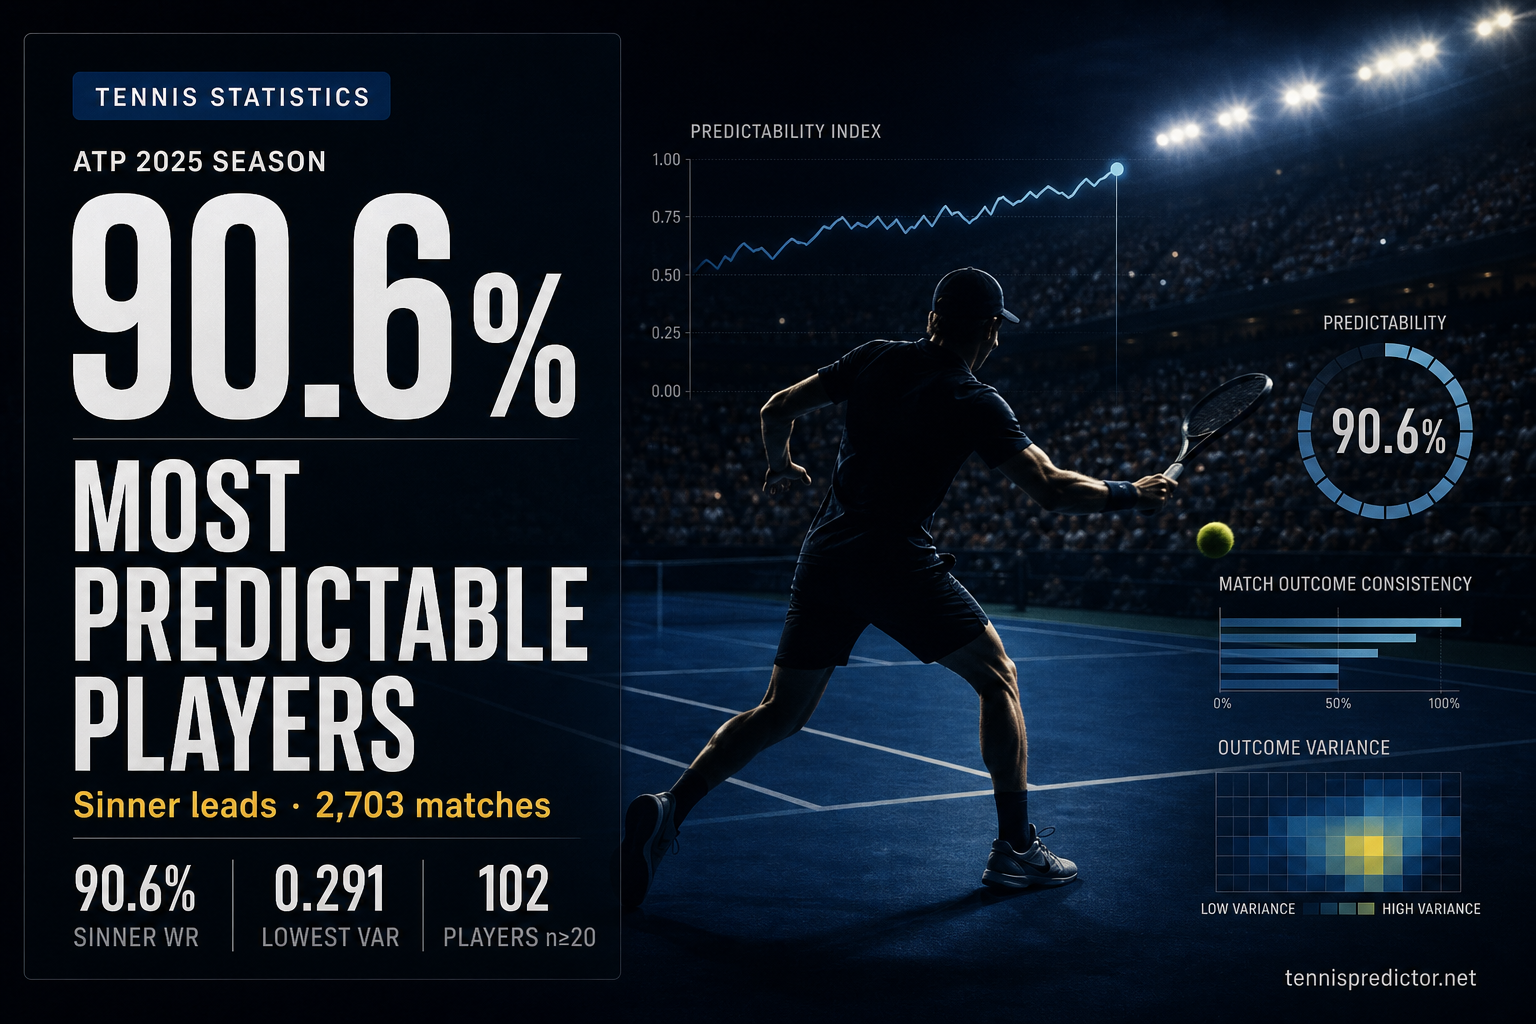
The most predictable tennis players of 2025
We ranked 102 ATP players with 20+ main-draw matches in 2025. Sinner and Alcaraz sit alone in the ultra-predictable tier; Marozsan and Cazaux sit on the 50% coin-flip line.
September 3, 2026 · 8 min read

The nationality factor: which countries produce the most reliable players?
With the full 2022–2026 tournament cache, nationality still predicts reliability — but the leaderboard moved. China, Czechia and Argentina top consistency; Germany and Canada sit at the high-variance end.
September 3, 2026 · 11 min read
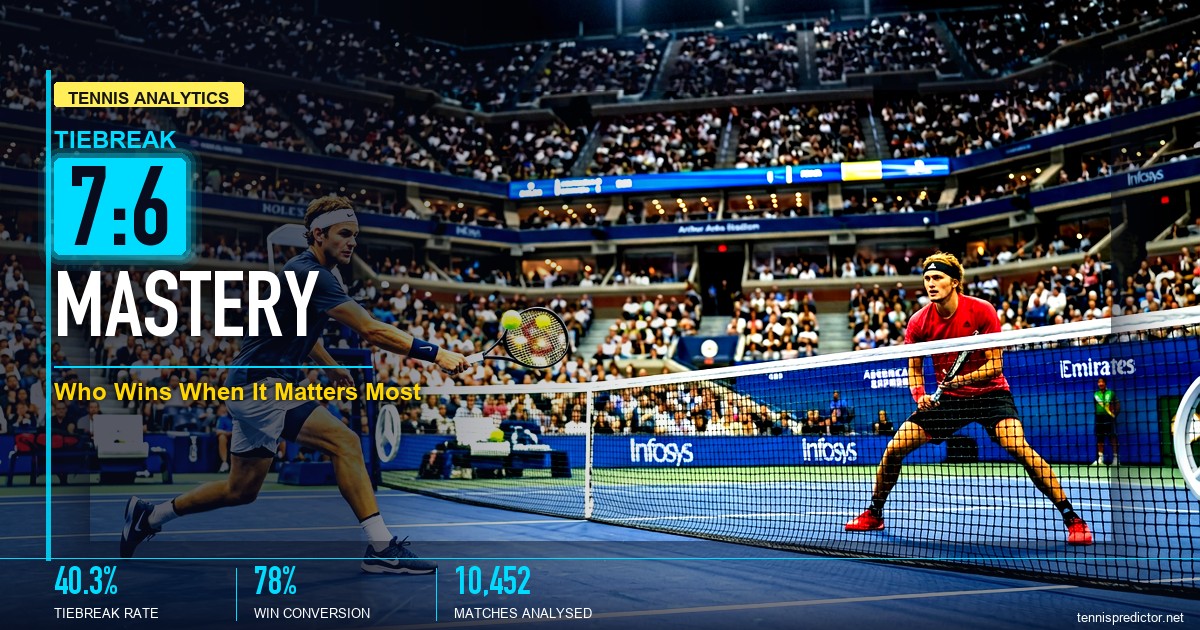
Tiebreak mastery: who wins when it matters most?
40.3% of professional matches feature a tiebreak — but that hides enormous variation. June grass-season matches hit 47.9%; April clay hits 33.7%. Sinner wins 79% of hard-court tiebreaks but only 46% on clay. And some players recover from a lost set-1 tiebreak 64% of the time, others just 7%.
April 10, 2026 · 18 min read
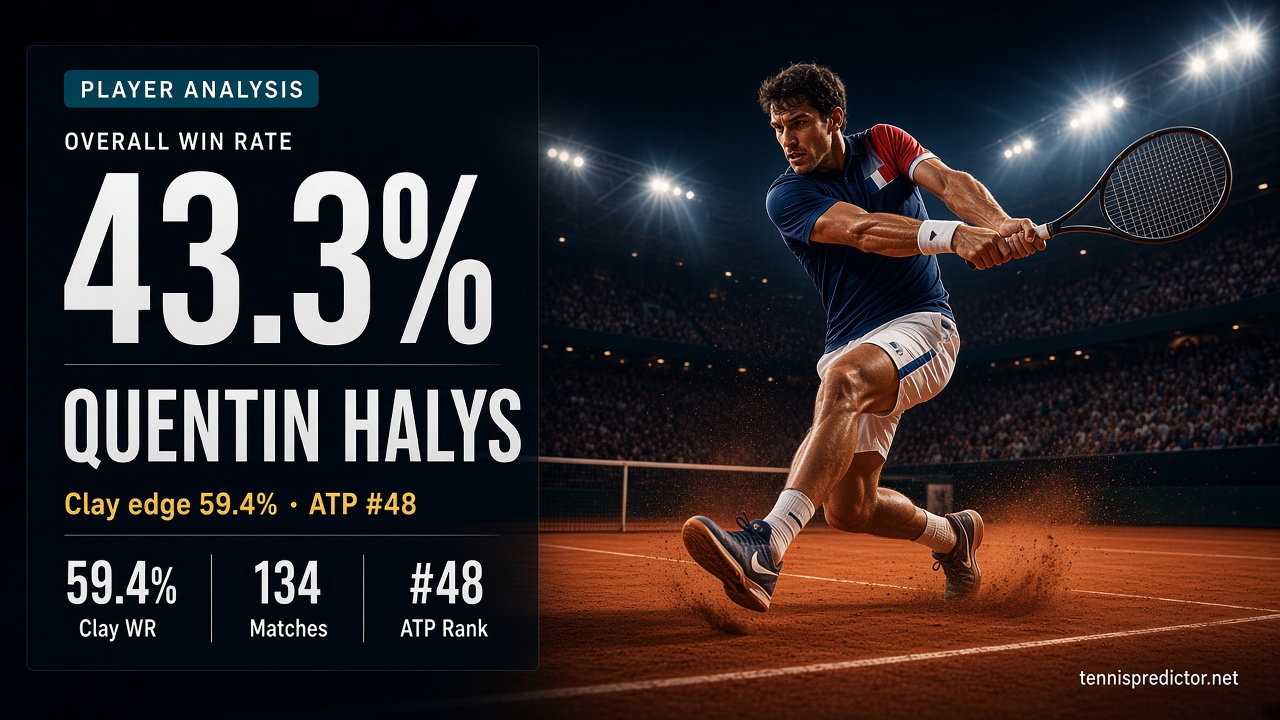
Quentin Halys: Clay specialist edge (59.4%) vs Indoors at 23.5%
Quentin Halys has played 134 ATP main-draw matches from 2022–2026 at a 43.3% overall win rate. The data story: Clay specialist edge (59.4%) vs Indoors at 23.5%.
October 17, 2026 · 11 min read