US Open 2026 betting preview: what 4 years of Flushing Meadows data reveals
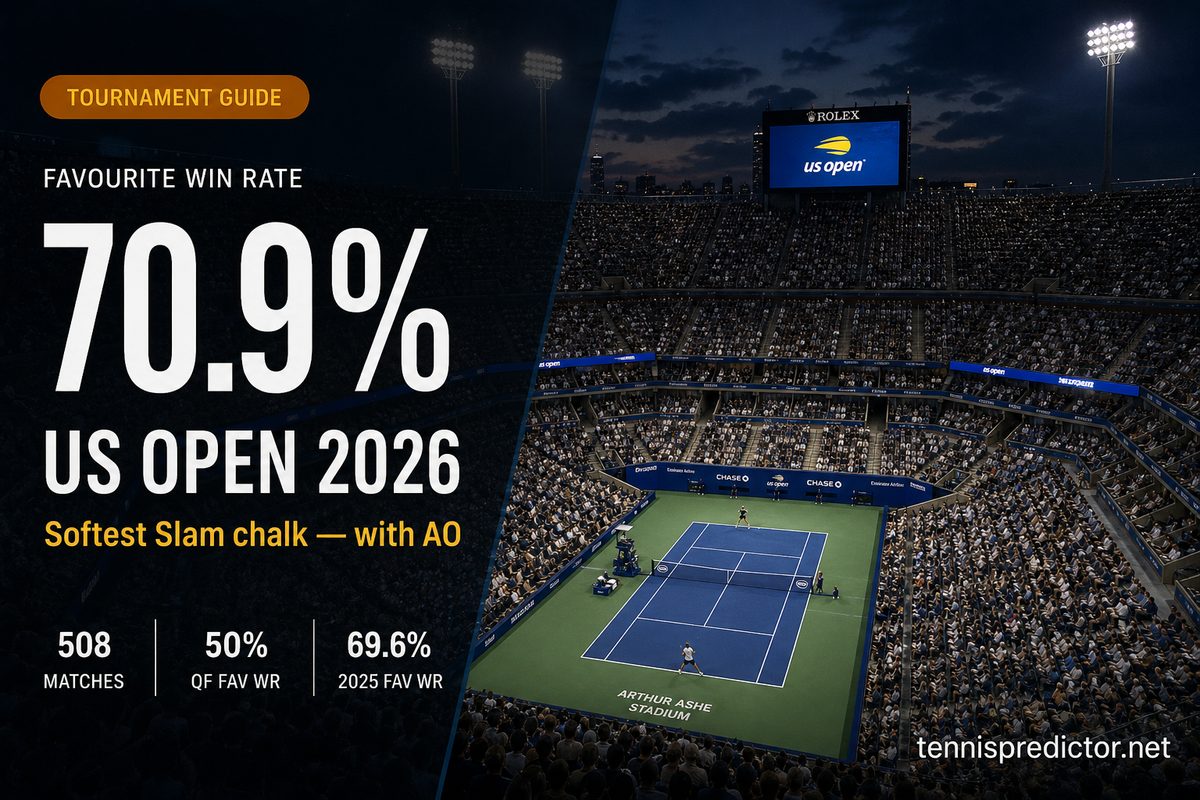
The New York paradox: the US Open is among the least predictable Slams
This US Open 2026 betting preview uses four years of Flushing Meadows match data to answer a simple question: how often do bookmaker favourites (or favorites) actually win at the year’s last Grand Slam?
Flushing Meadows sells chaos — Arthur Ashe night sessions, loud crowds, sticky late-summer outdoor hard courts. The narrative says anyone can win a set, and favourites get nervous under the lights. This time, the aggregate data agrees.
We analysed 508 US Open main-draw matches from 2022 to 2025 (127 per edition) using verified pre-match bookmaker odds from our ATP match database. The bookmaker's favourite — the player with the lower decimal odds — won 70.9% of matches with a clear price edge (359 wins from 506 matches).
That puts the US Open in the softest tier of Grand Slam predictability, essentially level with the Australian Open (70.6%) and clearly below Roland Garros (74.6%) and Wimbledon (74.7%) on the same 2022–2025 odds basis.
Key takeaways for US Open 2026:
- Favourite win rate: 70.9% (2022–2025) — among the softest Slams, level with Melbourne
- Quarter-final chalk: only 50% — treat QF favourites as a coin flip, not R3 logic
- Match shape: 46.9% straight sets, 18.1% five-setters (fewest among majors), 43.5% touch a tiebreak
- Contenders by win rate: Alcaraz 90.9%, Djokovic 87.5%, Sinner 87.0%, Tiafoe 80.0%
- Live edge: track daily probs on the prediction dashboard during the fortnight
This preview breaks down round-by-round favourite performance, set and tiebreak patterns, games-per-set context, market calibration by price band, upset windows, and 2026 contender fingerprints. For the broader majors framework, see our Grand Slam betting guide and the tournament guides hub.
Why Flushing Meadows hard courts play differently
The US Open is not “just another hard court.” It is a best-of-five outdoor hard major at the end of a long summer swing (often after Toronto/Montreal and Cincinnati), played in New York heat and humidity, with heavy night-session volume on Arthur Ashe.
What that means for predictions:
- Best-of-five still favours quality over time — but New York’s night crowds and conditions add variance that clay majors dampen less dramatically than people assume.
- Outdoor hard sits between grass serve lottery and clay grind: more decisive closings than Melbourne in our set data, more upset room than Wimbledon on favourite conversion.
- Scheduling and fatigue matter: players arriving from the North American hard-court swing carry different energy profiles than they do in January at the Australian Open.
The sections below stay on the numbers — favourite conversion, rounds, sets, and contender win rates — so you can price US Open 2026 matches with surface context, not vibes alone. For stake sizing around those edges, see our value betting guide and bankroll management article.
US Open vs the other Grand Slams: favourite win rates
The headline number for Flushing Meadows: 70.9% bookmaker-favourite win rate (2022–2025). That is about four points below Wimbledon and Roland Garros — a structural gap, not a one-year blip.
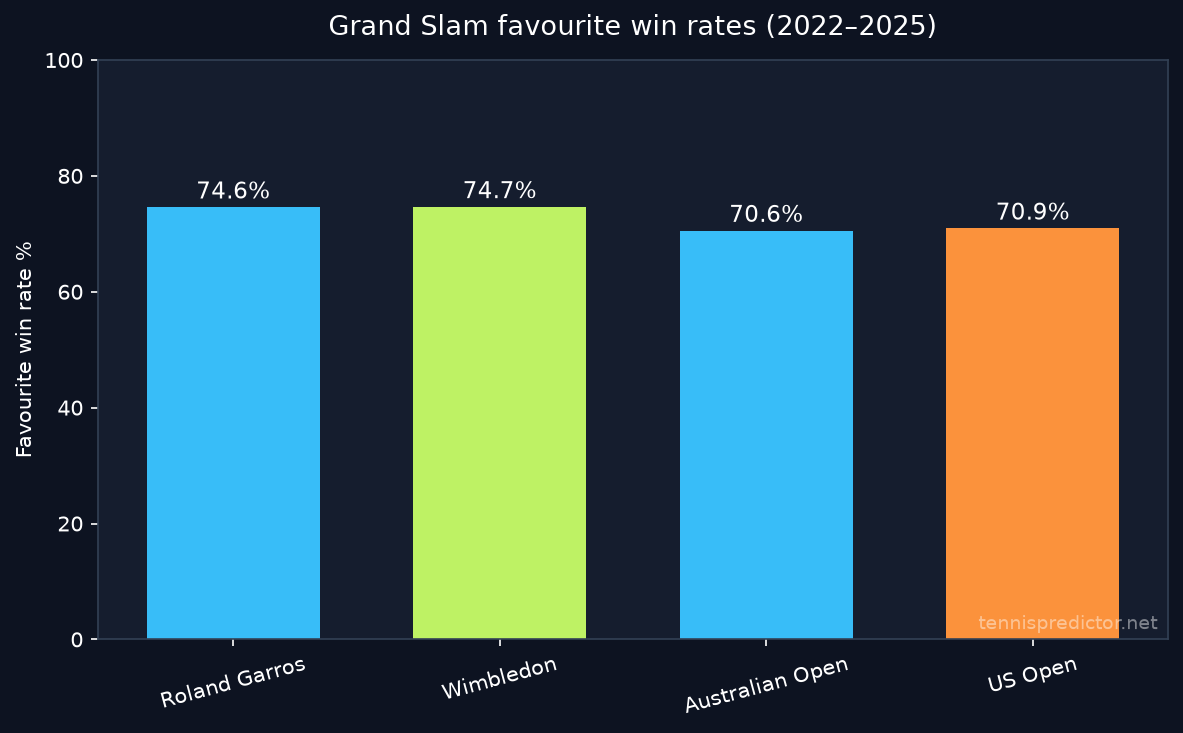 Figure 1: Favourite win rates across Grand Slams (2022–2025, bookmaker odds).
Favourite win rates (2022–2025, bookmaker odds):
- Wimbledon: 74.7%
- Roland Garros: 74.6%
- US Open: 70.9%
- Australian Open: 70.6%
Year-by-year inside New York, the pattern is stable: 70.9% (2022), 70.1% (2023), 73.2% (2024), and 69.6% (2025). Roughly three in ten priced matches produce an upset — consistently higher than the grass and clay majors.
What this means for betting: fading chalk as a default strategy at the US Open is still a losing long-run play (70.9% is still well above a coin flip). But blindly backing every favourite is weaker here than at Wimbledon or Paris. Edge comes from where favourites break — especially the quarter-finals — and from price bands that systematically underconvert.
US Open quarter-final upset rate and round-by-round chalk
The 70.9% aggregate hides a round profile that differs sharply from Wimbledon’s. Favourites are softest in the first round, peak in the third round, then flatten in the quarter-finals.
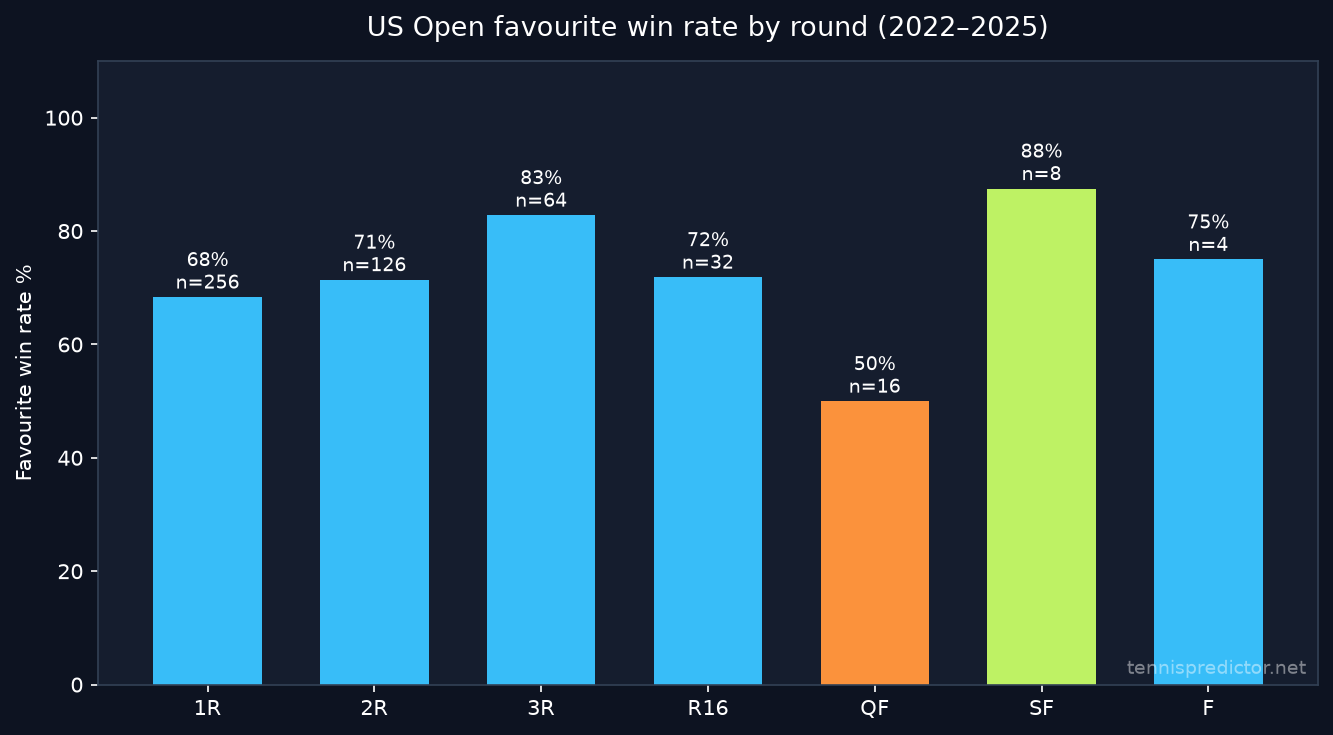 Figure 2: Favourite win rate by round at the US Open (2022–2025, bookmaker odds).
Favourite win rate by round (2022–2025):
- First round (1R): 68.4% (175 wins from 256 matches)
- Second round (2R): 71.4% (90 wins from 126 matches)
- Third round (3R): 82.8% (53 wins from 64 matches)
- Round of 16 (R16): 71.9% (23 wins from 32 matches)
- Quarterfinals (QF): 50.0% (8 wins from 16 matches)
- Semifinals (SF): 87.5% (7 wins from 8 matches)
- Final (F): 75.0% (3 wins from 4 matches — small sample)
What the round profile means:
- First round (68.4%) is the softest opening-week chalk zone — night sessions, travel, and dangerous first-week hard-court specialists all show up here.
- Third round (82.8%) is the peak predictability window — once the draw filters early noise, priced favourites close at elite rates.
- Quarter-finals (50.0%, n=16) is the standout US Open signal: favourites are a coin flip across four editions. Treat QF chalk as a separate market, not an extension of R3 logic.
- Finals (75%, n=4) includes three chalk titles (2022–2024) and the 2025 final where Sinner was favourite (~1.77) and lost to Alcaraz (~2.07). Sample size is tiny — do not overfit.
US Open set distribution: fewer five-setters than Melbourne
Hard-court majors are not identical. The US Open produces more straight-set finishes and fewer five-setters than the Australian Open over the same window — useful context for set betting and match-total markets.
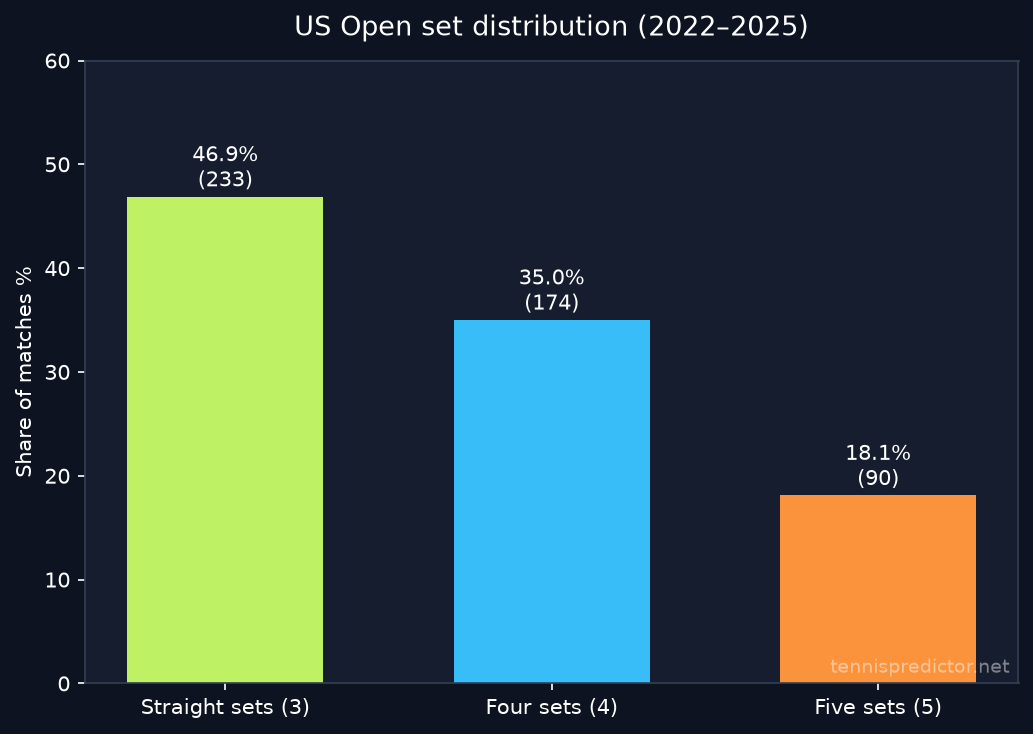 Figure 3: Share of completed US Open matches by total sets played (2022–2025).
US Open set distribution (497 completed matches, 2022–2025):
- Straight sets (3): 46.9% — 233 matches
- Four sets (4): 35.0% — 174 matches
- Five sets (5): 18.1% — 90 matches
Grand Slam comparison (same period):
| Tournament | Straight sets | Four sets | Five sets |
|---|---|---|---|
| US Open | 46.9% | 35.0% | 18.1% |
| Roland Garros | 45.7% | 33.2% | 21.1% |
| Wimbledon | 45.0% | 33.5% | 21.6% |
| Australian Open | 40.8% | 35.6% | 23.6% |
Flushing Meadows sits at the efficient end of the Slam spectrum: the fewest five-setters (18.1%) and the highest straight-set share (46.9%). When a clear favourite is priced correctly in rounds 3–R16, the data supports three- or four-set resolutions more often than a mandatory decider grind.
Practical angle: pair this with first-set closeout research — US Open favourites who take set one close at high rates historically. In our Flushing Meadows sample, the eventual match winner had already taken set one in 71.5% of completed matches (363 of 508 scored matches).
Games per set and tiebreaks at the US Open
Knowing whether a match ends in three, four, or five sets is only half the picture for totals and handicap markets. Across 2022–2025, US Open sets average ~9.49 games in our cross-Slam parse — above Roland Garros (~9.37) and below Wimbledon (~9.80) and the Australian Open (~9.60).
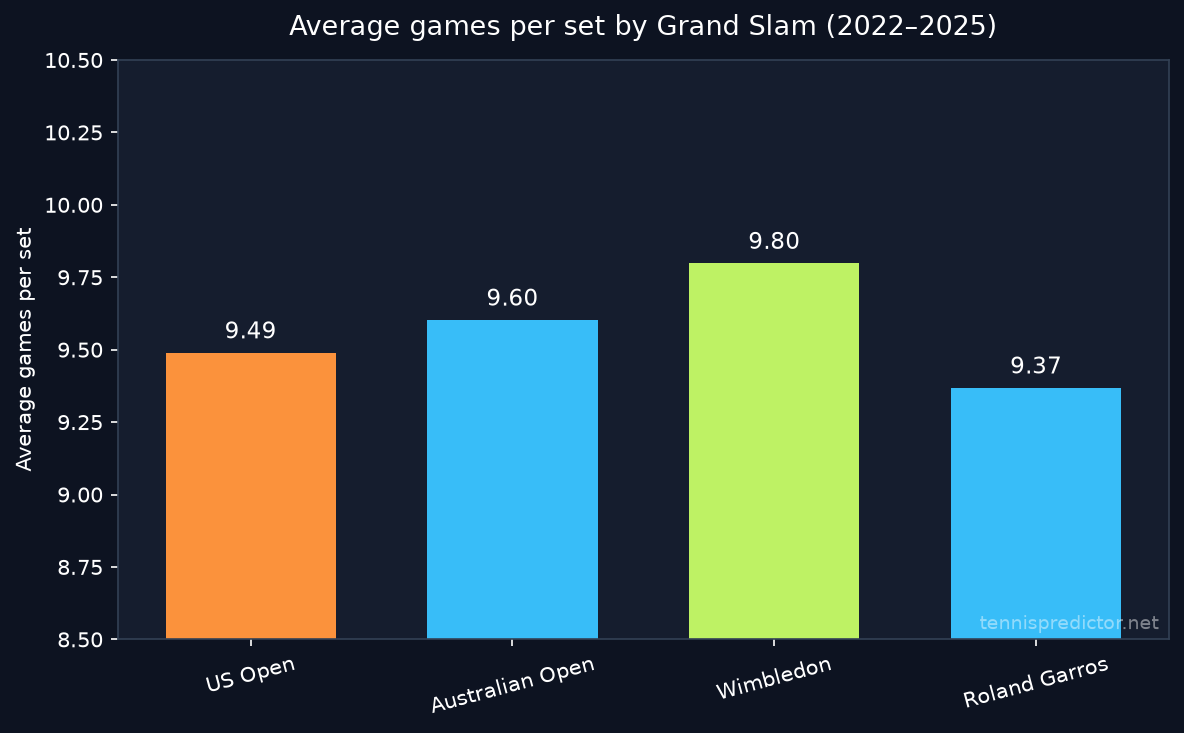 Figure 4: Average games per set by Grand Slam (2022–2025).
Tiebreak frequency (completed matches, 2022–2025):
- At least one tiebreak set in the scoreline: 43.5% (216 of 497)
That is lower than Wimbledon’s grass-driven ~48% range, but still nearly half of all completed matches touch a breaker. Factor tiebreaks into set betting and live models — a correct match-winner lean can still ride a volatile path under the Ashe lights.
Do US Open favourites beat the odds?
We split 2022–2025 US Open matches with odds into four price bands and compared implied probability to actual win rate:
Favourite win rate by pre-match odds bracket:
- Heavy favourites (1.01–1.20): market implied ~92.5%, actual 91.4% (148 of 162)
- Strong favourites (1.20–1.40): implied ~77.6%, actual 71.1% (106 of 149)
- Clear favourites (1.40–1.70): implied ~65.4%, actual 56.5% (78 of 138)
- Marginal favourites (1.70–2.20): implied ~55.8%, actual 47.4% (27 of 57)
Two takeaways:
- Clear favourites (1.40–1.70) are the leak. A ~9-point underconversion versus implied probability is the sharpest mid-band signal — this is where “should win” seeds get exposed in week one and in QF setups.
- Strong favourites (1.20–1.40) also underconvert (71.1% vs ~78% implied) — another band to scrutinise before blindly backing seeds.
- Heavy favourites are roughly fair (91.4% vs ~92.5% implied). Short chalk still wins often; the edge is not systematically fading every 1.10 favourite.
Combined with the 50% QF favourite rate, the practical filter is: be most sceptical of mid-priced chalk in volatile rounds, not of every favourite on the board. That is classic value betting territory — price vs conversion, not narrative.
US Open 2026 contenders: win rates at Flushing Meadows
Win rates below use completed main-draw matches from 2022–2025 (minimum eight matches for the chart cohort).
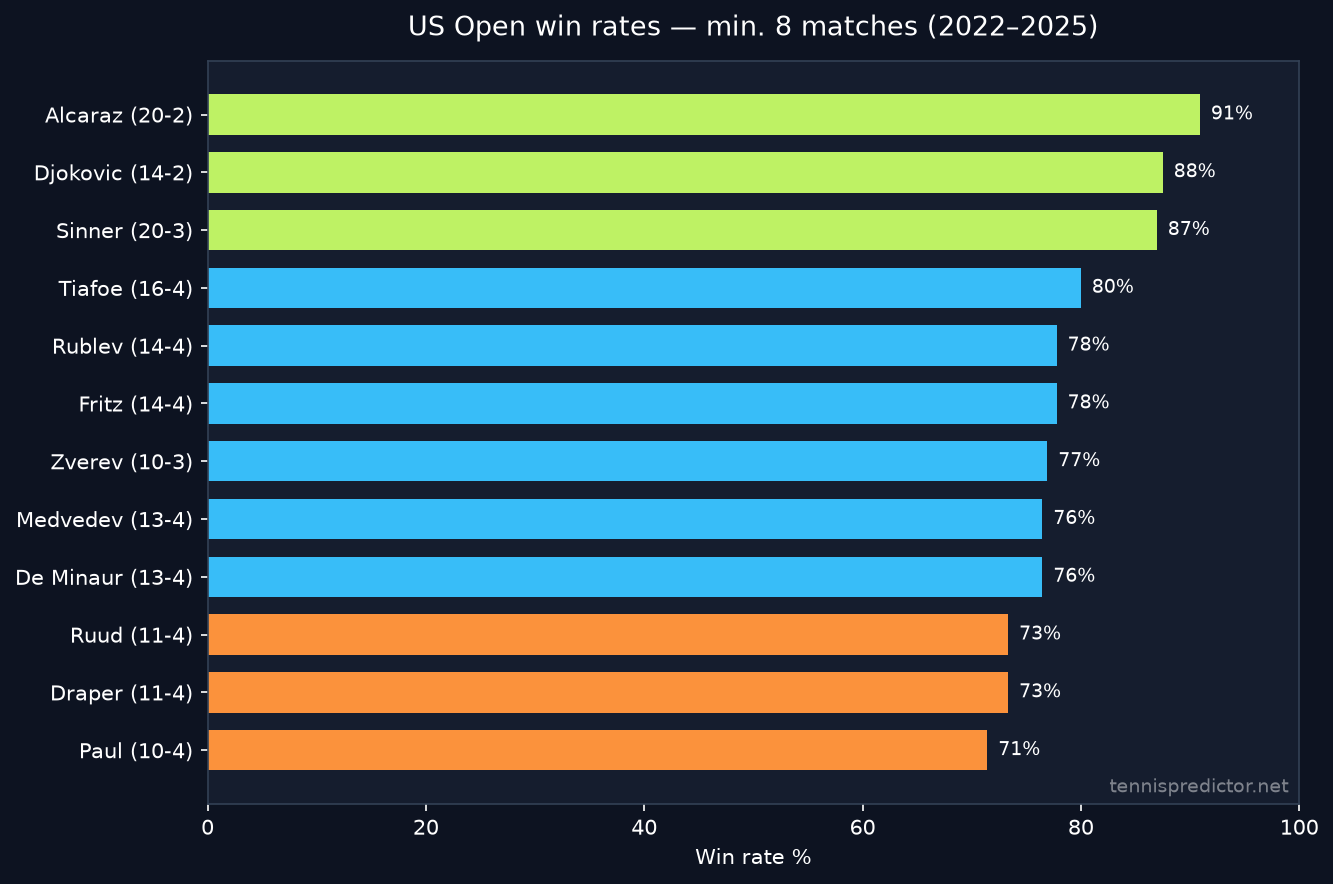 Figure 5: US Open win rates for players with at least eight matches (2022–2025).
Carlos Alcaraz — two-time champion (2022, 2025)
US Open record (2022–2025): 20W-2L (90.9%) across 22 matches.
Alcaraz owns the best raw win rate in the four-year sample and bookends the window with titles (beat Ruud in 2022; beat favourite Sinner in 2025). His hard-court peak profile aligns with New York’s best-of-five demands — see our Alcaraz player analysis for surface splits beyond the Slam.
Jannik Sinner — 2024 champion
US Open record (2022–2025): 20W-3L (87.0%) across 23 matches.
Sinner’s 2024 title run (final vs Fritz) and deep consistent weeks put him in the same elite band as Alcaraz and Djokovic. The 2025 final loss as market favourite is the main recent scar — volume and conversion still support him as a core outright pillar. Broader hard-court context: Sinner player analysis.
Novak Djokovic — 2023 champion
US Open record (2022–2025): 14W-2L (87.5%) across 16 matches.
Fewer matches than Alcaraz/Sinner in the window, but the same elite conversion band. The 2023 title (vs Medvedev) remains the fingerprint; age and scheduling are the variables the historical table cannot fully price. Profile: Djokovic player analysis.
Frances Tiafoe — home hard-court volume
US Open record (2022–2025): 16W-4L (80.0%) across 20 matches.
Tiafoe’s New York win rate sits clearly above typical top-20 Slam conversion — crowd, surface familiarity, and best-of-five resilience show up in the aggregate. Treat him as a path-dependent contender: strong when the draw opens, still a step below the 87–91% elite band. Profile: Tiafoe player analysis.
Taylor Fritz and Andrey Rublev — deep-run Americans / clay-hard hybrids
Fritz: 14W-4L (77.8%) · Rublev: 14W-4L (77.8%) — both across 18 matches.
Fritz reached the 2024 final; Rublev’s US Open volume is steady without a final in this window. Both clear the “reliable second-week” bar without entering the Alcaraz/Sinner/Djokovic tier. Profiles: Fritz and related hard-court form checks on the dashboard.
Daniil Medvedev and Alexander Zverev
Medvedev: 13W-4L (76.5%) across 17 matches · Zverev: 10W-3L (76.9%) across 13 matches.
Medvedev’s 2023 final keeps him in the conversation; Zverev’s smaller sample still lands in the mid-70s. Neither matches the 90%+ elite band — price them as dangerous quarter-finalists, not automatic chalk closers. Medvedev profile: Medvedev player analysis.
Recent champions (quick reference)
| Year | Champion | Finalist | Score |
|---|---|---|---|
| 2022 | Alcaraz | Ruud | 6-4, 2-6, 7-6, 6-3 |
| 2023 | Djokovic | Medvedev | 6-3, 7-6, 6-3 |
| 2024 | Sinner | Fritz | 6-3, 6-4, 7-5 |
| 2025 | Alcaraz | Sinner | 6-2, 3-6, 6-1, 6-4 |
Three different champions across four years — yet the same three names (Alcaraz, Sinner, Djokovic) dominate the win-rate table. Outright markets should still centre on that trio unless fitness or draw shocks intervene.
Prediction strategy for US Open 2026
Three data-backed principles for Flushing Meadows:
1. Respect that this is among the softest Slams for chalk — without turning every favourite into a fade.
At 70.9% (2022–2025 odds), the US Open leaves more room for underdogs than Wimbledon or Roland Garros. Upsets are real (~29% of priced matches) but still a minority. Systematic favourite fades lose; selective fades in QF and 1.20–1.70 prices are where the data concentrates.
2. Lean into third-round chalk; treat quarter-finals as a different sport.
82.8% favourite win rate in R3 is the strongest round-level hold. 50.0% in QF is the strongest round-level warning. Do not copy-paste R3 confidence into QF tickets.
3. Use set and tiebreak data to size stakes — not just match winner.
With 46.9% straight sets, 18.1% five-setters, and 43.5% of matches touching a tiebreak, New York is efficient but not quiet. Highest confidence maps to aligned hard-court profiles + strong favourite odds + rounds 3–R16, not to every seeded player in round 1.
Track live probabilities on our tennis prediction dashboard throughout the fortnight — predictions refresh using the same hybrid pipeline behind these Slam guides. Pair match picks with disciplined bankroll management so a soft QF chalk miss does not blow the week.
Frequently asked questions
How predictable is the US Open compared to other Grand Slams?
On 2022–2025 bookmaker odds, the US Open’s favourite win rate (70.9%) sits with the Australian Open (70.6%) in the softest tier — below Roland Garros (74.6%) and Wimbledon (74.7%). It is among the most upset-prone Slams in our sample, not the least.
Is the US Open good for underdog betting?
Selectively, yes. About 29% of priced matches are upsets, and quarter-final favourites win only half the time. That supports targeted underdog (or favorite-fade) spots in QF and in the 1.20–1.70 odds bands — not a blanket “bet every dog” approach. Heavy favourites still convert near their price (~91%).
US Open vs Wimbledon: which is more predictable?
Wimbledon. On the same 2022–2025 odds window, Wimbledon favourites win 74.7% versus 70.9% at the US Open. Grass at SW19 is more chalky in our sample than New York outdoor hard, despite the “upset Slam” reputation often attached to Flushing Meadows.
Who is the US Open 2026 favourite in the data?
Historical Flushing Meadows win rates point first to Carlos Alcaraz (90.9%, two titles in 2022–2025), then Novak Djokovic (87.5%) and Jannik Sinner (87.0%, 2024 champion). Live outright odds will move with fitness and draw; use the dashboard once the 2026 main draw is priced.
When does the US Open 2026 usually take place?
The US Open is traditionally played from late August through early September at the USTA Billie Jean King National Tennis Center in Flushing Meadows, New York. Exact 2026 session times and the day-by-day order of play are published closer to the event — we surface match-level probabilities on the dashboard as the schedule locks in.
Where do favourites struggle most?
The quarter-finals: favourites won exactly 50.0% of QF matches (8 of 16) from 2022–2025. The first round (68.4%) is the softest early-round window. The third round (82.8%) is the peak chalk hold.
How often do US Open matches go to five sets?
18.1% of completed matches from 2022–2025 (90 of 497) — the lowest five-set rate among the four Grand Slams. Straight-set wins account for 46.9%.
How common are tiebreaks at the US Open?
43.5% of completed matches included at least one tiebreak set in the scoreline (216 of 497). Tiebreaks are frequent enough to matter for set markets and live betting, even though New York trails Wimbledon’s grass breaker rate.
Who does the data favour for US Open 2026?
Carlos Alcaraz (90.9% US Open win rate, 2022–2025, two titles in the window) leads the historical sample. Jannik Sinner (87.0%, 2024 champion) and Novak Djokovic (87.5%, 2023 champion) sit in the same elite band. Frances Tiafoe (80.0%) is the clearest home hard-court volume play outside that trio.
How did 2025 change the favourite picture?
2025 favourite win rate was 69.6% (87 of 125 priced matches) — in line with 2022–2024. The 2025 final is the headline upset on price: Sinner opened as favourite and lost to Alcaraz. Including 2025 softens the QF chalk rate from the extreme 2022–2024 subsample toward a still-warning 50%.
Where can I get US Open 2026 match predictions?
Daily win probabilities and confidence scores for every scheduled match are on our live prediction dashboard. For methodology, see our algorithm hub and the companion Slam previews for Wimbledon, Roland Garros, and the Australian Open. More tournament guides live under /en/blog/category/tournament-guides/.
Data: 508 US Open main-draw matches (2022–2025) from TennisPredictor's ATP match database with verified pre-match odds. Favourite = lower decimal odds (ties excluded). Round and set statistics use completed matches; odds-based statistics use matches with both sides priced.
See today's match predictions with confidence scores and value signals.
View Live Predictionsarrow_forwardRelated Articles
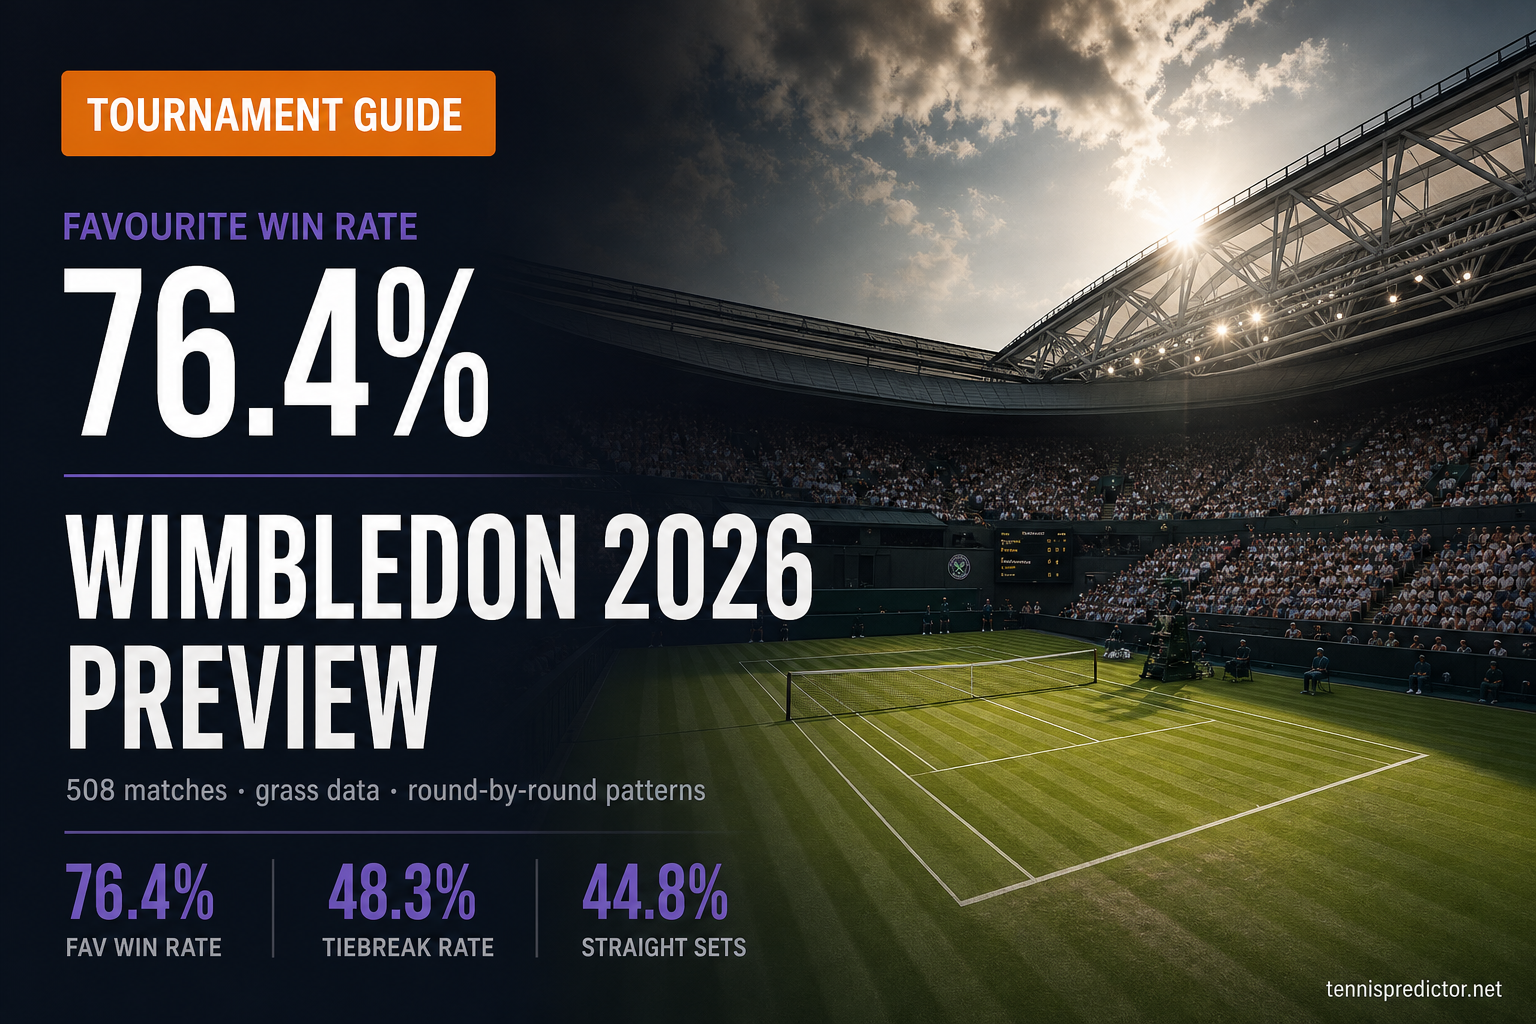
Wimbledon 2026 betting preview: what 4 years of grass-court data reveals
Wimbledon is not the upset lottery many bettors assume. Our analysis of 508 main-draw matches (2022-2025) shows a 76.4% bookmaker-favourite win rate — with clear round-by-round patterns, set distributions, and tiebreak tendencies that shape every grass prediction.
June 17, 2026 · 16 min read
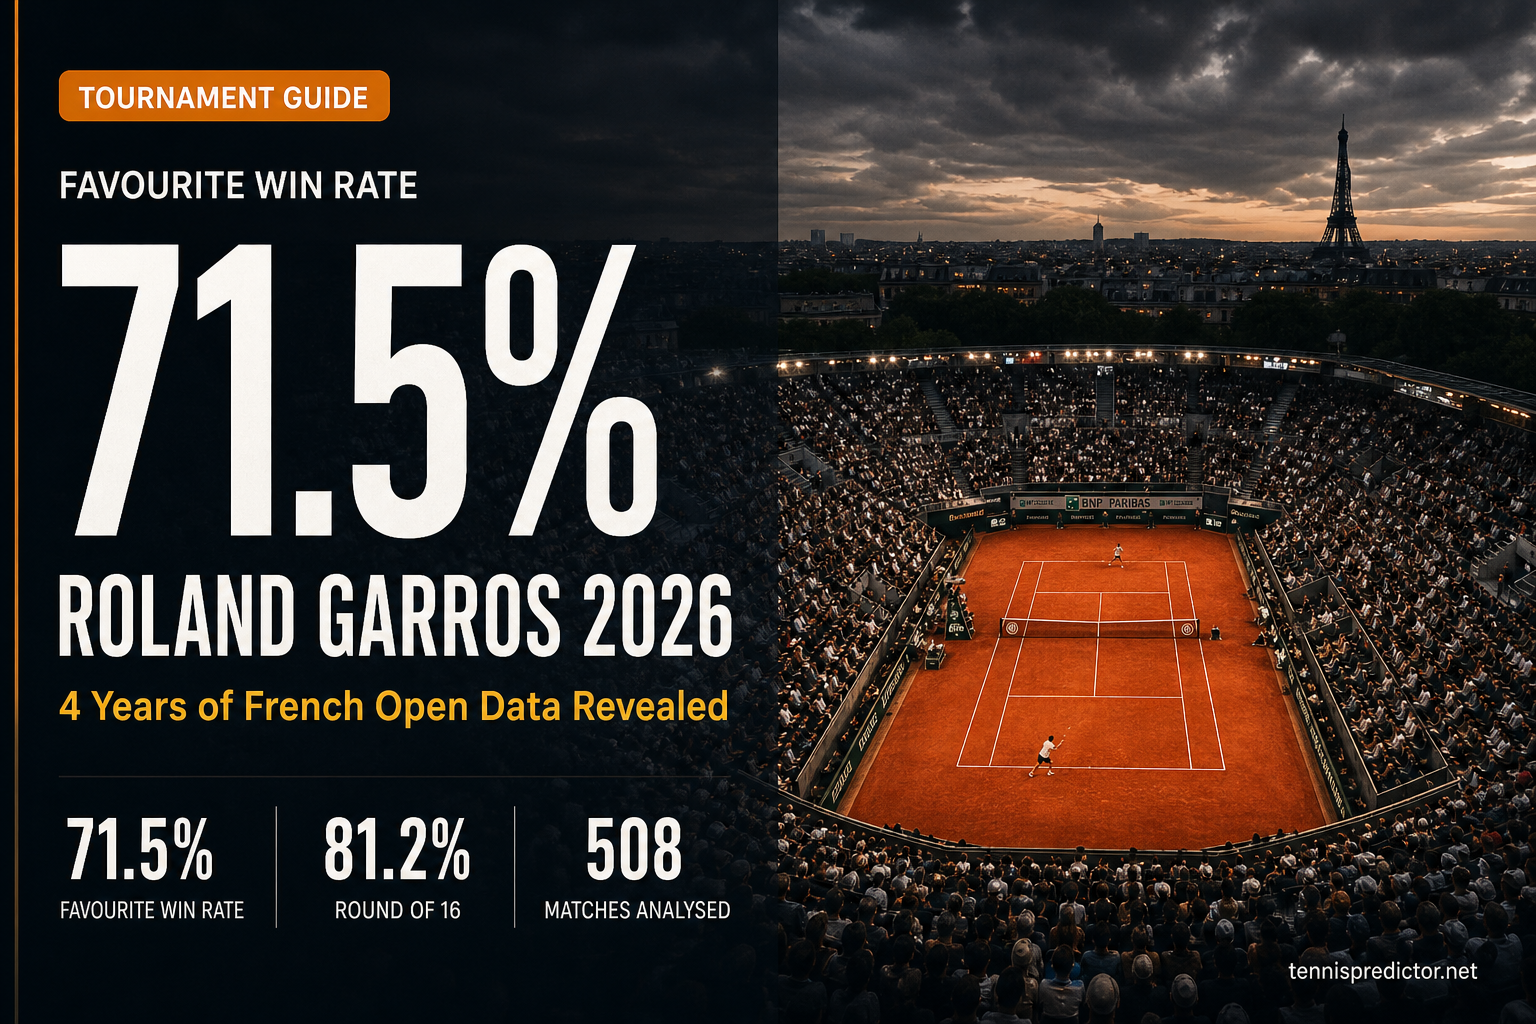
Roland Garros 2026 betting preview: what 4 years of French Open data reveals
Roland Garros is not the upset factory bettors assume. Our analysis of 508 French Open matches (2022-2025) reveals a 71.5% favourite win rate — higher than Wimbledon and the US Open. Here is what the data says about clay's biggest prize.
May 4, 2026 · 17 min read
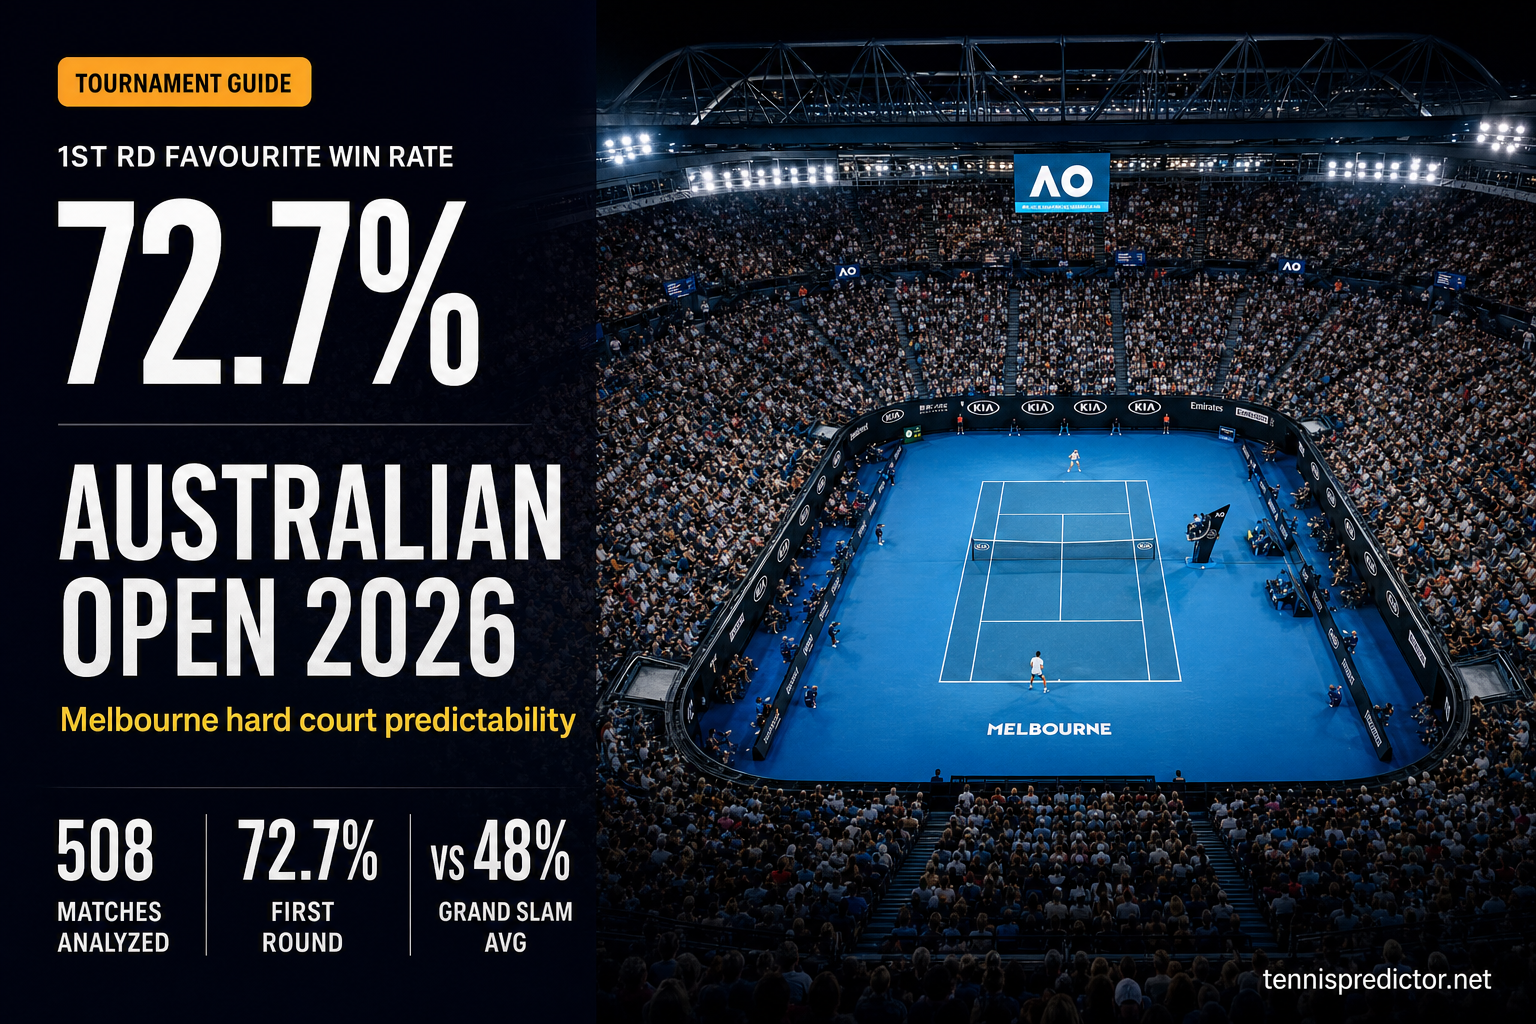
Australian Open 2026 betting preview: hard court predictability & champion predictions
The Australian Open kicks off the Grand Slam calendar each January, and Melbourne Park's hard courts set the stage for two weeks of high-stakes tennis. Our prediction engine has analyzed 508 matches from the 2022-2025 Australian Opens, and the data reveals a surprising pattern: unlike other Grand Slams where early rounds are coin tosses, Melbourne Park favors favorites more than any other major.
January 13, 2026 · 12 min read
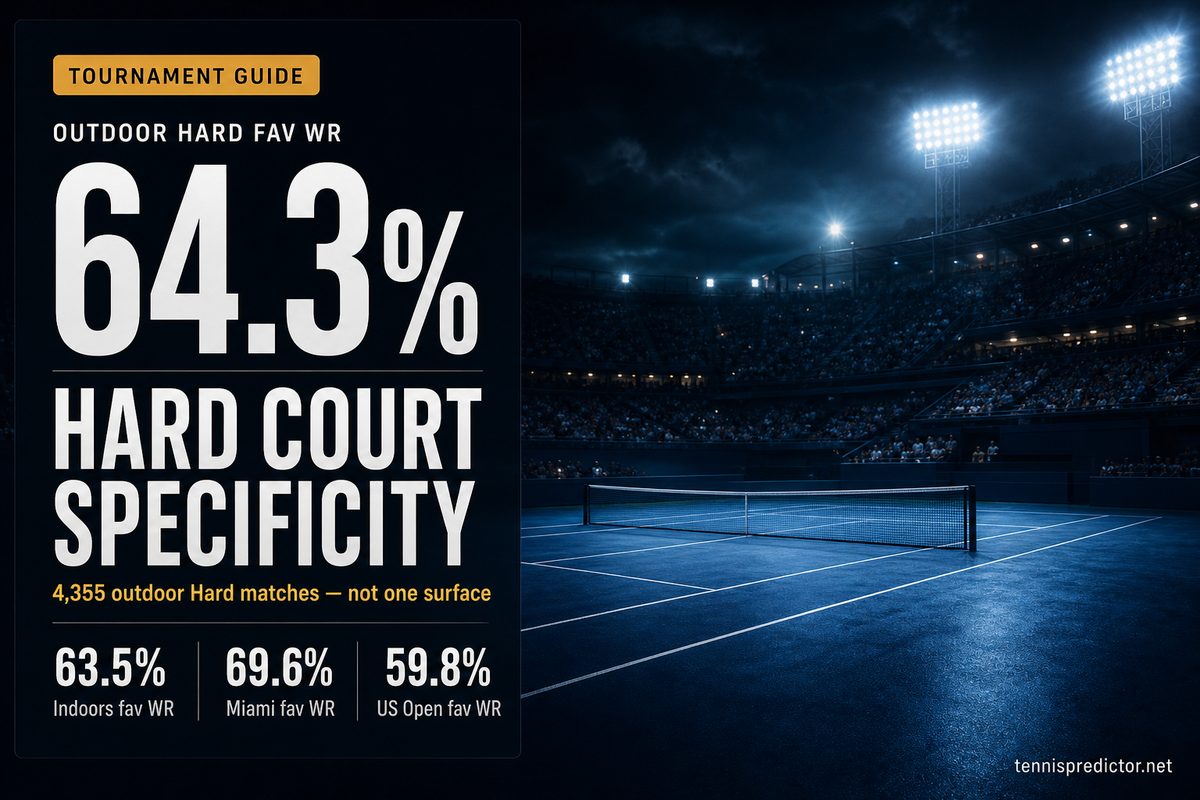
ATP hard courts are not one surface: what 4,355 matches show
Hard courts are treated as tennis’s neutral baseline — the surface where “real” form shows. Our 2022–2025 ATP cache says otherwise: outdoor Hard and Indoors are different animals, Miami favourites hold far more often than US Open chalk, and clay specialists can lose 30+ points transferring north.
September 4, 2026 · 14 min read