Wimbledon 2026 betting preview: what 4 years of grass-court data reveals
The grass myth: Wimbledon is more predictable than you think
Every June, the same narrative returns: grass is volatile, serve dominates, and Wimbledon is an upset minefield. The story sounds right — low bounces, tiebreaks, big servers — but the aggregate data tells a different story.
We analysed 508 Wimbledon main-draw matches from 2022 to 2025 (127 per edition) using verified pre-match bookmaker odds from our ATP match database. The bookmaker's favourite — the player with the lower decimal odds — won 76.4% of matches in the 2022–2024 window where odds coverage is complete (291 wins from 381 matches with prices).
That makes Wimbledon more predictable than the US Open (71.4% favourite win rate on the same 2022–2024 odds basis) and roughly level with the Australian Open (74.5%). Roland Garros sits slightly higher at 76.0% in the same comparison window. Grass is specialist terrain — but at Wimbledon itself, the market favourite holds far more often than on other grass events (64.6% outside SW19).
This preview breaks down round-by-round favourite performance, set and tiebreak patterns, games-per-set distribution, upset windows, grass-specialist signals, and 2026 contender fingerprints — the same framework we used for our Roland Garros 2026 betting preview, applied to the Championships.
Wimbledon vs the other Grand Slams: favourite win rates
The single headline number for SW19: 76.4% bookmaker-favourite win rate (2022–2024). That places Wimbledon in the upper tier of Grand Slam predictability — not a coin-flip tournament once prices are on the board.
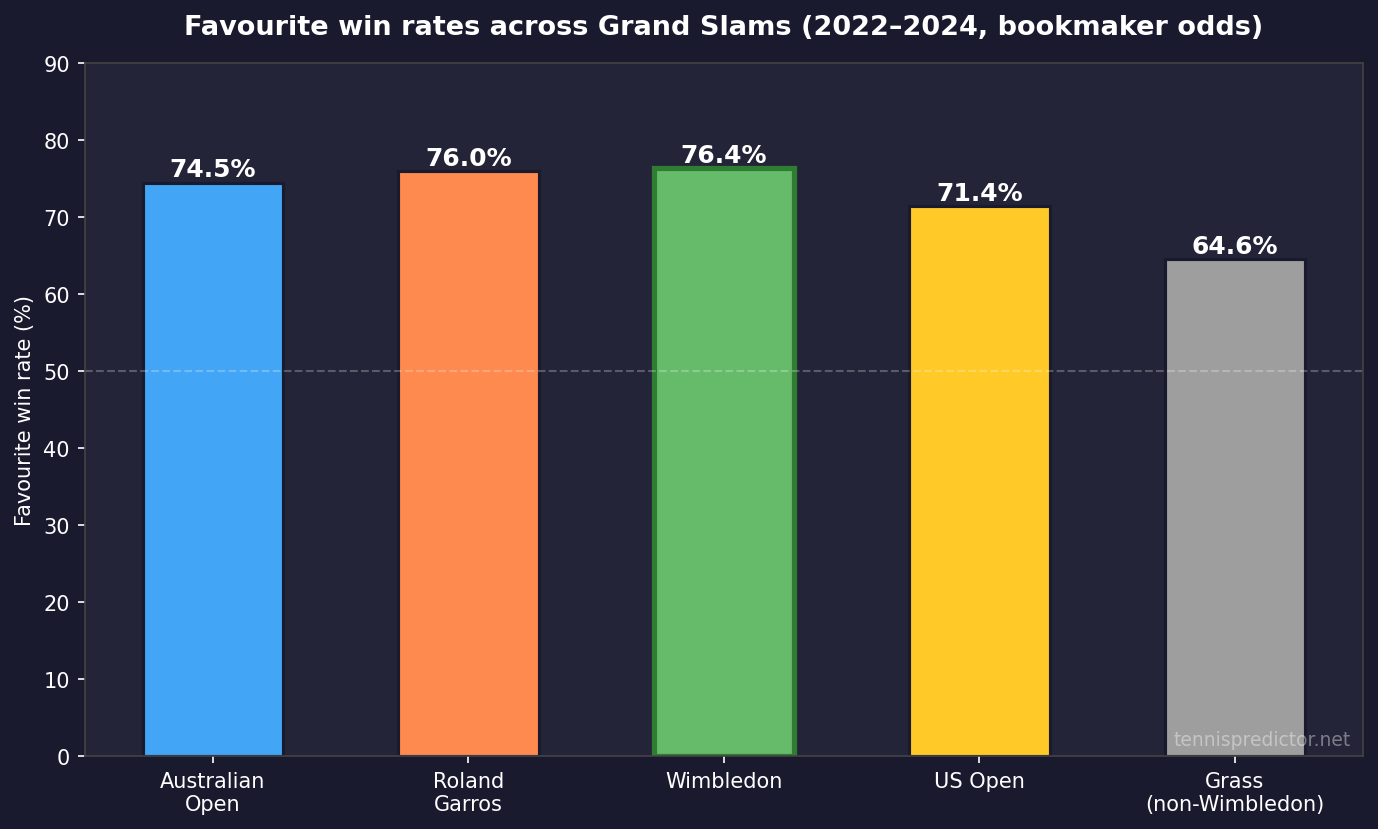 Figure 1: Favourite win rates across Grand Slams and non-Wimbledon grass (2022–2024, bookmaker odds).
Favourite win rates (2022–2024, bookmaker odds):
- Roland Garros: 76.0%
- Wimbledon: 76.4%
- Australian Open: 74.5%
- US Open: 71.4%
- Other ATP grass events: 64.6%
The gap between Wimbledon (76.4%) and other grass (64.6%) is the grass-specialist story in one number. Queen's Club, Halle, Eastbourne, and the rest of the grass swing carry more variance — thinner draws, shorter formats, and fewer five-set marathons. Wimbledon compresses skill gaps over best-of-five: the better player (as priced) wins more often on Centre Court than on the broader grass calendar.
For broader grass mechanics — surface win rates, specialists vs all-court players — see our grass court specificity guide.
Round-by-round: where favourites hold and where upsets cluster
The 76.4% aggregate hides a clear round profile. Favourites are weakest in the second round, surge in the third round, and peak again from the quarter-finals through the semi-finals.
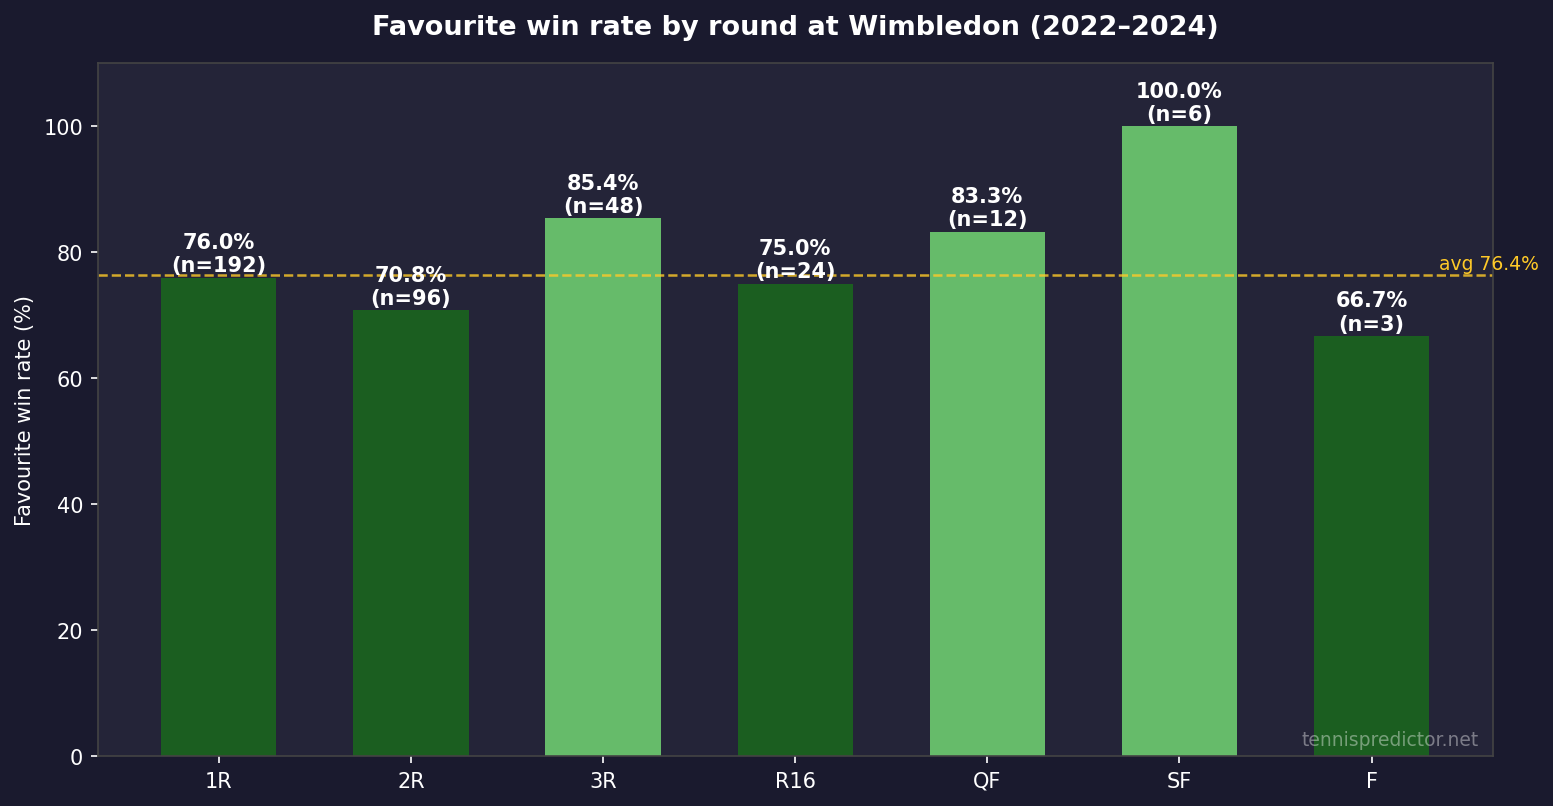 Figure 2: Favourite win rate by round at Wimbledon (2022–2024, bookmaker odds).
Favourite win rate by round (2022–2024):
- First round (1R): 76.0% (146 wins from 192 matches)
- Second round (2R): 70.8% (68 wins from 96 matches)
- Third round (3R): 85.4% (41 wins from 48 matches)
- Round of 16 (R16): 75.0% (18 wins from 24 matches)
- Quarterfinals (QF): 83.3% (10 wins from 12 matches)
- Semifinals (SF): 100.0% (6 wins from 6 matches)
- Final (F): 66.7% (2 wins from 3 matches — small sample)
What the round profile means:
- Second round (70.8%) is the softest chalk zone in the first week — often where a seeded favourite meets a dangerous grass player coming off a strong opening win.
- Third round (85.4%) is the peak predictability window in our sample — the draw has filtered out early noise, but prices have not always caught up.
- Semi-finals (100%, n=6) is a tiny sample but reflects how evenly matched the final four still tend to be priced correctly — when two elite grass players meet, the market rarely misprices both sides.
- Finals (66.7%, n=3) are inherently high-variance; treat any single final as a separate prediction problem, not an extension of round-of-16 chalk logic.
Set distribution: how Wimbledon matches actually end
Grass is supposed to produce quick matches and tiebreak lottery tickets. The set-count data is more balanced: 44.8% of completed Wimbledon matches from 2022–2025 ended in straight sets, 33.4% went four sets, and 21.8% reached a fifth.
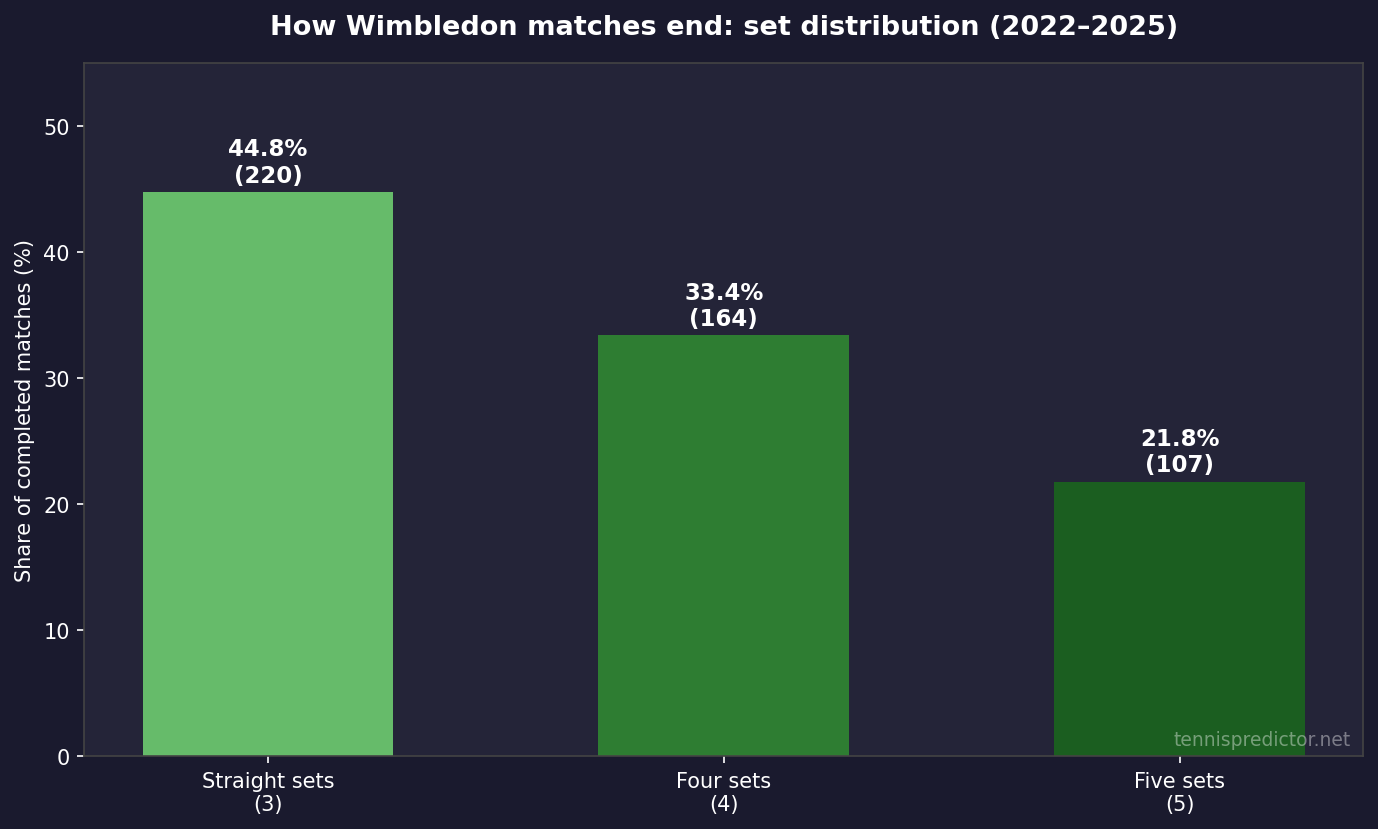 Figure 3: Share of completed Wimbledon matches by total sets played (2022–2025).
Wimbledon set distribution (491 completed matches, 2022–2025):
- Straight sets (3): 44.8% — 220 matches
- Four sets (4): 33.4% — 164 matches
- Five sets (5): 21.8% — 107 matches
Grand Slam comparison (same period):
| Tournament | Straight sets | Four sets | Five sets |
|---|---|---|---|
| Wimbledon | 44.8% | 33.4% | 21.8% |
| Roland Garros | 45.3% | 33.3% | 21.4% |
| US Open | 46.5% | 35.0% | 18.5% |
| Australian Open | 40.7% | 35.4% | 24.0% |
Wimbledon sits between the efficient US Open closings and the more extended Australian Open five-set rate. Grass does not automatically mean shorter matches — best-of-five structure and elite depth keep a meaningful 21.8% five-set share.
Practical angle: when our hybrid model flags a strong favourite in rounds 3–QF, the data supports straight-set or four-set resolutions more often than a mandatory five-set grind — useful context for set betting and for first-set markets where grass serve pressure is highest early.
Games per set: where grass pushes totals higher
Knowing whether a match ends in three, four, or five sets is only half the picture for totals and handicap markets. At Wimbledon, individual sets run longer on average than at the other Grand Slams in our sample.
We parsed 1,866 completed sets from 2022–2025 main-draw scores (excluding retirements and walkovers). The average set contained 10.03 games — above Roland Garros (9.55), the US Open (9.71), and the Australian Open (9.83).
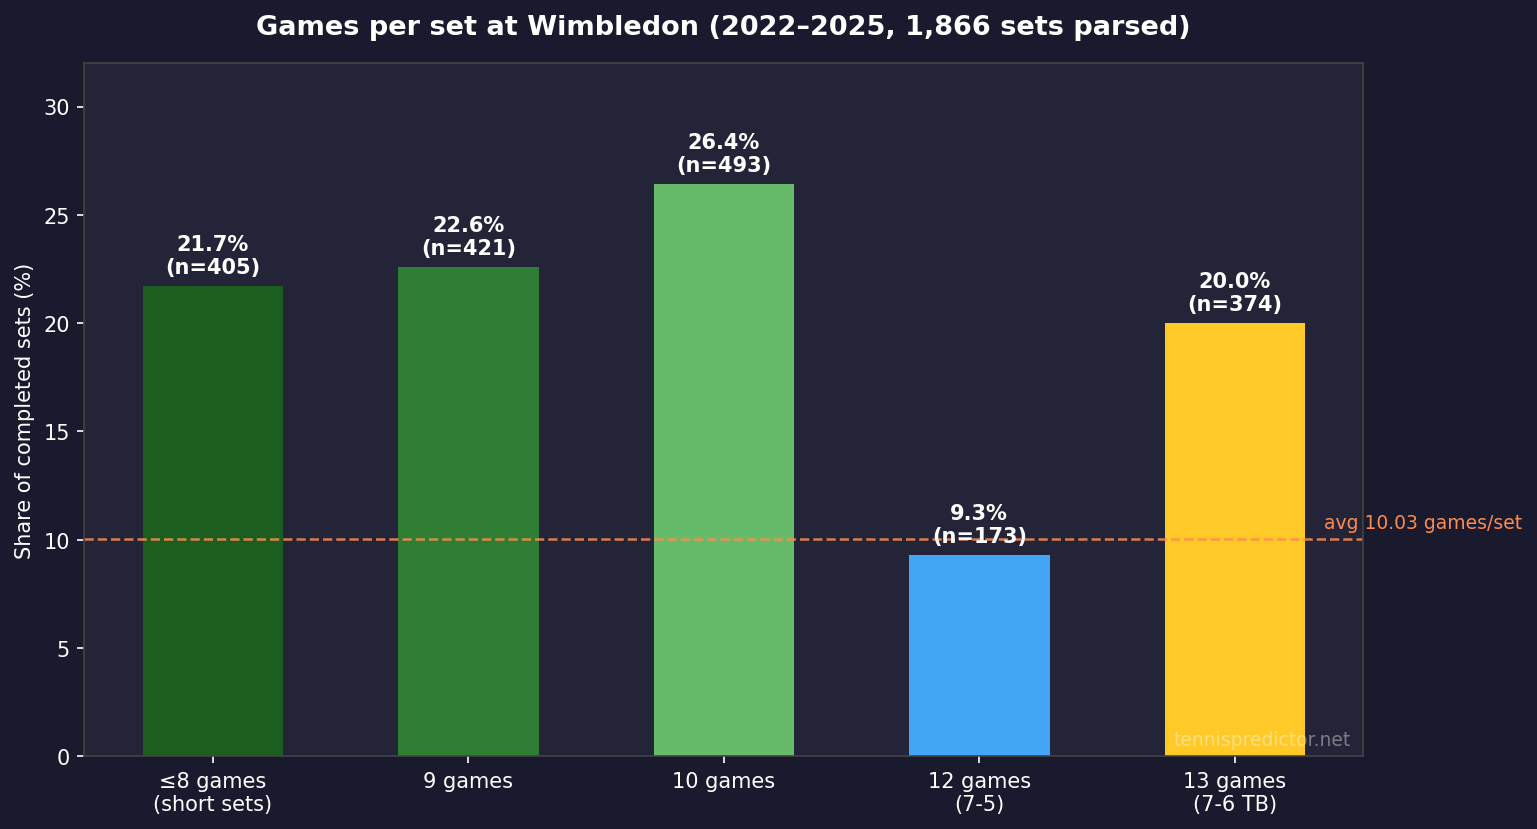 Figure 4: Share of completed Wimbledon sets by total games played (2022–2025).
Games per set distribution (1,866 sets, 2022–2025):
- ≤8 games (short sets): 21.7% — 405 sets
- 9 games: 22.6% — 421 sets
- 10 games: 26.4% — 493 sets — the single most common outcome
- 12 games (7–5): 9.3% — 173 sets
- 13 games (7–6 tiebreak): 20.0% — 374 sets
The 20.0% tiebreak-set share is the grass signature inside this distribution — nearly one in five sets at SW19 reaches 6–6 before a breaker decides it. Combined, 29.3% of sets land at 12 or 13 games (extended or tiebreak sets) versus 21.3% at Roland Garros on the same 2022–2025 window. That extra length is why grass matches can produce high game counts even when the favourite wins in straight sets — a pattern our first-set and totals analysis flags across the broader ATP sample.
Practical angle: when pricing over/under game lines, anchor to 10+ games per set as the baseline at SW19, not the clay-season 9.1–9.5 range. Favourites who dominate in ≤8-game sets (21.7% of the sample) are the natural under candidates; matchups between big servers skew toward 13-game tiebreak sets (20.0%).
Tiebreaks: nearly half of Wimbledon matches touch a breaker
Tiebreak frequency is where grass genuinely differs from clay. 48.3% of completed Wimbledon matches in our sample (237 of 491) included at least one tiebreak set in the scoreline.
That is not a marginal edge — it is a structural feature of grass tennis at SW19. Serve advantage, faster points, and fewer break opportunities push more sets to 6–6 than on slow clay.
What this means for predictions:
- A favourite who wins in straight sets may still have survived one or more tiebreaks — the match can look comfortable on paper while staying tight set-by-set.
- Tiebreak-heavy profiles favour strong servers and clutch returners — exactly the players our feature pipeline weights through first-set performance and hold/break proxies.
- Live markets often overreact to a lost tiebreak; the aggregate data says the match is still live if the favourite's grass profile remains intact.
Upset patterns: stable years vs incomplete 2025 odds
Upset rates — when the bookmaker's favourite loses — stayed in a tight band across the three fully priced years:
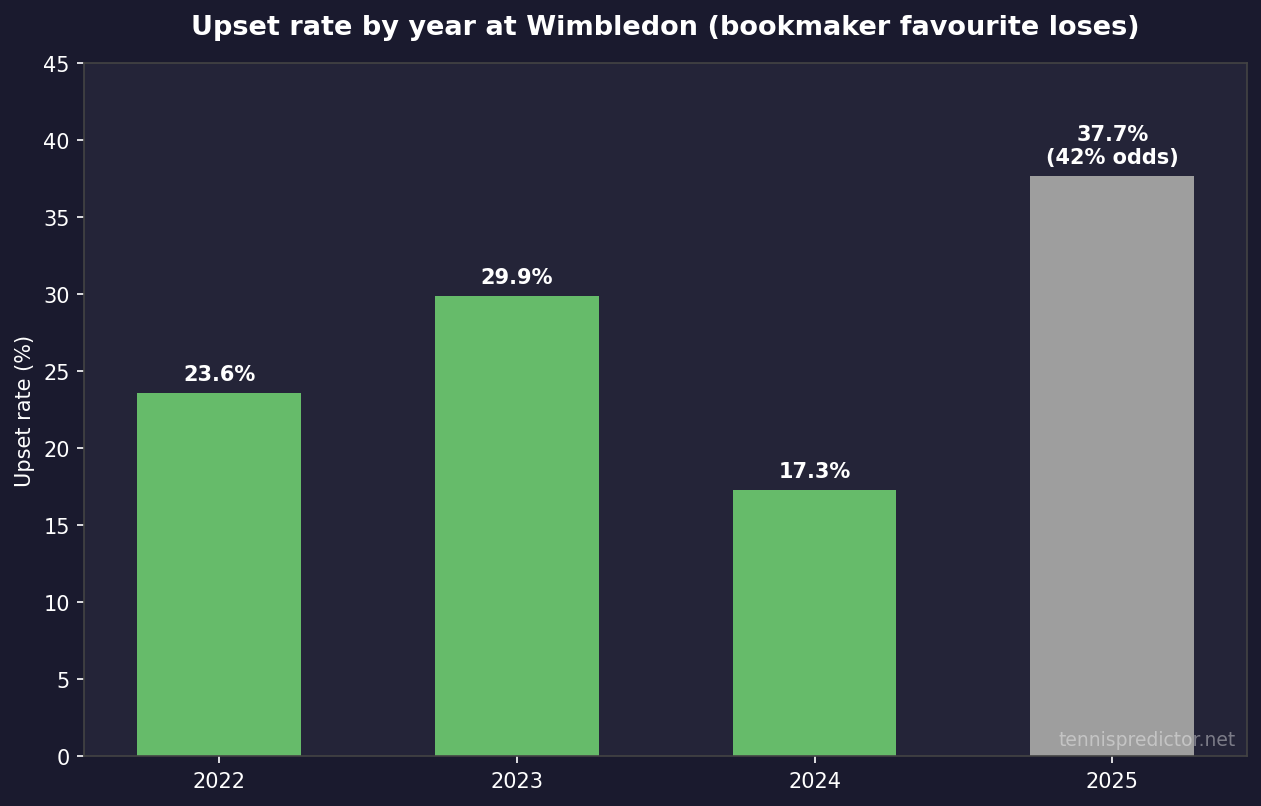 Figure 5: Upset rate by year (bookmaker favourite loses). Grey bar = incomplete odds coverage.
Upset rate by year (matches with odds only):
- 2022: 23.6% (30 upsets from 127 matches) — 100% odds coverage
- 2023: 29.9% (38 upsets from 127 matches) — 100% odds coverage
- 2024: 17.3% (22 upsets from 127 matches) — 100% odds coverage
- 2025: 37.7% (20 upsets from 53 matches with odds) — ⚠️ only 41.7% of main-draw matches had prices in our database
Treat 2025 upset statistics with caution. The headline 37.7% figure is based on 53 priced matches, not the full 127-match draw. For year-on-year upset comparisons, 2022–2024 is the reliable window — roughly one upset in every four matches at the median.
Upsets concentrate in rounds 1–2 where the favourite win rate dips to 70–76%. From the third round onward, the upset rate falls sharply as the 85.4% favourite win rate in R3 shows. For a general framework on when models miss favourites, see when prediction models fail.
The grass specialist signal: when surface history overrides the headline
Beyond the market price, the strongest grass-specific filter in our Wimbledon sample is the grass win-rate differential: when one player's historical grass win rate exceeds their opponent's by 15 percentage points or more (minimum five grass matches each in our database), the grass-stronger player won 89.2% of qualifying matches (132 wins from 148).
That is a sharper separator than the overall 76.4% favourite baseline — because it isolates surface-fit within the grass calendar, not just market consensus.
How to use it:
- Align grass edge with market favourite → high-confidence chalk spot (especially rounds 3–QF).
- Conflict — market favourite is the weaker grass player → genuine uncertainty; downgrade confidence even if the ranking gap looks large.
- Clay-first profiles entering SW19 cold remain the classic fade candidates unless price already reflects the surface mismatch.
This is the same logic our hybrid engine applies through surface-weighted features — explained in how our tennis prediction algorithm works.
Key contender fingerprints for Wimbledon 2026
Four years of main-draw data (2022–2025) produce stable Wimbledon win-rate fingerprints for the players most likely to contend in 2026. Minimum eight main-draw matches in the sample.
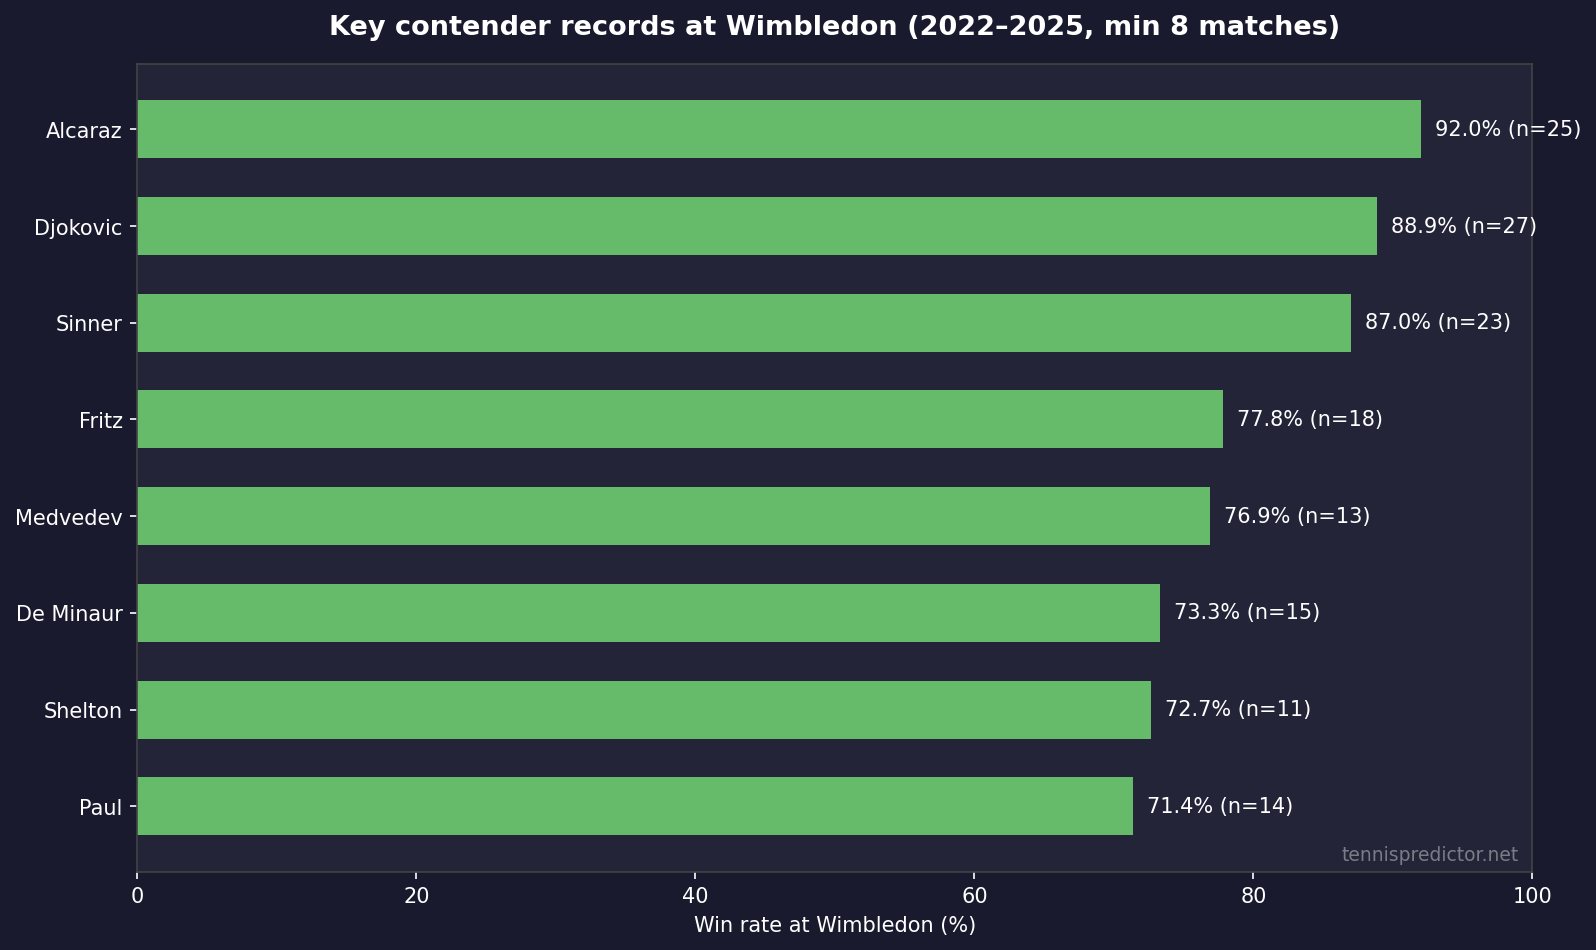 Figure 6: Win rates at Wimbledon (2022–2025) for players with at least eight main-draw matches.
Recent champions:
- 2022: Djokovic
- 2023: Alcaraz
- 2024: Alcaraz
- 2025: Sinner
Jannik Sinner — defending champion
Wimbledon record (2022–2025): 20W-3L (87.0%) across 23 matches.
Sinner enters 2026 as the defending champion after his 2025 title. His 87.0% SW19 win rate trails only Alcaraz and Djokovic in the four-year sample, with a rising trajectory on grass. The market will price him as the outright hub — the data supports that, especially in rounds where his grass profile aligns with market favouritism.
Carlos Alcaraz — two-time champion
Wimbledon record (2022–2025): 23W-2L (92.0%) across 25 matches.
Alcaraz owns the best raw win rate in the dataset — 92.0% with only two losses across four editions. His 2023 and 2024 titles confirm elite grass conversion despite a clay-first reputation. Any draw path that avoids early-round grass specialists is statistically favourable.
Novak Djokovic — seven-time champion
Wimbledon record (2022–2025): 24W-3L (88.9%) across 27 matches.
Djokovic's volume (27 matches) and 88.9% win rate remain the benchmark for sustained SW19 excellence. Age and scheduling are the variables the data cannot fully price — but historically, his grass win rate at Wimbledon exceeds his overall grass calendar numbers.
Taylor Fritz and the American grass cluster
Fritz: 14W-4L (77.8%) · Paul: 10W-4L (71.4%) · Shelton: 8W-3L (72.7%)
The American contingent shows consistently above-average Wimbledon conversion — Fritz in particular as a deep-run staple. Grass-first power baselines translate well to SW19's surface when the draw opens.
Alexander Bublik — grass paradox
Wimbledon: 7W-4L (63.6%) · broader grass profile heavily skewed to lawn (see our Bublik player analysis).
Bublik illustrates the grass-specialist rule: strong on grass overall, but Wimbledon best-of-five is a different test than 250-level grass events. Use surface splits, not tour-wide ranking, when evaluating his SW19 path.
Market calibration: do bookmaker favourites convert at their price?
We split 2022–2024 Wimbledon matches with odds into four price bands and compared implied probability to actual win rate:
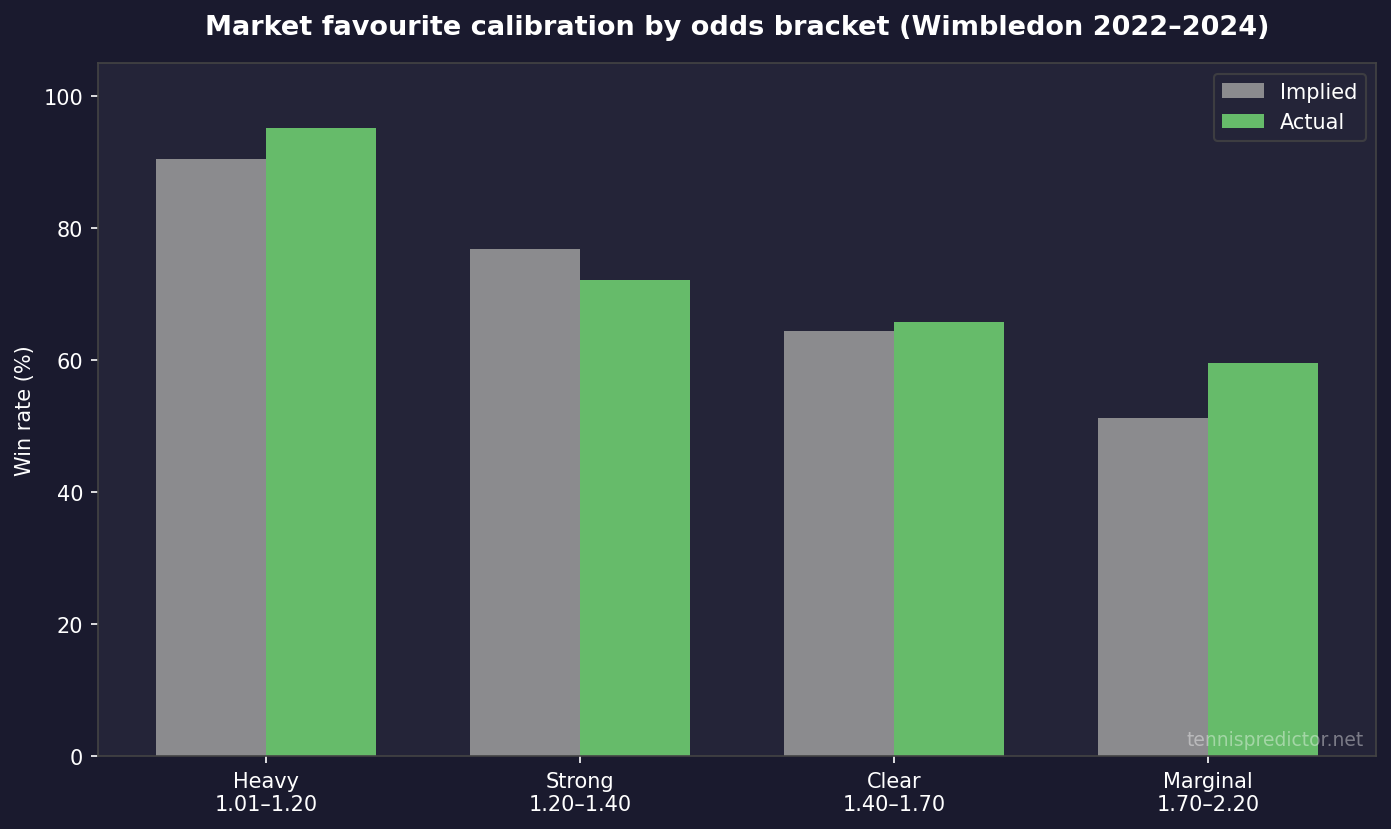 Figure 7: Implied vs actual win rate for the bookmaker's favourite by odds bracket (Wimbledon 2022–2024).
Favourite win rate by pre-match odds bracket:
- Heavy favourites (1.01–1.20): market implied ~90.5%, actual 95.2% (120 of 126)
- Strong favourites (1.20–1.40): implied ~76.9%, actual 72.2% (70 of 97)
- Clear favourites (1.40–1.70): implied ~64.5%, actual 65.8% (73 of 111)
- Marginal favourites (1.70–2.20): implied ~51.3%, actual 59.6% (28 of 47)
Two takeaways:
- Heavy favourites at Wimbledon have outperformed their price — the 95.2% conversion rate on 1.01–1.20 odds suggests elite chalk on grass is slightly underpriced in the opening rounds.
- Strong favourites (1.20–1.40) have underconverted relative to implied probability — the 72.2% actual vs ~77% implied is where upset risk concentrates. This is the band to scrutinise before blindly backing seeds in rounds 1–2.
Prediction strategy for Wimbledon 2026
Three data-backed principles for the Championships:
1. Respect market favourites more than the “Wimbledon upset” narrative suggests.
At 76.4% (2022–2024 odds), fading chalk systematically loses. Upsets happen — roughly one in four matches in stable years — but they are concentrated in specific rounds and price bands, not uniformly across the draw.
2. Target the third round and quarter-finals for structural chalk.
85.4% favourite win rate in R3 and 83.3% in QF are the strongest round-level signals. Pair with the grass-specialist filter when the surface profile confirms the market side.
3. Use tiebreak and set data to calibrate stake size — not match winner alone.
With 48.3% of matches touching a tiebreak and 21.8% going five sets, a correct winner pick can still ride a volatile path. Higher confidence should map to aligned grass profiles + strong favourite odds + rounds 3–QF, not to every seeded player in round 1.
Track live probabilities on our tennis prediction dashboard throughout the fortnight — predictions refresh daily using the same hybrid pipeline referenced above.
Frequently asked questions
How predictable is Wimbledon compared to other Grand Slams?
On 2022–2024 bookmaker odds, Wimbledon’s favourite win rate (76.4%) ranks above the US Open (71.4%) and Australian Open (74.5%), and essentially matches Roland Garros (76.0%). Wimbledon is not the most upset-prone major in our sample — despite grass-court conventional wisdom.
What is the upset rate at Wimbledon?
In fully priced years (2022–2024), roughly 23–30% of matches produced an upset (bookmaker favourite lost). The median is about one upset per four matches. Upsets concentrate in rounds 1–2; from the third round onward, favourite win rates rise sharply.
How often do Wimbledon matches go to five sets?
21.8% of completed matches from 2022–2025 (107 of 491) — close to Roland Garros (21.4%) and below the Australian Open (24.0%). Straight-set wins account for 44.8% of completed matches.
How many games per set does Wimbledon average?
10.03 games per set across 1,866 completed sets (2022–2025) — the highest among the four Grand Slams in our sample (Roland Garros 9.55, US Open 9.71, Australian Open 9.83). 26.4% of sets end on exactly 10 games (typically 6–4), and 20.0% reach a 7–6 tiebreak (13 total games).
How common are tiebreaks at Wimbledon?
48.3% of completed matches included at least one tiebreak set in the scoreline (237 of 491). Tiebreak frequency is a defining grass feature — factor it into set betting and live predictions, not just match-winner picks.
Does the grass specialist signal work at Wimbledon?
Yes, in our sample. When one player’s historical grass win rate exceeded their opponent’s by at least 15 percentage points (minimum five grass matches each), the grass-stronger player won 89.2% of matches (132 of 148). Use it as a confirmation filter alongside market prices, not as a standalone contrarian signal.
Who does the data favour for Wimbledon 2026?
Carlos Alcaraz (92.0% SW19 win rate, 2022–2025) and Novak Djokovic (88.9%) lead the historical sample. Jannik Sinner (87.0%) arrives as defending 2025 champion. All three combine elite Wimbledon records with grass profiles that align with our specialist signal — the outright market should centre on that trio unless draw or fitness shocks intervene.
Why is 2025 upset data flagged as unreliable?
Only 41.7% of 2025 main-draw matches had complete pre-match odds in our database (53 of 127). Any upset rate computed on that partial sample can mislead. Use 2022–2024 for year-on-year upset comparisons.
Where can I get Wimbledon 2026 match predictions?
Daily win probabilities and confidence scores for every scheduled match are on our live prediction dashboard. For methodology behind the numbers, see our algorithm hub and grass court specificity guide.
Data: 508 Wimbledon main-draw matches (2022–2025) from TennisPredictor's ATP match database with verified pre-match odds where noted. Favourite = lower decimal odds. Round and set statistics use all completed matches; odds-based statistics use matches with both sides priced. 2025 odds coverage: 41.7% — flagged where relevant.
See today's match predictions with confidence scores and value signals.
View Live Predictionsarrow_forwardRelated Articles
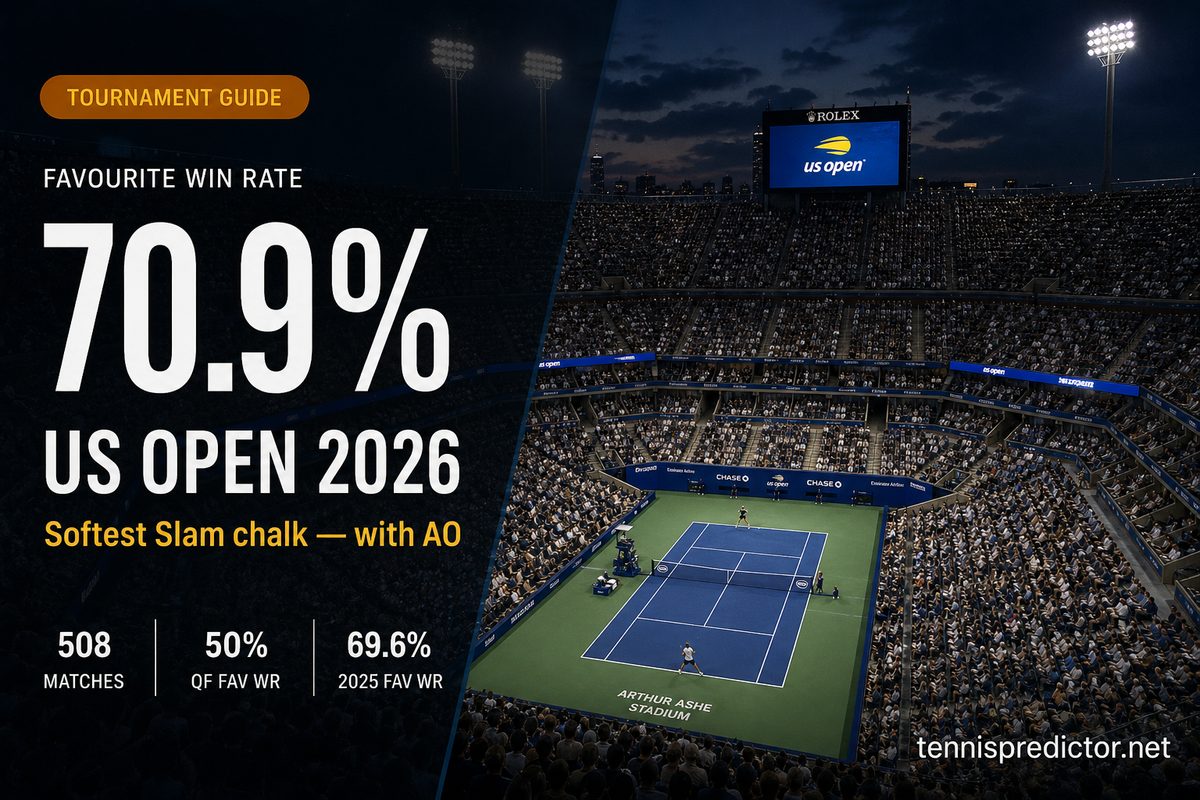
US Open 2026 betting preview: what 4 years of Flushing Meadows data reveals
This US Open 2026 betting preview uses four years of Flushing Meadows match data. Bookmaker favourites won 70.9% across 508 main-draw matches — with a soft quarter-final window, outdoor hard-court set patterns, and clear contender fingerprints for 2026.
July 18, 2026 · 15 min read
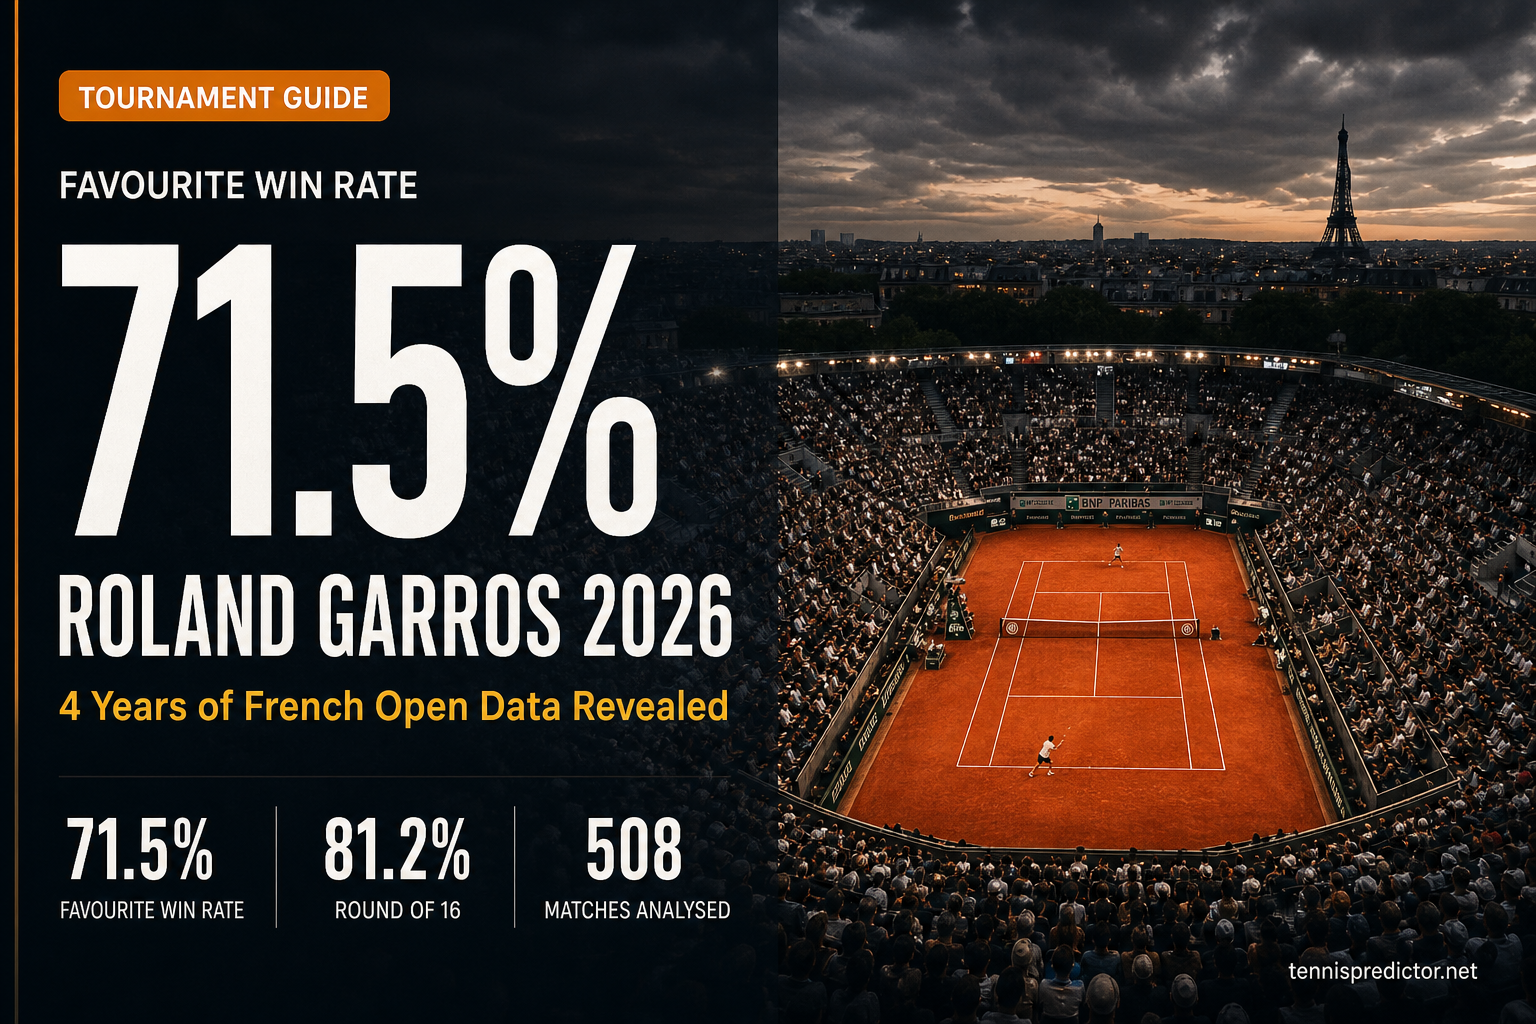
Roland Garros 2026 betting preview: what 4 years of French Open data reveals
Roland Garros is not the upset factory bettors assume. Our analysis of 508 French Open matches (2022-2025) reveals a 71.5% favourite win rate — higher than Wimbledon and the US Open. Here is what the data says about clay's biggest prize.
May 4, 2026 · 17 min read
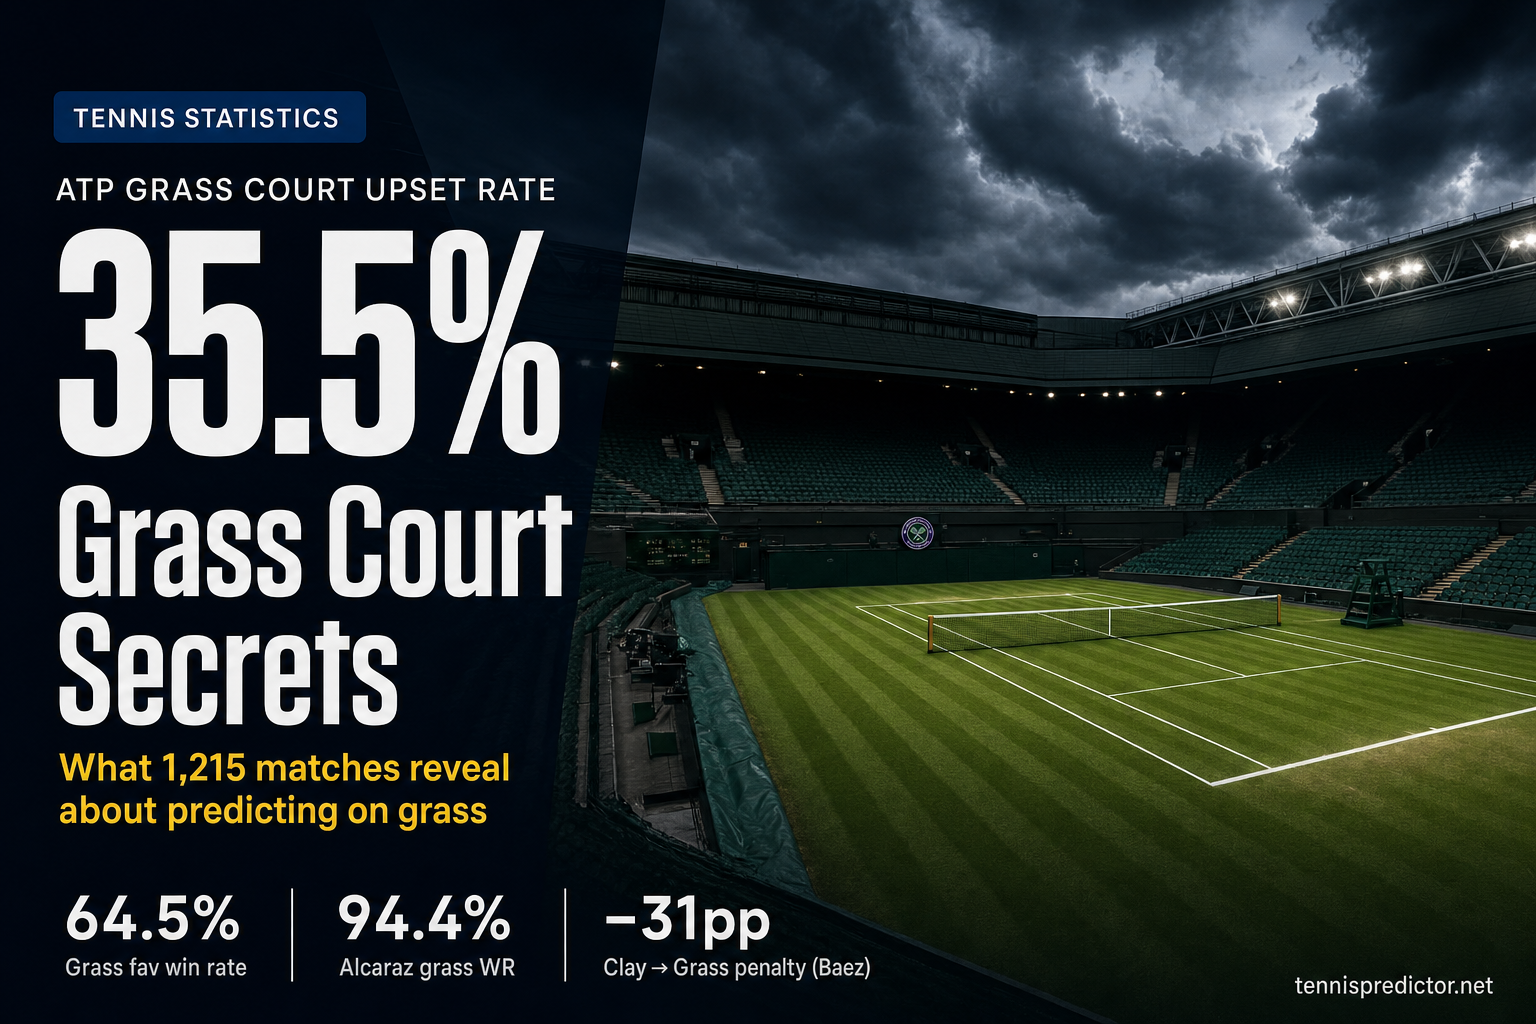
ATP grass court specificity: what 1,215 matches really tell us
Everyone repeats the same myths about grass — that it's random, that serve specialists always win, that clay court form means nothing. Our model disagrees. We dug into 1,215 ATP grass matches from 2022 to 2025 to separate the folklore from the numbers.
June 13, 2026 · 16 min read
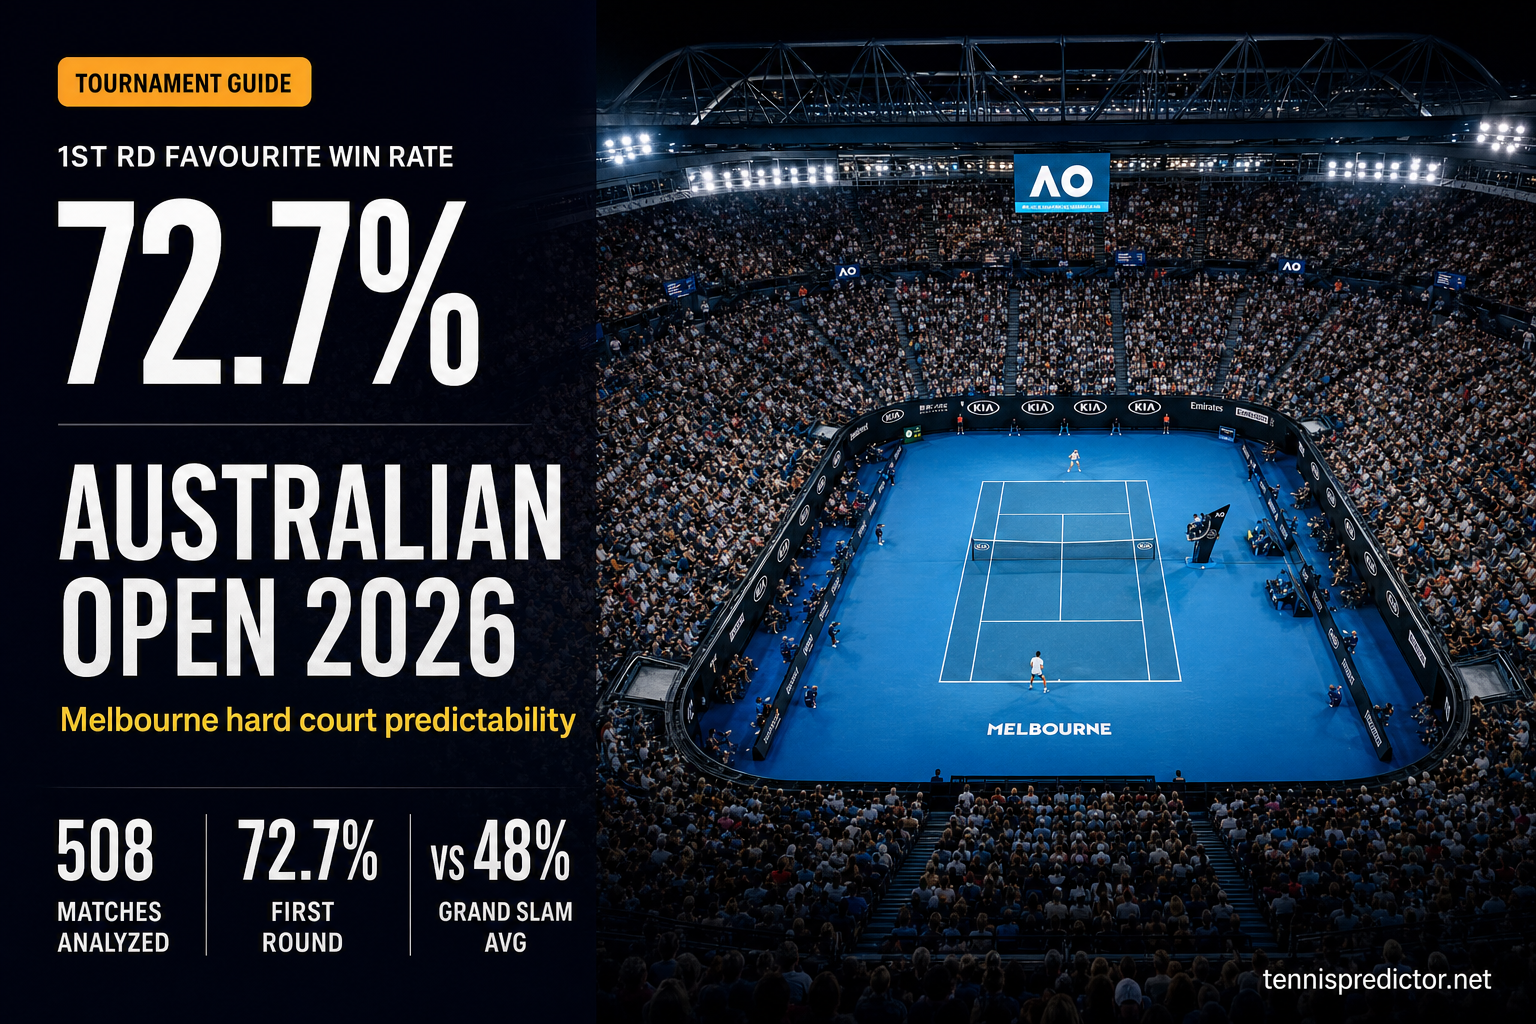
Australian Open 2026 betting preview: hard court predictability & champion predictions
The Australian Open kicks off the Grand Slam calendar each January, and Melbourne Park's hard courts set the stage for two weeks of high-stakes tennis. Our prediction engine has analyzed 508 matches from the 2022-2025 Australian Opens, and the data reveals a surprising pattern: unlike other Grand Slams where early rounds are coin tosses, Melbourne Park favors favorites more than any other major.
January 13, 2026 · 12 min read