Tommy Paul: hard-court rising, but the QF wall and De Minaur problem persist
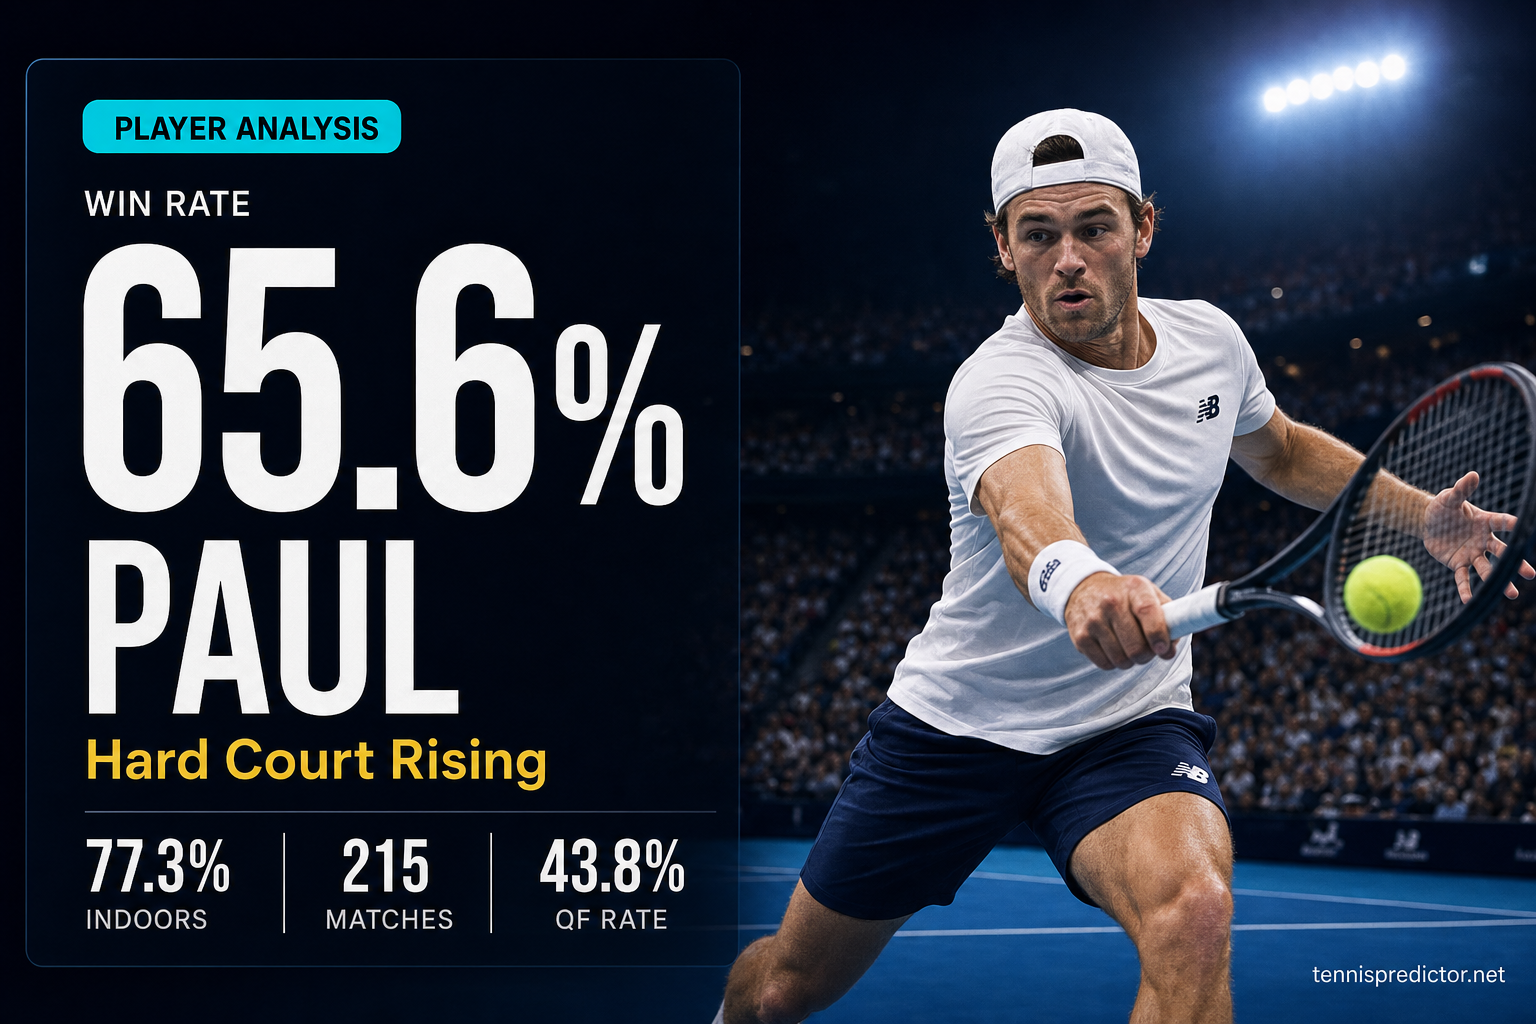
Tommy Paul has played 215 ATP matches from 2022 to 2025 at a 65.6% overall win rate — one of the most sustained rise trajectories in the dataset. From 53.8% in 2022 to 72.4% in 2024, he is the American hard-court player whose growth has most consistently outpaced market pricing. The 2025 dip to 58.3% and a QF conversion rate of 43.8% across 16 appearances are the two signals where the market most needs to update its assessment.
Key metrics at a glance
| Metric | Value |
|---|---|
| Overall win rate | 65.6% |
| Dataset rank (end of period) | 14 |
| Matches analysed | 215 (2022–2025) |
| Best surface | Indoors — 77.3% |
| Grand Slam win rate | 72.2% |
| Worst surface | Clay — 56.4% |
| As market favourite | 79.6% |
| As underdog | 42.2% |
Paul's year-by-year record
| Year | Matches | Wins | Win rate |
|---|---|---|---|
| 2022 | 26 | 14 | 53.8% |
| 2023 | 24 | 15 | 62.5% |
| 2024 | 29 | 21 | 72.4% |
| 2025 | 24 | 14 | 58.3% |
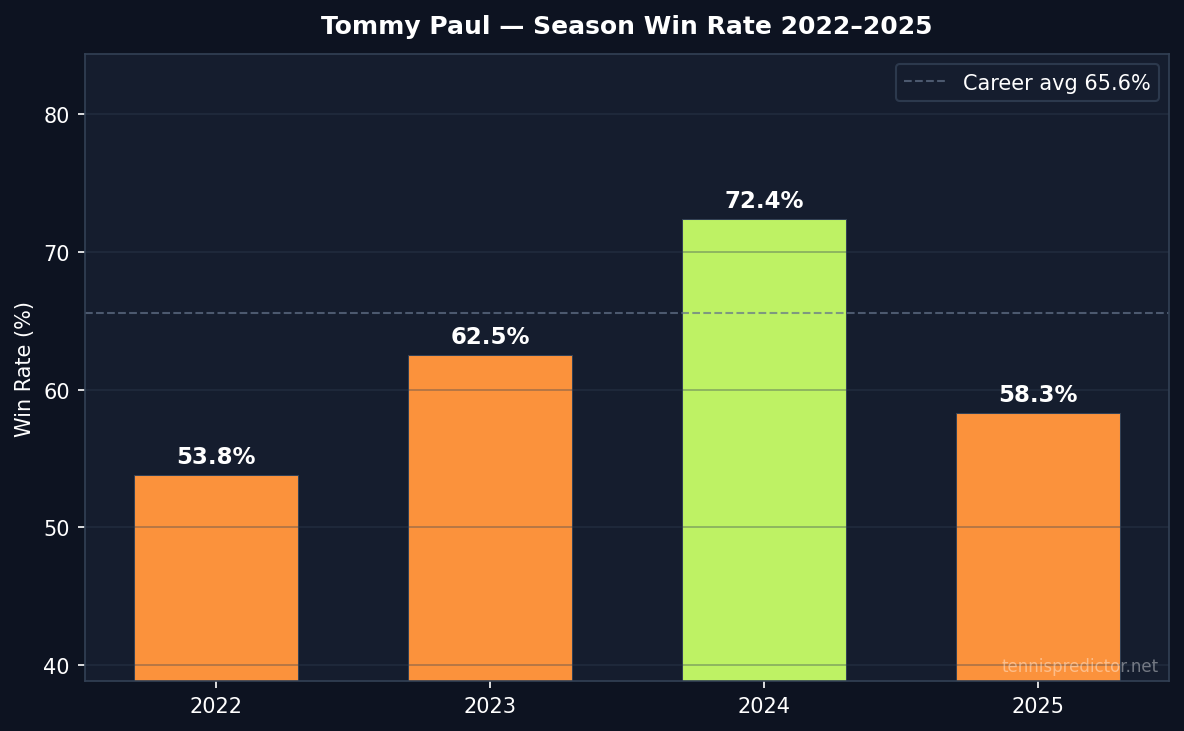
Win rate by season, Tommy Paul, 2022–2025. Source: ATP match data via tennispredictor.net
The upward trend from 2022 to 2024 (53.8% → 62.5% → 72.4%) is the clearest improvement trajectory in the top-20 dataset over this period. The 2024 figure of 72.4% over 29 matches placed Paul in the top-8 tier by win rate for that season. The 2025 dip to 58.3% across 24 matches is a concern: it is not just schedule-related but tracks with increased early losses against mid-ranked hard-court players who had studied his 2024 patterns.
Surface breakdown: indoor specialist, clay the clear weakness
| Surface | Matches | Win rate |
|---|---|---|
| Indoors | 22 | 77.3% |
| Grand Slam | 54 | 72.2% |
| Grass | 36 | 66.7% |
| Hard | 118 | 66.1% |
| Clay | 39 | 56.4% |
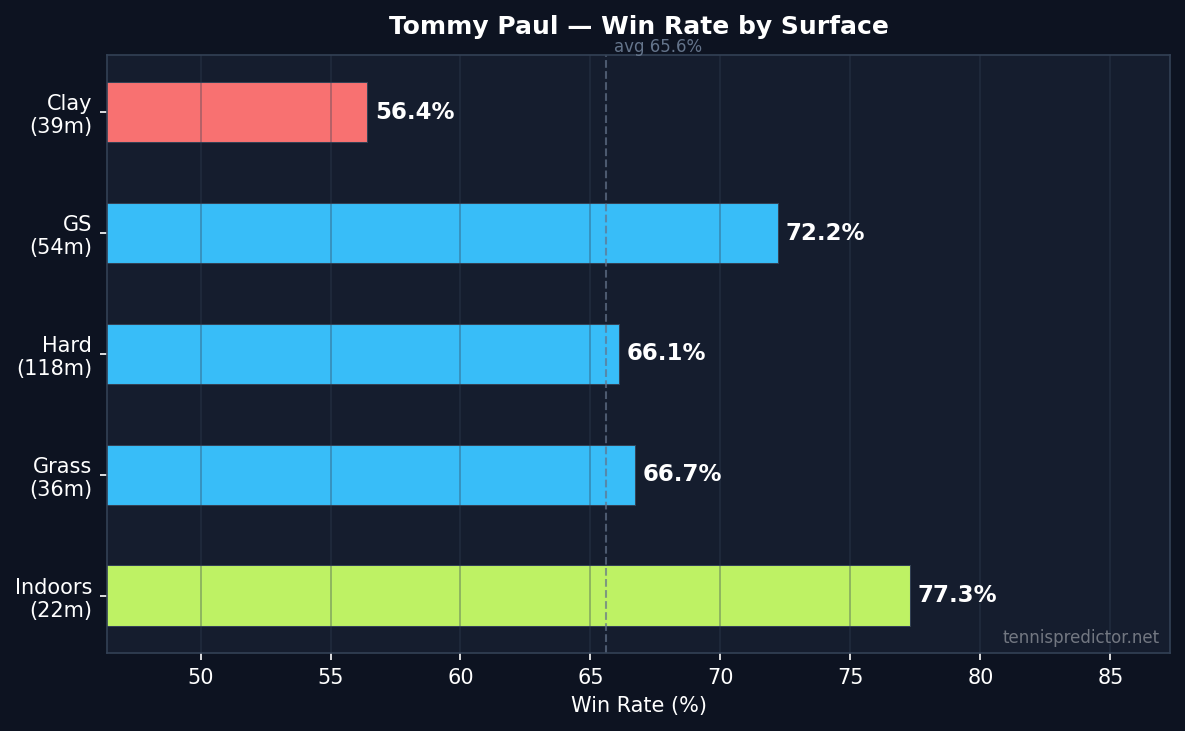
Win rate by surface, Tommy Paul, 2022–2025. Source: ATP match data via tennispredictor.net
Paul's indoor rate (77.3%) is the highest surface-specific figure in his profile, driven by a serve-and-forehand attacking game that is maximised on fast indoor courts. His Grand Slam rate (72.2% over 54 matches — the largest GS sample in Batch 3) is the most statistically robust figure and reflects sustained performance in best-of-five on hard courts at the Australian Open and US Open.
The clay figure (56.4%, 39 matches) is the clearest surface discount — 9.2 points below his overall average. At clay events, Paul faces opponents who can extend rallies well beyond the three-four shot patterns he favours on hard. The market prices clay events based on ranking; the data says clay draws are consistently unfavourable for Paul.
Round-by-round: the QF wall at 43.8%
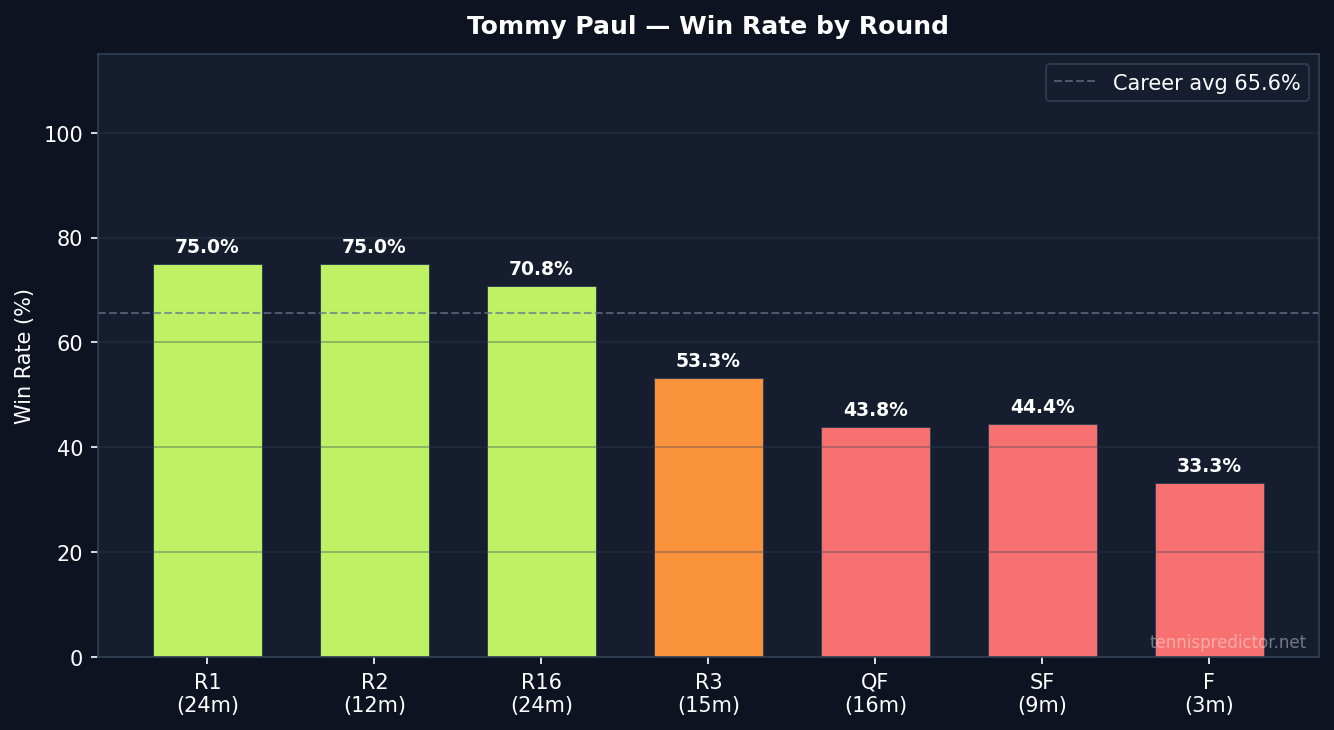
Win rate by round, Tommy Paul, 2022–2025. Source: ATP match data via tennispredictor.net
| Round | Matches | Win rate |
|---|---|---|
| R1 | 24 | 75.0% |
| R2 | 12 | 75.0% |
| R16 | 24 | 70.8% |
| R3 | 15 | 53.3% |
| QF | 16 | 43.8% |
| SF | 9 | 44.4% |
| Final | 3 | 33.3% |
The stepdown from R16 (70.8%) to QF (43.8%) is abrupt — a 27-point drop across 16 QF appearances. This is the largest R16-to-QF drop in the Batch 3 dataset and reflects a player who consistently makes the second week against seeded opponents but encounters the elite tier there. His SF figure (44.4%, 9 matches) is similarly below 50%, confirming the ceiling pattern.
Early rounds are reliable: 75.0% each in R1 and R2 — Paul is an excellent bet in the first two rounds of hard-court events.
H2H against the elite
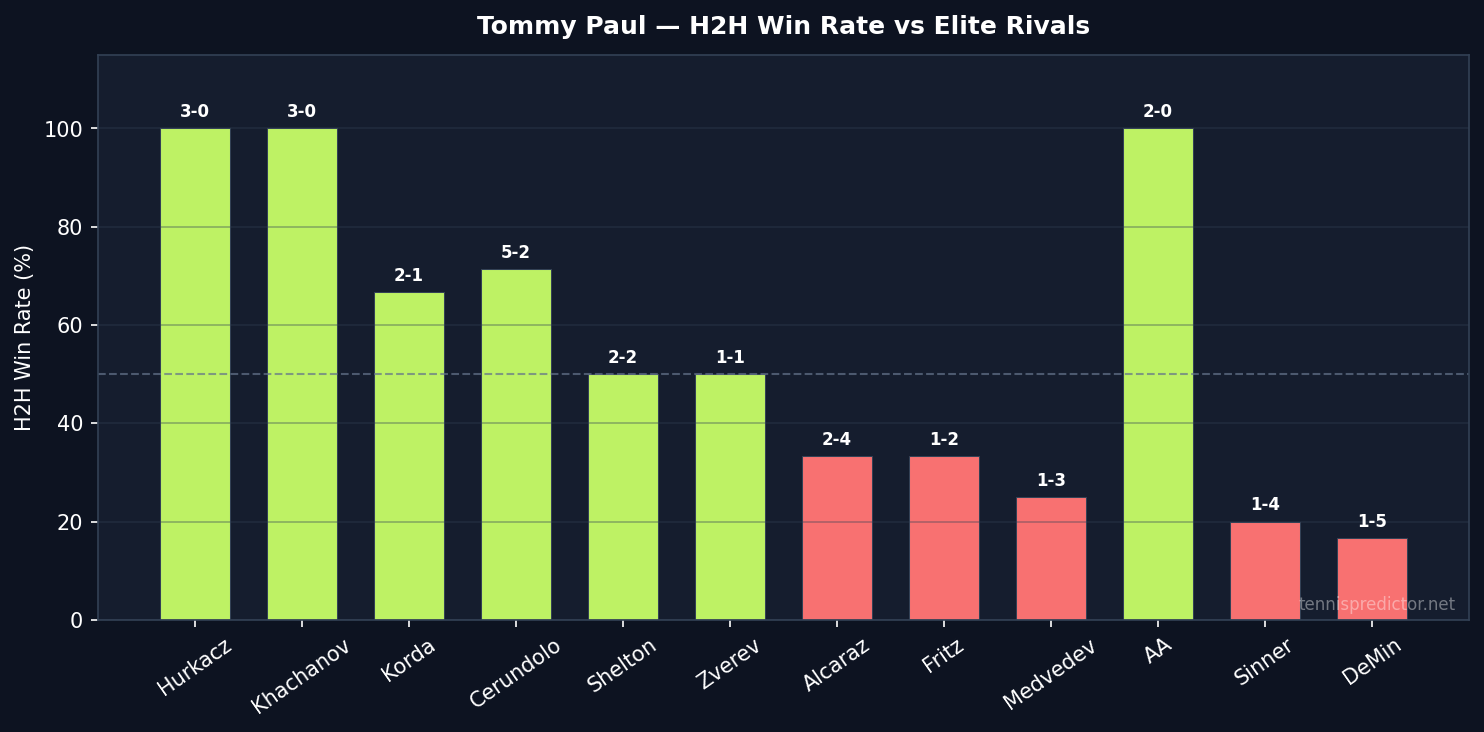
H2H win rate vs rivals with 2+ meetings, Tommy Paul, 2022–2025. Source: ATP match data via tennispredictor.net
| Opponent | Record | H2H win rate |
|---|---|---|
| Hurkacz | 3–0 | 100.0% |
| Khachanov | 3–0 | 100.0% |
| Cerundolo | 5–2 | 71.4% |
| Korda | 2–1 | 66.7% |
| Shelton | 2–2 | 50.0% |
| Zverev | 1–1 | 50.0% |
| Alcaraz | 2–4 | 33.3% |
| Fritz | 1–2 | 33.3% |
| Medvedev | 1–3 | 25.0% |
| Auger-Aliassime | 0–2 | 0.0% |
| Sinner | 1–4 | 20.0% |
| De Minaur | 1–5 | 16.7% |
The 3–0 records against Hurkacz and Khachanov are the two most actionable positive H2H signals in Paul's profile. The market prices those matchups at approximate parity given ranking proximity; the H2H provides strong grounds to back Paul.
The De Minaur result (1–5, 16.7%) is the most notable negative H2H and one of the more surprising records in the dataset given their ranking proximity. Across multiple surfaces and event sizes, De Minaur has consistently solved Paul's game. When these players meet, the market's ranking-based pricing should be adjusted in De Minaur's favour.
As market favourite vs underdog
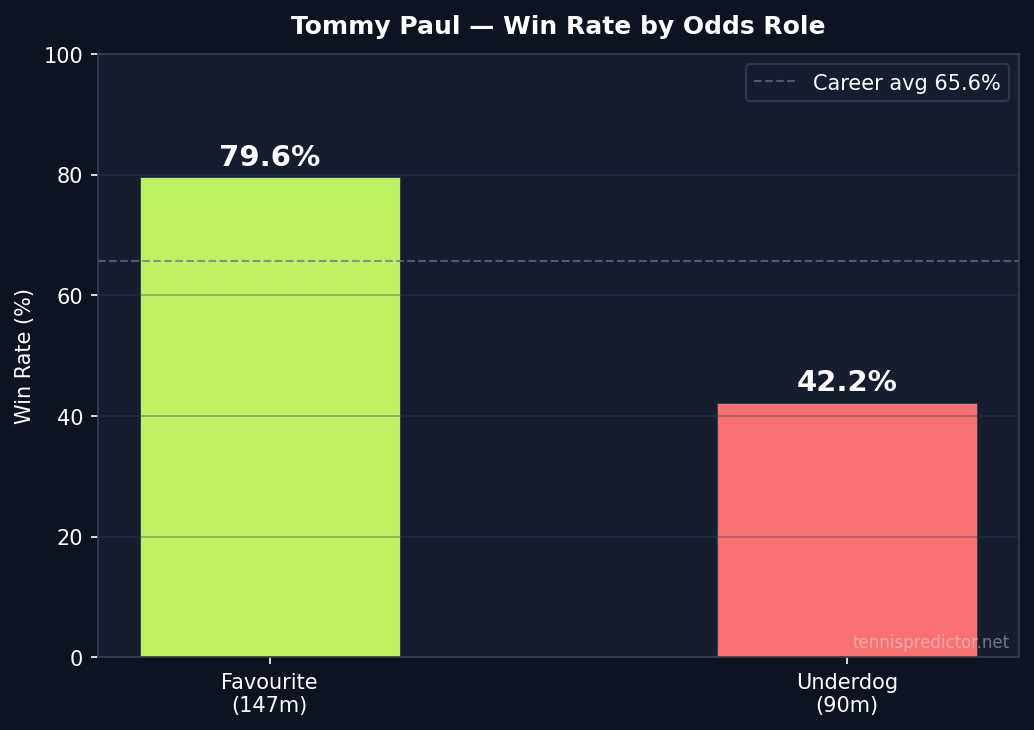
Win rate as market favourite vs underdog, Tommy Paul, 2022–2025. Raw tournament cache. Source: tennispredictor.net
As favourite (147 matches): 79.6% — one of the strongest favourite conversion rates in Batch 3. As underdog (90 matches): 42.2% — a significant underdog sample reflecting the many draws where he faces higher-ranked opponents. The 42.2% underdog rate is below the 50% mark, consistent with the H2H elite struggles.
What the betting market misses about Paul
The Grand Slam premium is genuine. 72.2% across 54 Grand Slam matches is Paul's most reliable long-term statistic. At the US Open specifically, his hard-court serve-and-forehand game on fast hard is maximally effective. Backing Paul through the second round of hard-court Slams is historically well-supported.
The De Minaur anomaly. 1–5 against De Minaur is counter-intuitive given Paul's hard-court credentials. The market prices them near parity; the data provides consistent grounds to back De Minaur in that specific matchup.
The 2025 form discount. 58.3% in 2025 is a meaningful step down from 72.4% in 2024. Current market pricing that reflects 2024 Paul rather than 2025 Paul is overvalued at hard-court events.
How our model treats Paul
- Indoor and GS boost — 77.3% indoors and 72.2% GS trigger upward adjustments at those events
- Clay penalty — 56.4% clay triggers a downward adjustment on clay events
- De Minaur negative override — 1–5 H2H applied as strong negative signal
- 2025 form discount — rolling windows (last-5: 60%, last-10: 60%) pull predictions below career average
Frequently asked questions
What is Tommy Paul's overall win rate?
65.6% across 215 matches from 2022 to 2025. Peak was 72.4% in 2024; 2025 is 58.3%.
Which surface is Paul's strongest?
Indoors at 77.3% over 22 matches, followed by Grand Slams at 72.2% over 54 matches. The GS figure is the most statistically reliable given the large sample.
Who has the worst H2H record against Paul?
Hurkacz and Khachanov have never beaten him (3–0 each). De Minaur is 5–1 against Paul — the largest positive H2H in the dataset against him.
When is Paul worth backing?
In the first two rounds of hard-court Grand Slams and indoor events. Fade him against De Minaur at any stage, on clay against clay specialists, and in QFs where the opponent is a top-10 player.
Conclusion
Tommy Paul's profile supports clear strategic conclusions: reliable in early rounds on hard courts and indoors, a genuine underperformer at QF stage (43.8%), and specifically vulnerable against De Minaur (1–5). The 2024 breakthrough was real; the 2025 dip is equally real and should be reflected in current odds assessments. Back him early at hard-court Slams, fade him in second-week matchups at any event.
For the American player whose data profile Paul is most often compared to, see the Shelton analysis. For the De Minaur side of their H2H, see the De Minaur analysis.
All statistics sourced from ATP match data 2022–2025. ATP Tour events only. Data extracted August 2025.
See today's match predictions with confidence scores and value signals.
View Live Predictionsarrow_forwardRelated Articles
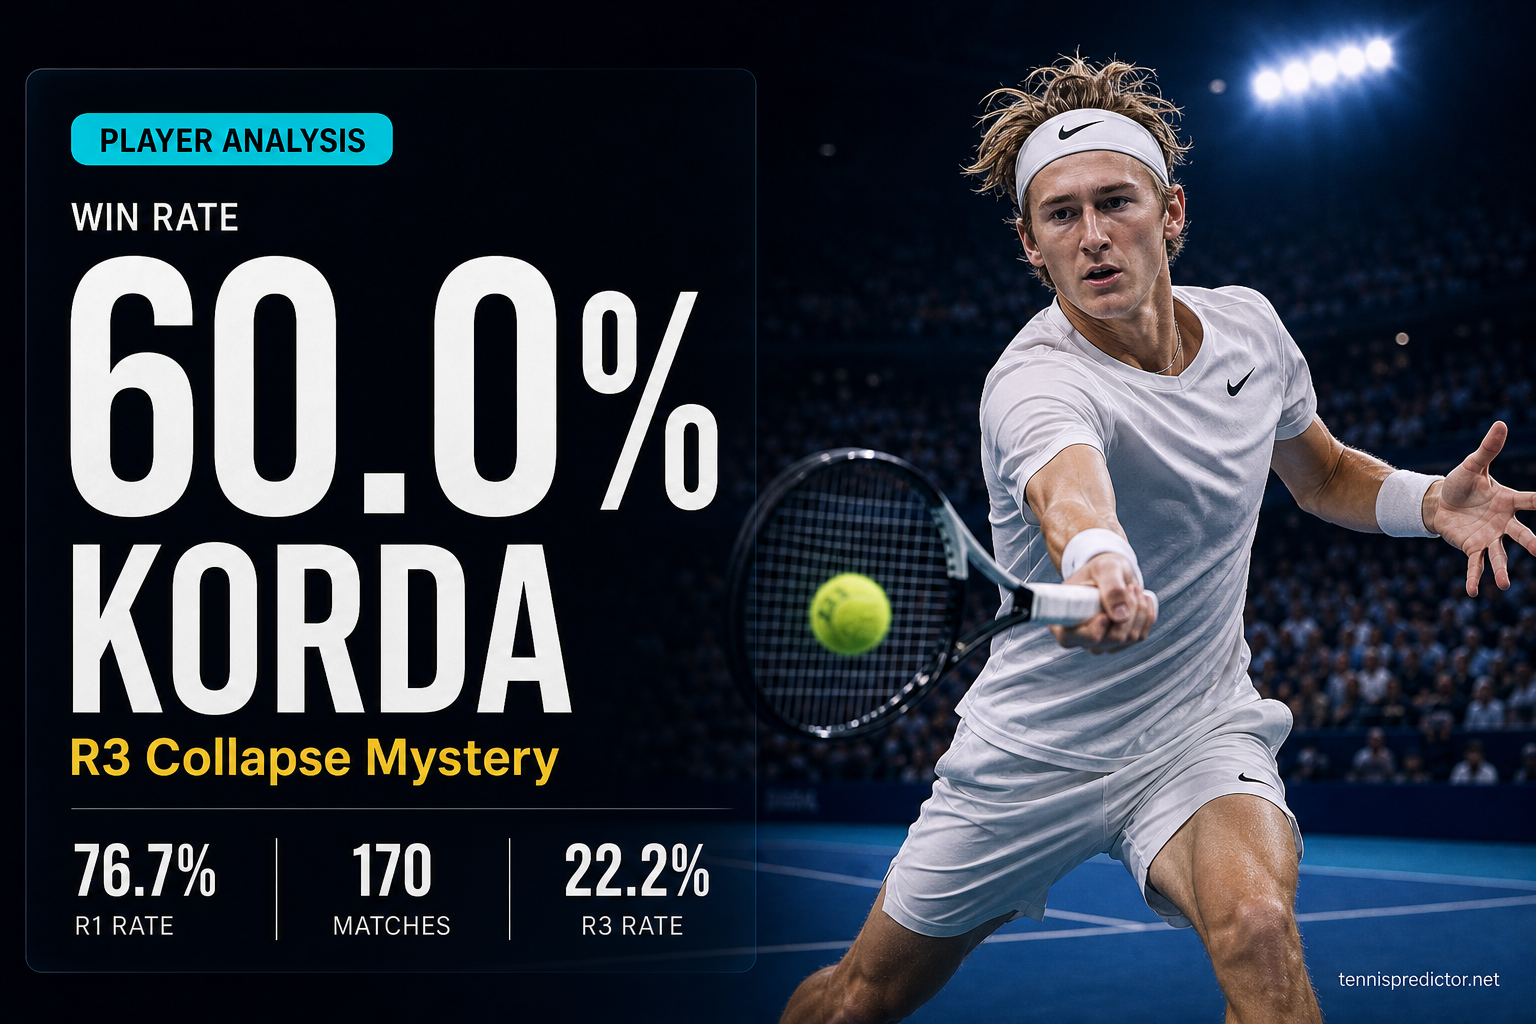
Sebastian Korda: hard-court threat with a third-round collapse and a clay floor
Korda has played 170 matches across four seasons with gradual improvement, peaking at 66.7% in 2025. His 76.7% R1 and 70.6% R2 conversion contrast sharply with a 22.2% R3 win rate — a pattern unlike any other in the top-20 dataset.
June 14, 2026 · 11 min read
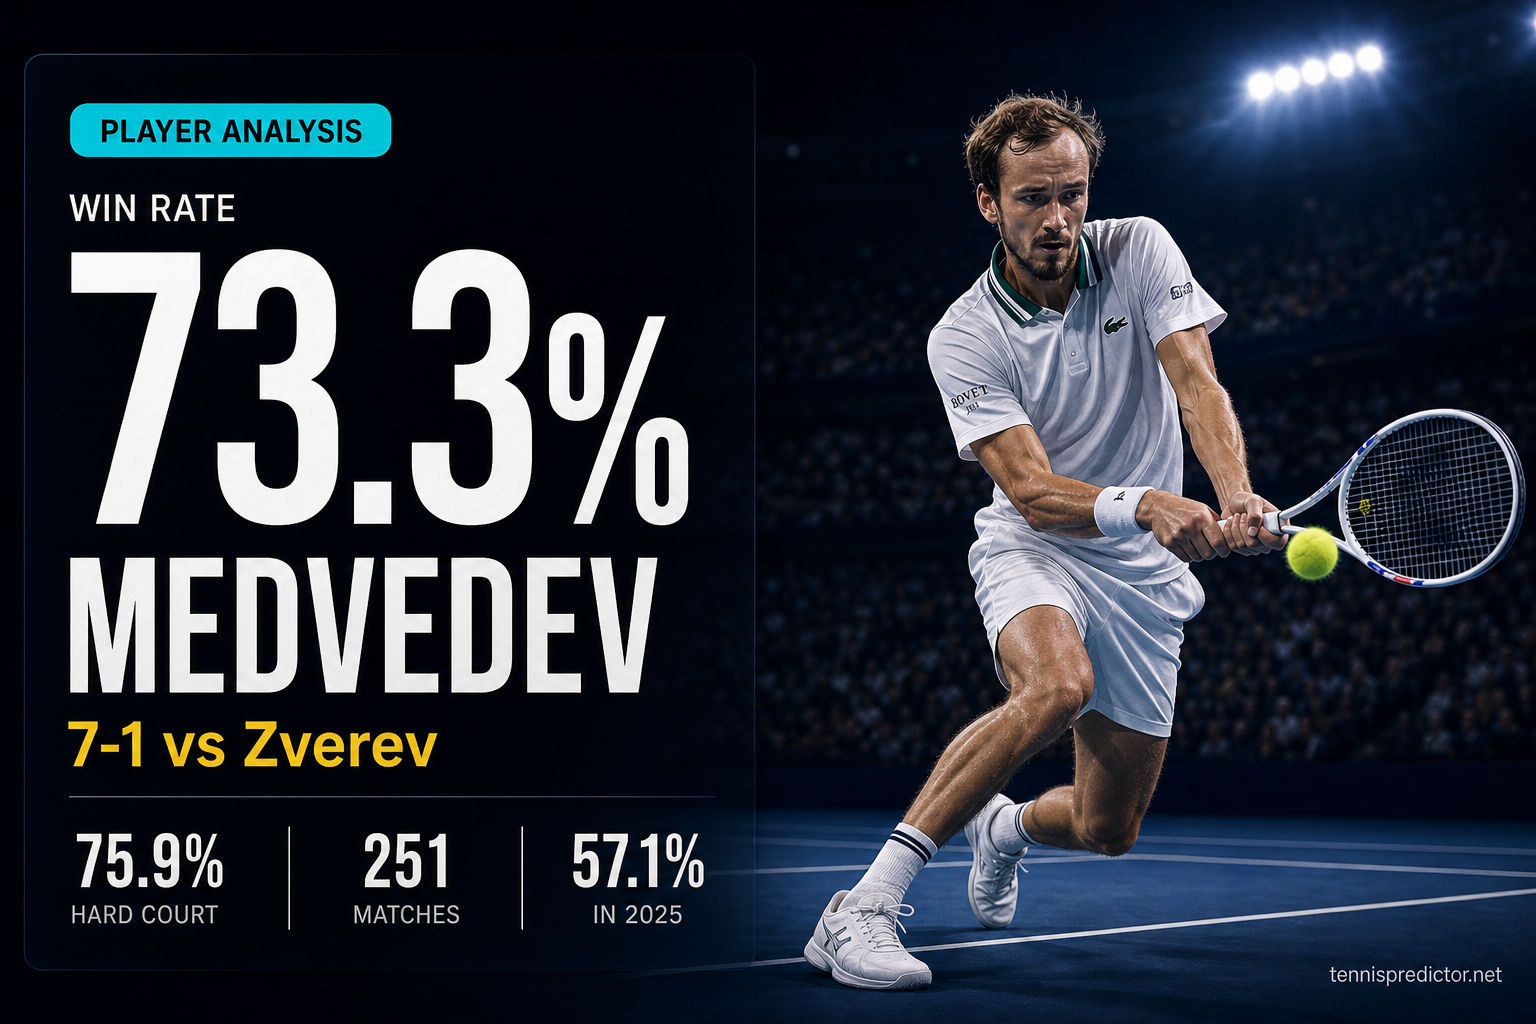
Daniil Medvedev: the counter-puncher the market underestimates on hard courts
Medvedev dominated 2022–2023 with an 80%+ win rate and a 7-1 record against Zverev. But 2025 has brought his sharpest form dip — 57.1% over 35 matches. We map every surface, round, and H2H to identify where the market is still pricing him at peak-era rates.
June 14, 2026 · 13 min read
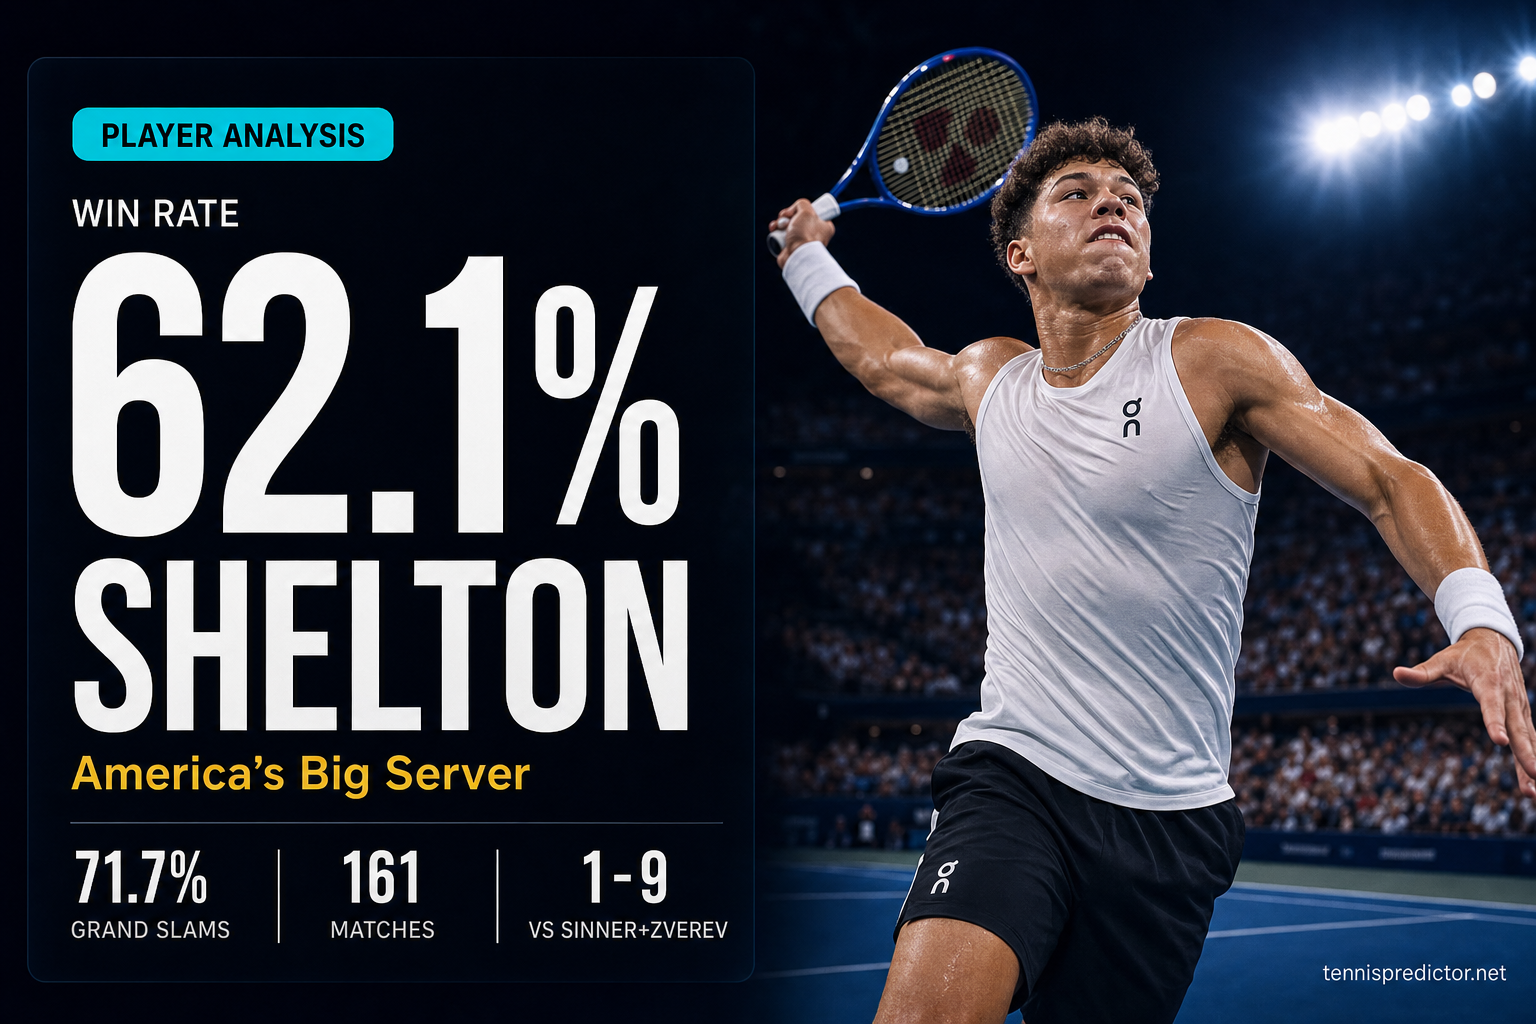
Ben Shelton: America's next big server and the 2025 plateau
Ben Shelton played 161 matches across four seasons, rising from 50% in 2022 to 66.7% in 2024, then dipping to 51.9% in 2025. His 71.7% Grand Slam win rate contrasts sharply with his 52.2% grass rate and 25% SF conversion. We map every dimension of his developing profile.
June 14, 2026 · 11 min read
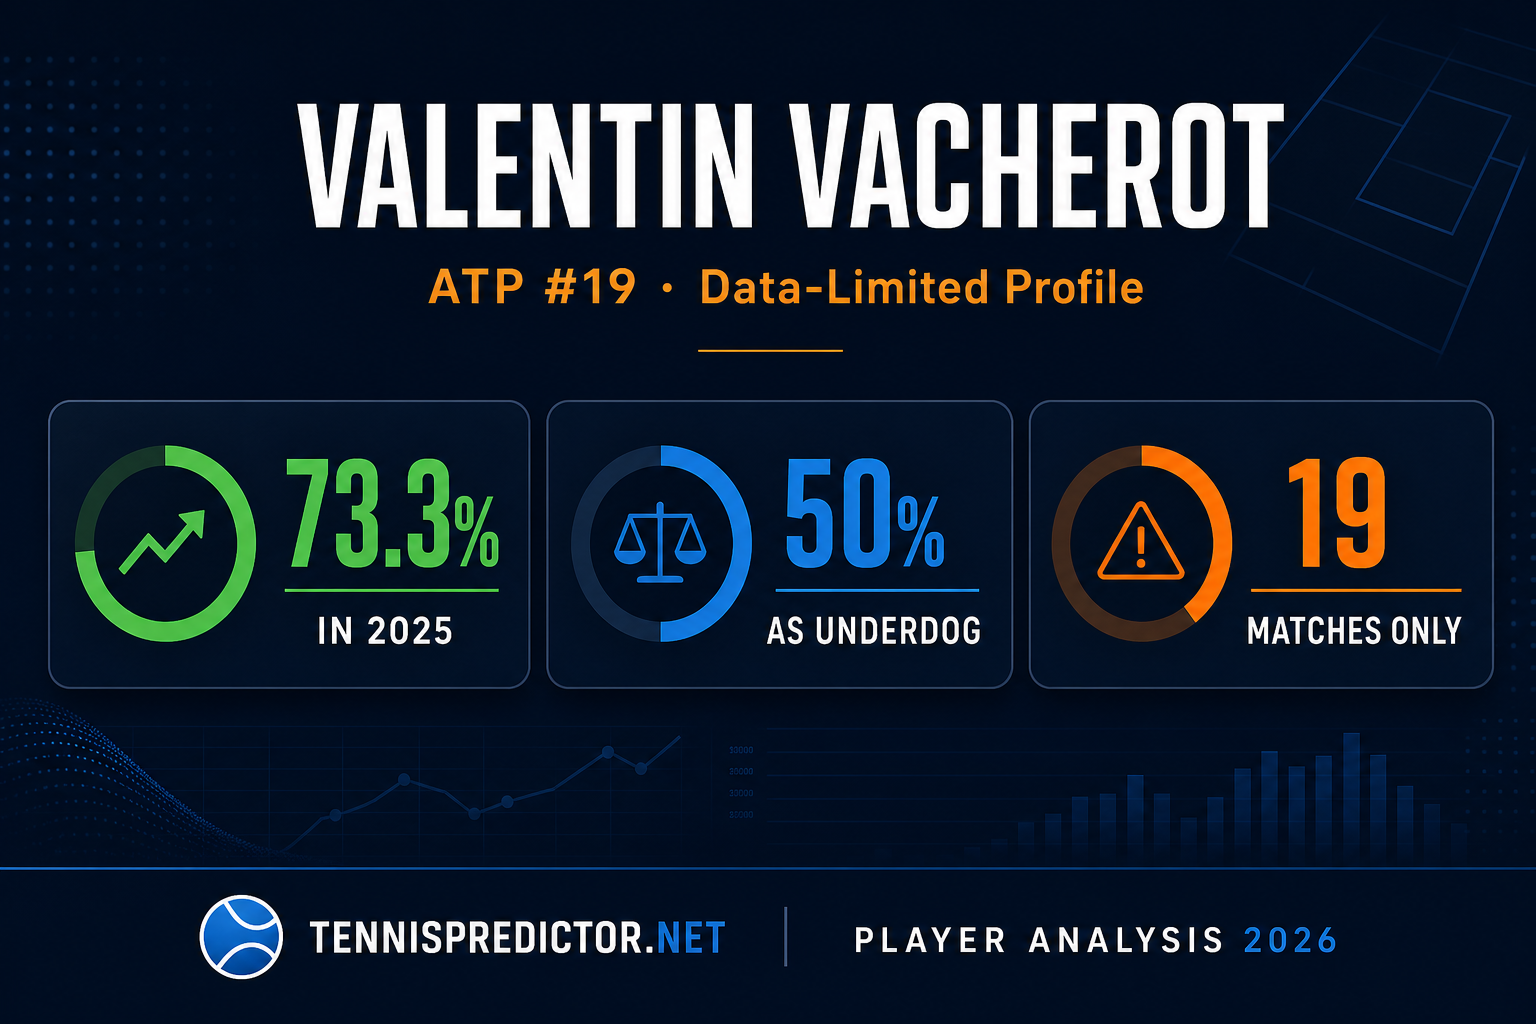
Valentin Vacherot: Shanghai Masters peak, hard-court edge, and a 2026 reality check
Vacherot now has 37 ATP main-draw matches in our cache from 2023 to mid-2026 — above our 20-match floor. The story is no longer “too little data”: it is a Shanghai Masters champion on hard (69.6%) whose 2026 form (55.6%) has normalised after a 73.3% 2025 breakout.
July 18, 2026 · 11 min read