ATP hard courts are not one surface: what 4,355 matches show
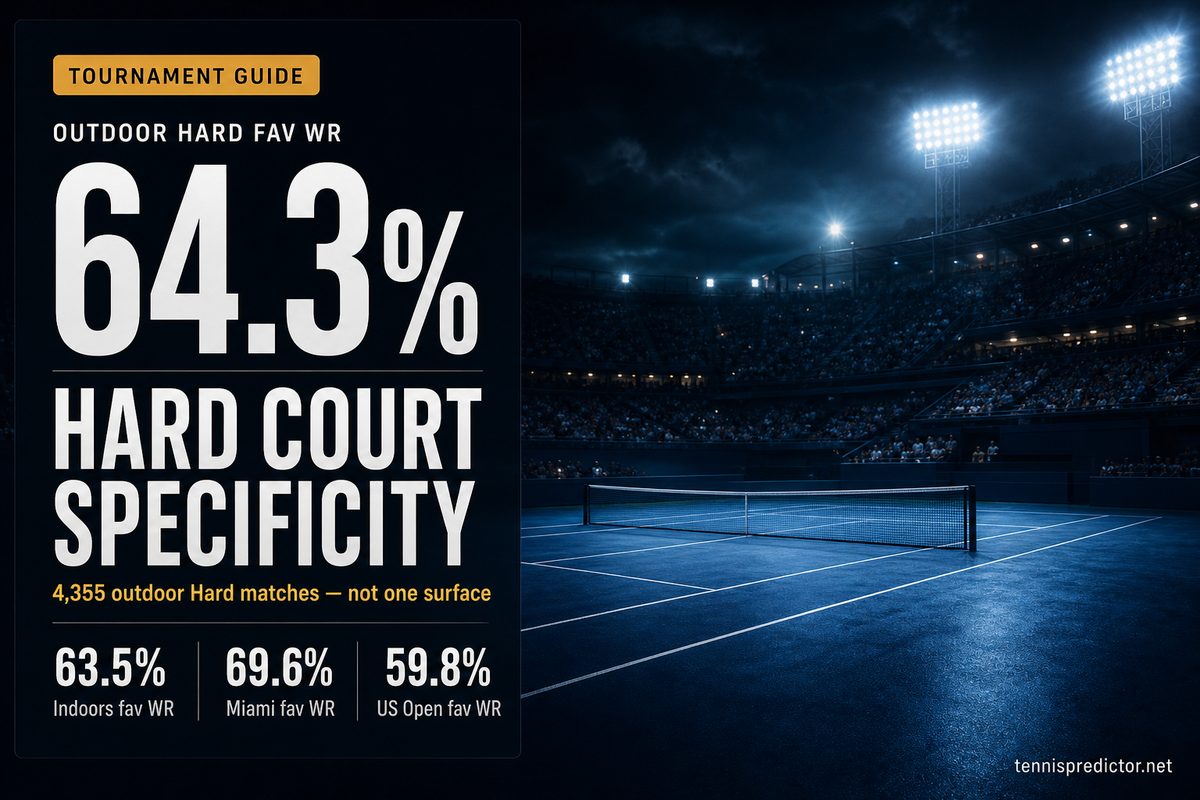
Hard courts dominate the ATP calendar — 4,355 outdoor Hard matches in our 2022–2025 tournament cache, 44.1% of all tour-level matches in that window — yet they are usually discussed as one bland “default” surface. This article is part 3 of our surface series, after grass court specificity and the clay court betting guide.
The claim we test: hard is not one surface, and it is not a neutral baseline. Outdoor Hard and Indoors are labeled separately in our data and behave differently. Miami is not the US Open. A clay win rate does not travel cleanly into Indian Wells. And slight favourites on outdoor hard convert barely better than a coin flip.
Methodology note: favourite = lower decimal odds. Matches without odds are excluded from favourite-win tables. Cache label Hard = outdoor hard; Indoors = indoor events (usually indoor hard) — never mixed into outdoor Hard totals. ATP main draw only.
Hard is not one surface
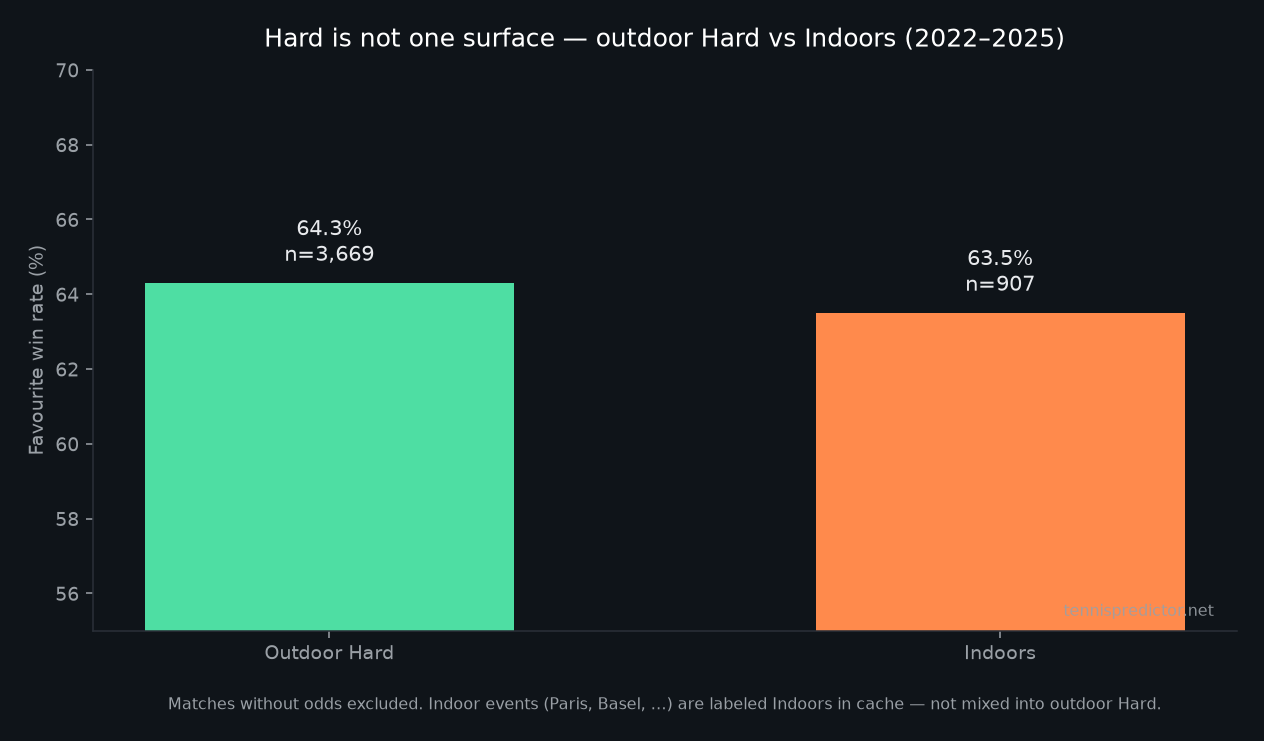 Favourite win rate with bookmaker odds available. Outdoor Hard 64.3% (n=3,669) vs Indoors 63.5% (n=907).
| Format | Matches | With odds | Favourite WR | Upset rate |
|---|---|---|---|---|
| Outdoor Hard | 4,355 | 3,669 | 64.3% | 35.7% |
| Indoors | 1,226 | 907 | 63.5% | 36.5% |
The aggregate gap looks small — until you open the event list. Paris Masters (Indoors) sits near 61% favourite win rate on priced matches; Miami (outdoor Hard) sits above 71%. Treating “hard court form” as one number flattens the season into a fiction.
Event favourite rates below use per-tournament cache files (same method as our US Open 2026 preview). The 2025 yearly rollup still carries corrupted placeholder odds — do not mix those into event chalk tables.
Brief surface context
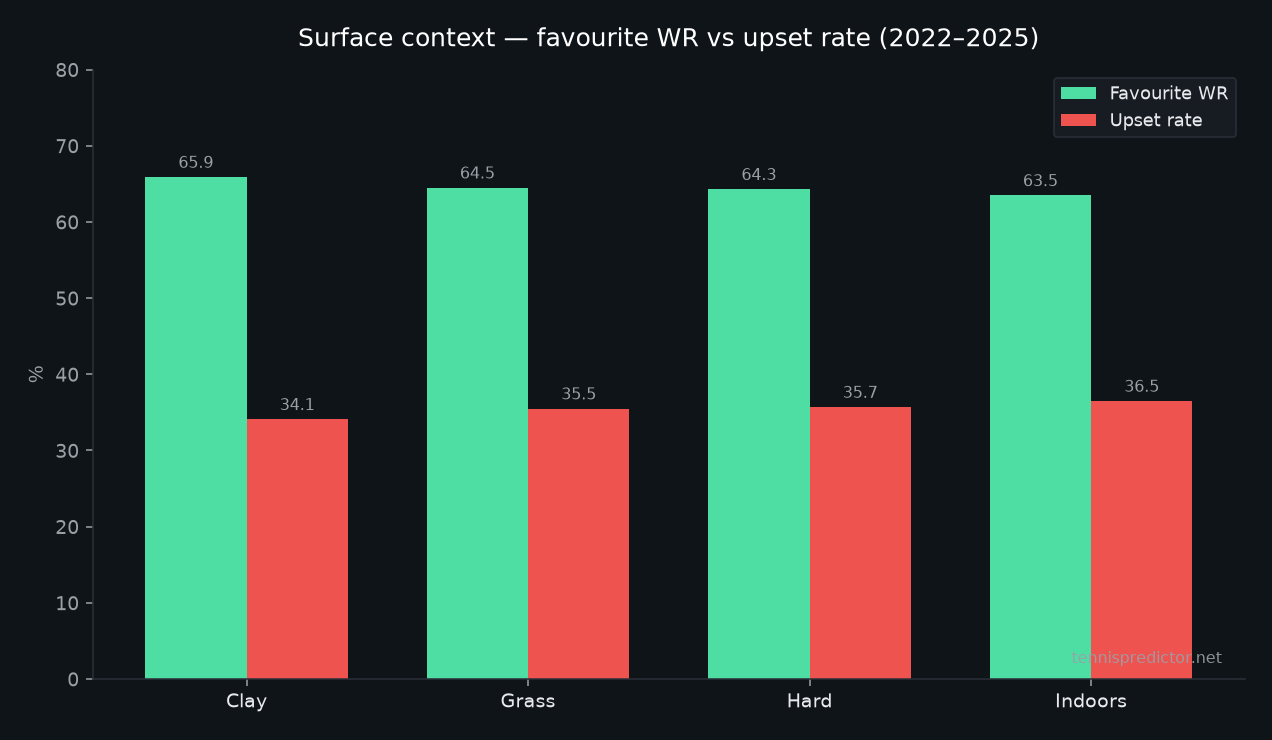 Same favourite definition across Clay, Grass, outdoor Hard, and Indoors (2022–2025).
| Surface | With odds | Favourite WR | Upset rate |
|---|---|---|---|
| Clay | 2,614 | 65.9% | 34.1% |
| Grass | 1,070 | 64.5% | 35.5% |
| Outdoor Hard | 3,669 | 64.3% | 35.7% |
| Indoors | 907 | 63.5% | 36.5% |
Outdoor hard is not the most predictable outdoor surface — clay still edges it — and Indoors is the least favourite-friendly format in the set. The gaps are real but modest at tour level. What matters more is where on the hard calendar you are betting, and who is walking in from clay or grass.
Era caveat: 2022–2025 includes multi-surface elites (Sinner, Alcaraz, Djokovic, Zverev). That can inflate chalk conversion everywhere, including hard. Read event and transition signals harder than the headline surface average.
Odds coverage caveat: 2022–2024 outdoor Hard favourite WR sits near 68% with ~100% odds coverage. 2025 drops to 39.7% on only 43% coverage — a data gap, not a chaos season. The same issue appears in our grass study.
The hard specialist effect — with honesty
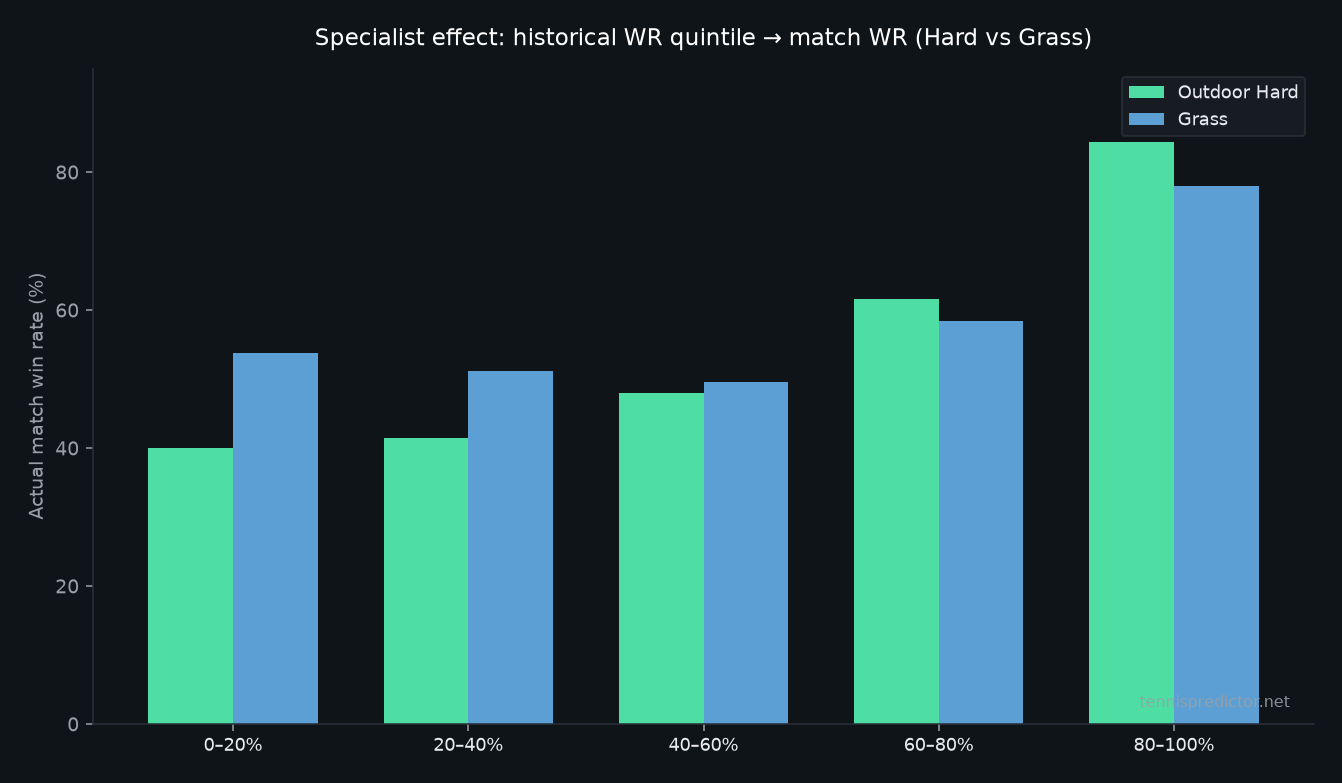 Leave-one-out historical win-rate quintile on that surface → actual match win rate. Hard vs grass side by side.
| Historical WR quintile | Hard appearances | Hard match WR | Grass match WR |
|---|---|---|---|
| 0–20% | 135 | 40.0% | 53.8%* |
| 20–40% | 1,466 | 41.5% | 51.1% |
| 40–60% | 4,663 | 47.9% | 49.6% |
| 60–80% | 1,761 | 61.6% | 58.4% |
| 80–100% | 360 | 84.4% | 78.0% |
*Grass bottom quintile is a tiny sample (26 appearances).
Honesty check: the top hard quintile is dominated by career elites who win everywhere — not by a grass-style “surface magician” class. The middle of the hard pool is huge (4,663 appearances in the 40–60% band at 47.9%). Hard rewards depth and consistency more than polarisation. Grass still separates warm-up specialists from clay tourists more sharply in narrative; hard’s story is event tier and transition.
Top outdoor Hard win rates (2022–2025, >40 matches)
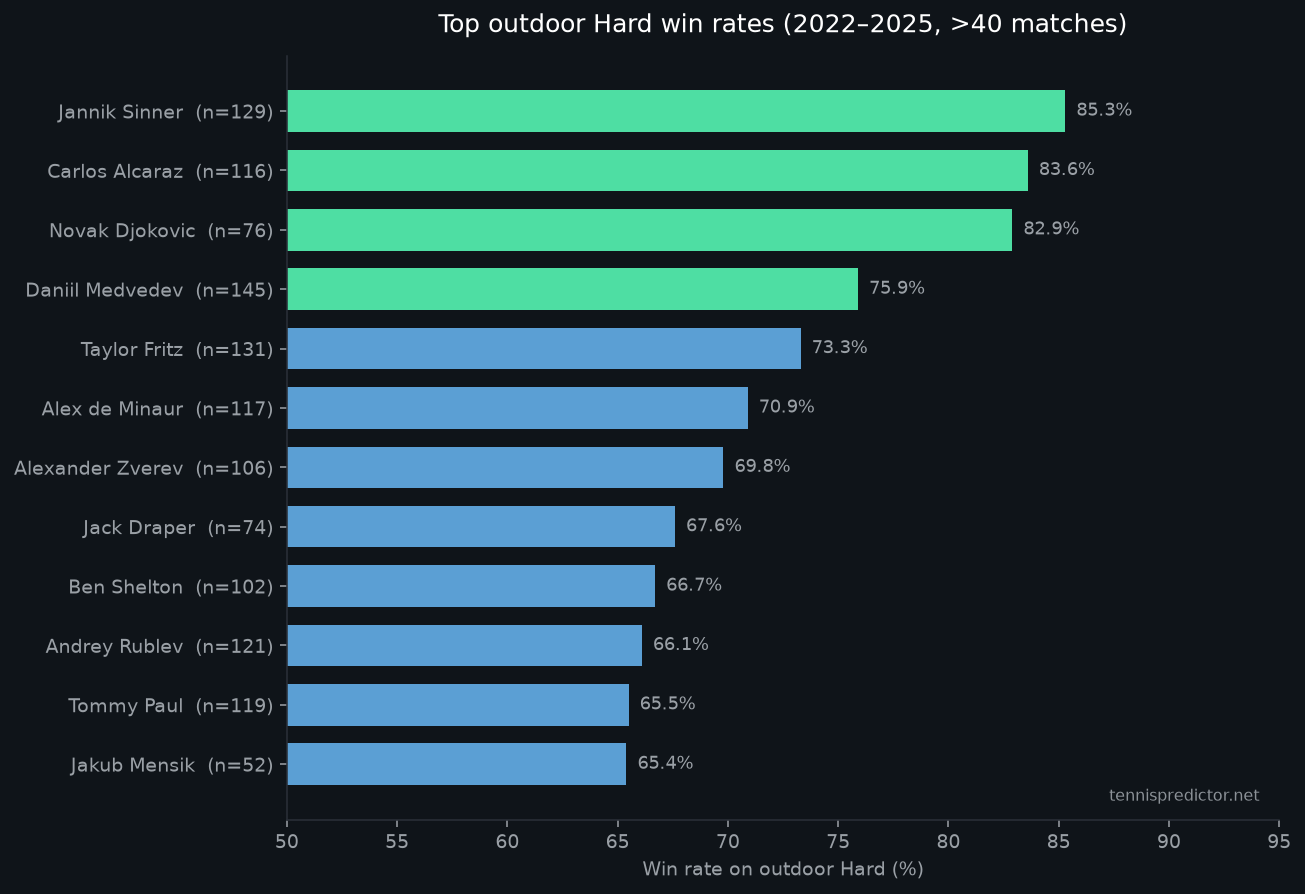 Ranked by outdoor Hard win rate; only players with more than 40 outdoor Hard matches. Sample sizes annotated.
| Rank | Player | Hard WR | Matches |
|---|---|---|---|
| 1 | Jannik Sinner | 85.3% | 129 |
| 2 | Carlos Alcaraz | 83.6% | 116 |
| 3 | Novak Djokovic | 82.9% | 76 |
| 4 | Daniil Medvedev | 75.9% | 145 |
| 5 | Taylor Fritz | 73.3% | 131 |
| 6 | Alex de Minaur | 70.9% | 117 |
| 7 | Alexander Zverev | 69.8% | 106 |
| 8 | Jack Draper | 67.6% | 74 |
| 9 | Ben Shelton | 66.7% | 102 |
| 10 | Andrey Rublev | 66.1% | 121 |
Sinner and Alcaraz are volume elites. Medvedev’s 75.9% across 145 matches is the clearest “hard identity” line below that ceiling. Raising the cut to >40 matches drops thin/era-skewed lines (e.g. Nadal 32, Kyrgios 36) so the board reflects sustained outdoor-hard workload, not a single hot swing.
Not all hard is equal — calendar spine
The hard season is a year-long spine: Australian Open → Indian Wells / Miami → clay break → Canada / Cincinnati → US Open → Asia → indoor swing. Those stops do not share one favourite-win profile.
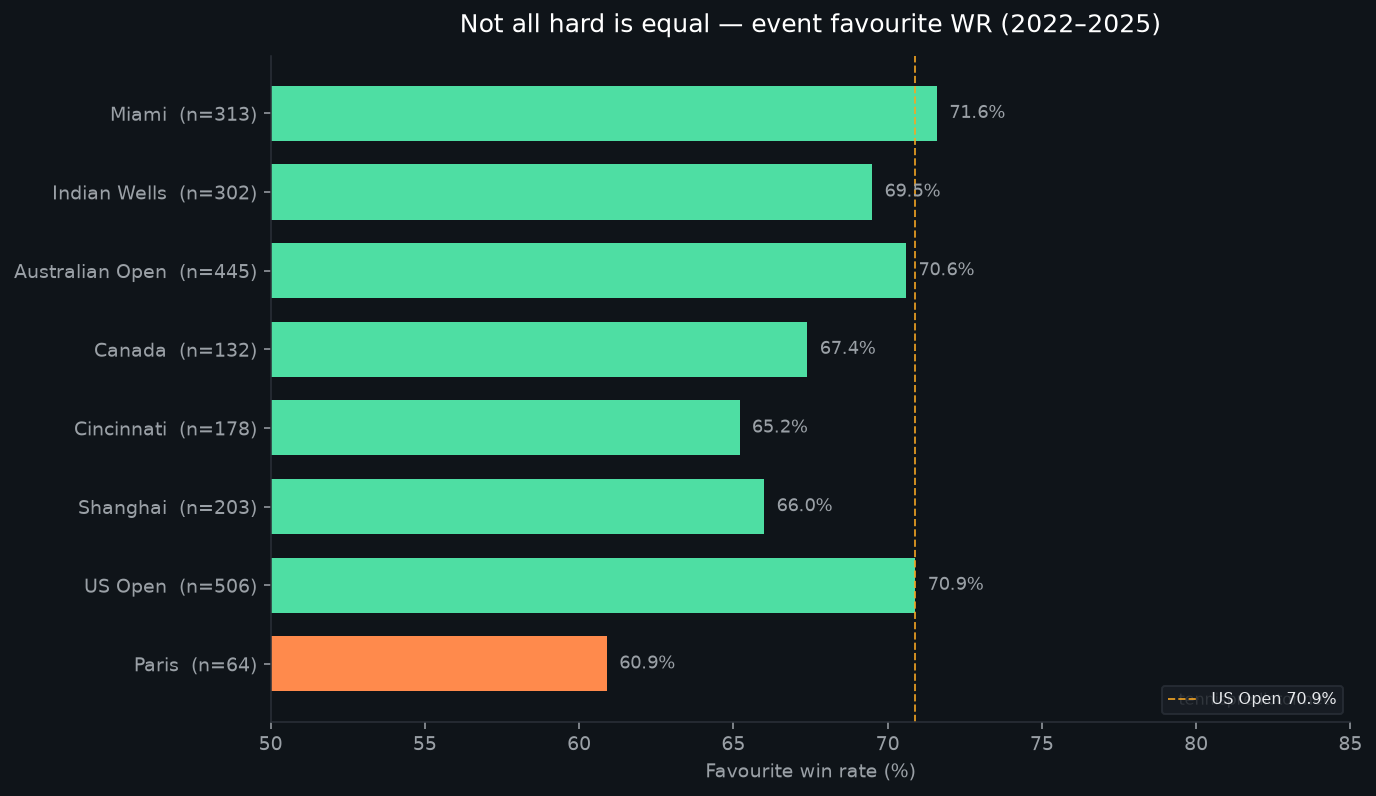 Green = outdoor Hard events; orange = Paris (Indoors). Dashed line = US Open 70.9% (matches the dedicated Flushing Meadows study).
| Event | With odds | Favourite WR | Upset rate |
|---|---|---|---|
| Miami | 313 | 71.6% | 28.4% |
| US Open | 506 | 70.9% | 29.1% |
| Australian Open | 445 | 70.6% | 29.4% |
| Indian Wells | 302 | 69.5% | 30.5% |
| Canada | 132 | 67.4% | 32.6% |
| Shanghai | 203 | 66.0% | 34.0% |
| Cincinnati | 178 | 65.2% | 34.8% |
| Paris (Indoors) | 64 | 60.9% | 39.1% |
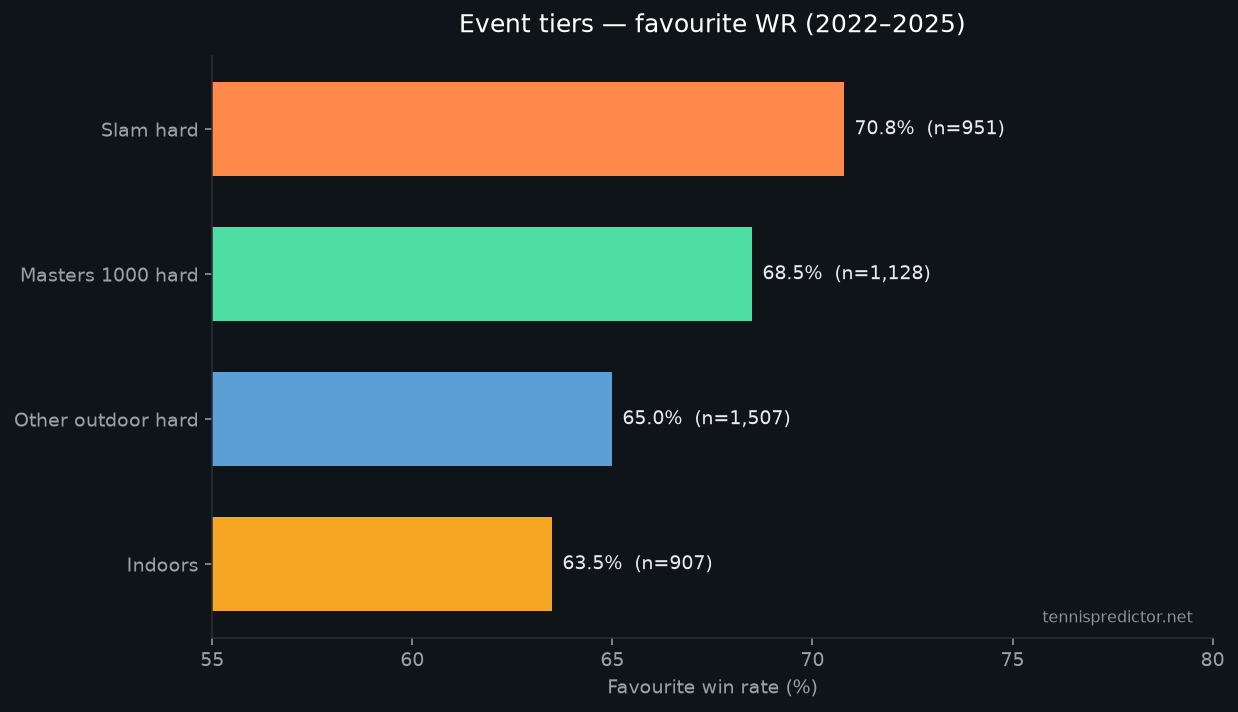 Slam hard vs Masters 1000 outdoor hard vs other outdoor hard vs Indoors.
| Tier | With odds | Favourite WR |
|---|---|---|
| Slam hard (AO + USO) | 951 | 70.8% |
| Masters 1000 hard | 1,128 | 68.5% |
| Other outdoor hard | 1,507 | 65.0% |
| Indoors | 907 | 63.5% |
Practical read: Miami leads this hard-event board. The US Open’s 70.9% favourite conversion matches our US Open 2026 betting preview — it is soft versus Wimbledon/RG in that Slam comparison, but not a collapse versus other outdoor hard majors. Paris indoors remains the clear trap if you import spring Masters intuition into Bercy.
Transitions into hard
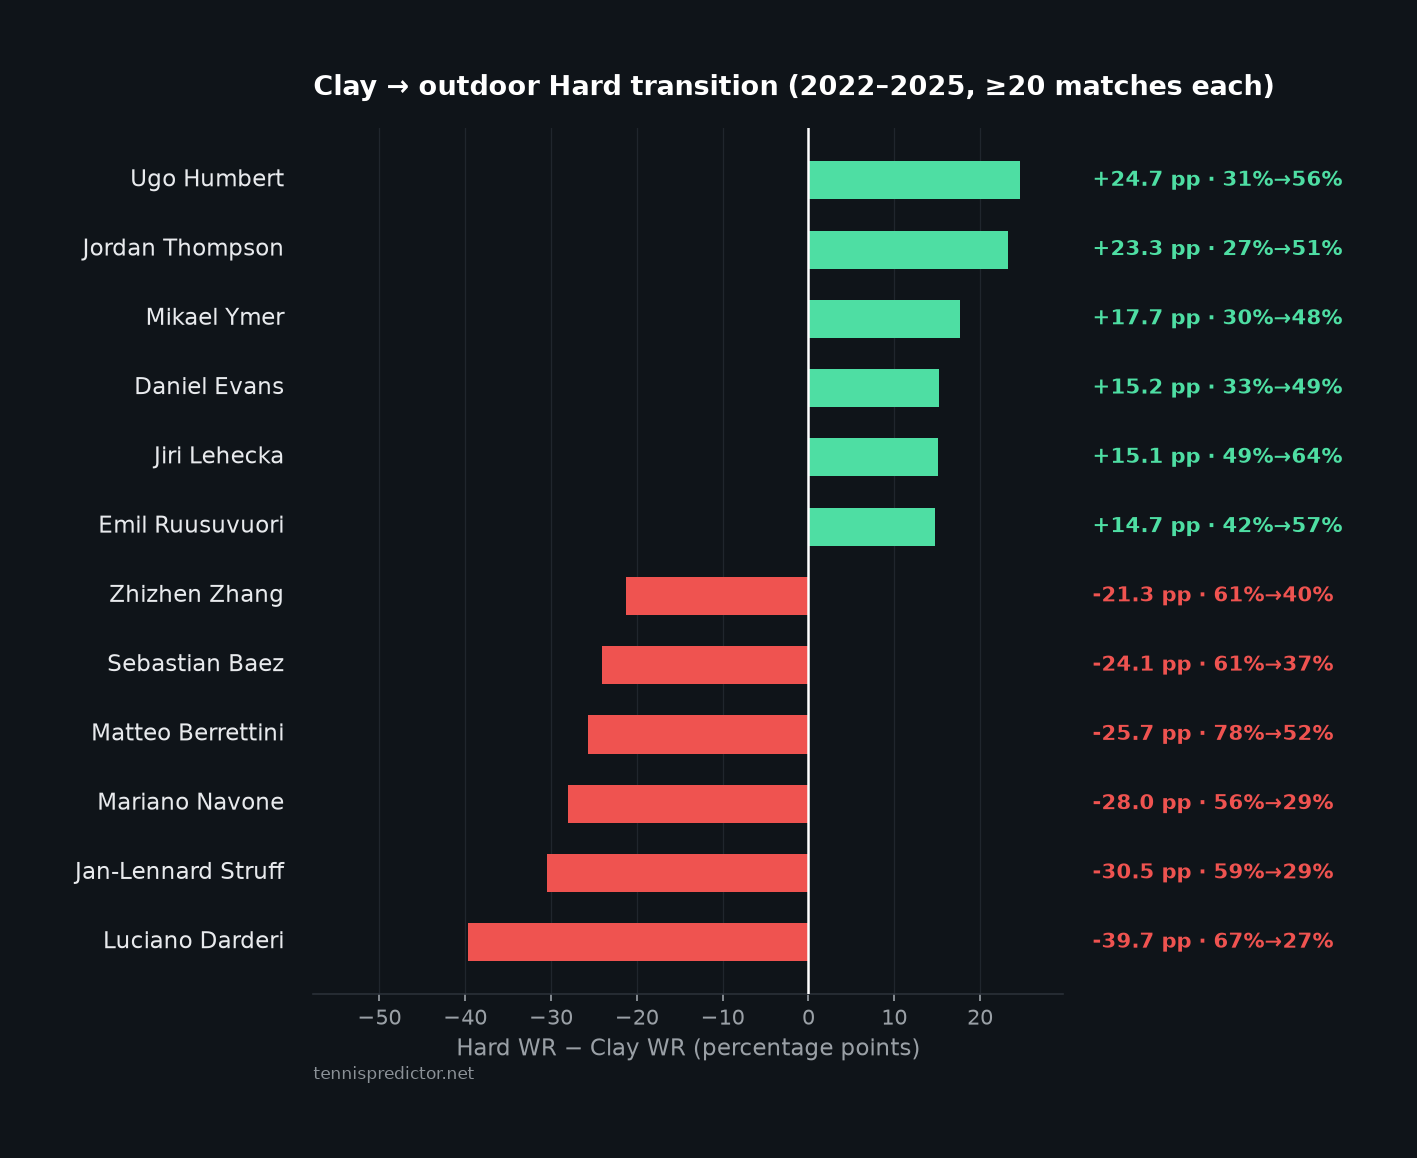 Players with ≥20 matches on clay and outdoor Hard (2022–2025). Negative = worse on hard than clay.
Biggest clay → hard drops:
| Player | Clay WR | Hard WR | Delta |
|---|---|---|---|
| Luciano Darderi | 66.7% | 26.9% | −39.7 pp |
| Jan-Lennard Struff | 59.1% | 28.6% | −30.5 |
| Mariano Navone | 56.5% | 28.6% | −28.0 |
| Matteo Berrettini | 78.1% | 52.5% | −25.7 |
| Sebastian Baez | 61.1% | 37.0% | −24.1 |
| Zhizhen Zhang | 61.3% | 40.0% | −21.3 |
Biggest hard premiums vs clay:
| Player | Clay WR | Hard WR | Delta |
|---|---|---|---|
| Ugo Humbert | 31.0% | 55.7% | +24.7 pp |
| Jordan Thompson | 27.3% | 50.6% | +23.3 |
| Mikael Ymer | 30.4% | 48.1% | +17.7 |
| Daniel Evans | 33.3% | 48.6% | +15.2 |
| Jiri Lehecka | 48.6% | 63.6% | +15.1 |
| Emil Ruusuvuori | 41.9% | 56.7% | +14.7 |
Post-Roland Garros into the North American hard swing, ranking often overstates clay specialists and understates flat-hitting hard regulars. That is the same transition logic we use on grass — applied to the bigger half of the calendar.
Odds brackets on outdoor hard
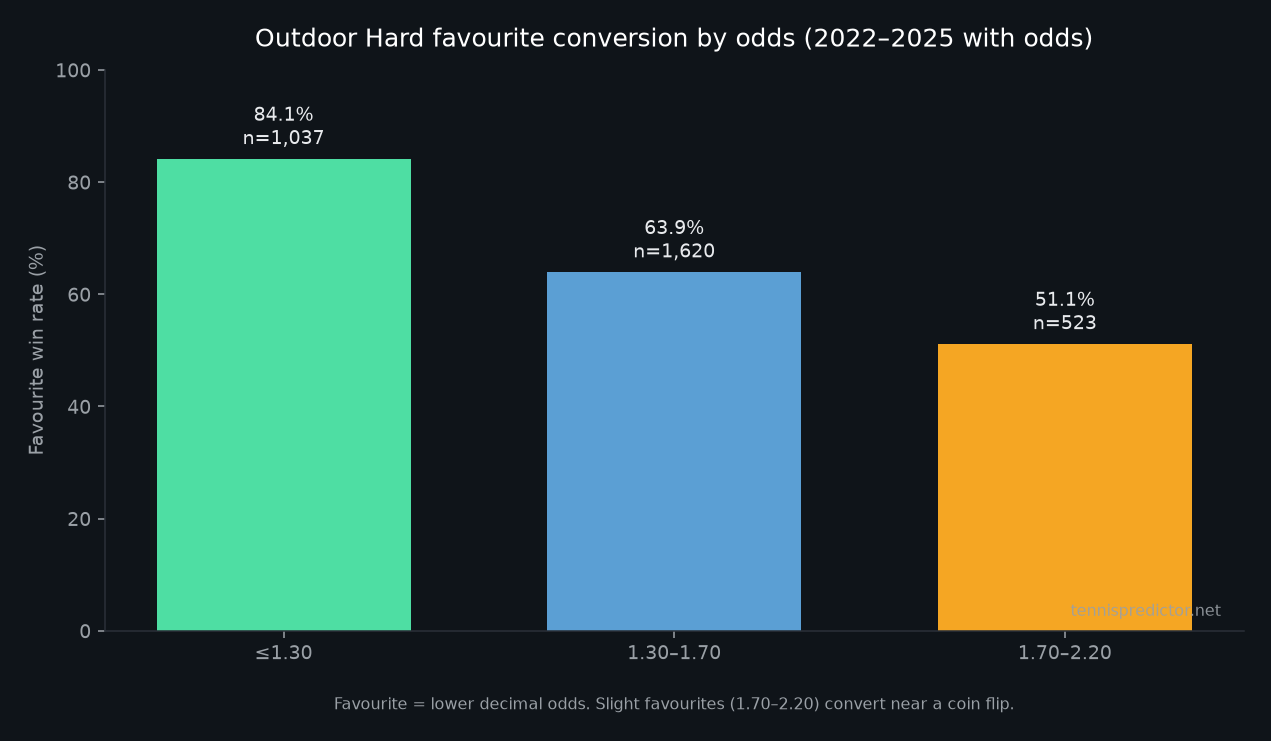 Outdoor Hard only. Favourite = lower decimal odds.
| Favourite odds | Matches | Favourite WR |
|---|---|---|
| ≤1.30 (heavy chalk) | 1,037 | 84.1% |
| 1.30–1.70 | 1,620 | 63.9% |
| 1.70–2.20 (slight fav) | 523 | 51.1% |
Heavy chalk behaves like heavy chalk. The trap is the 1.70–2.20 band — priced as a favourite, converts like a coin flip. On outdoor hard, “slight favourite” is not a soft lock.
First set → match on hard
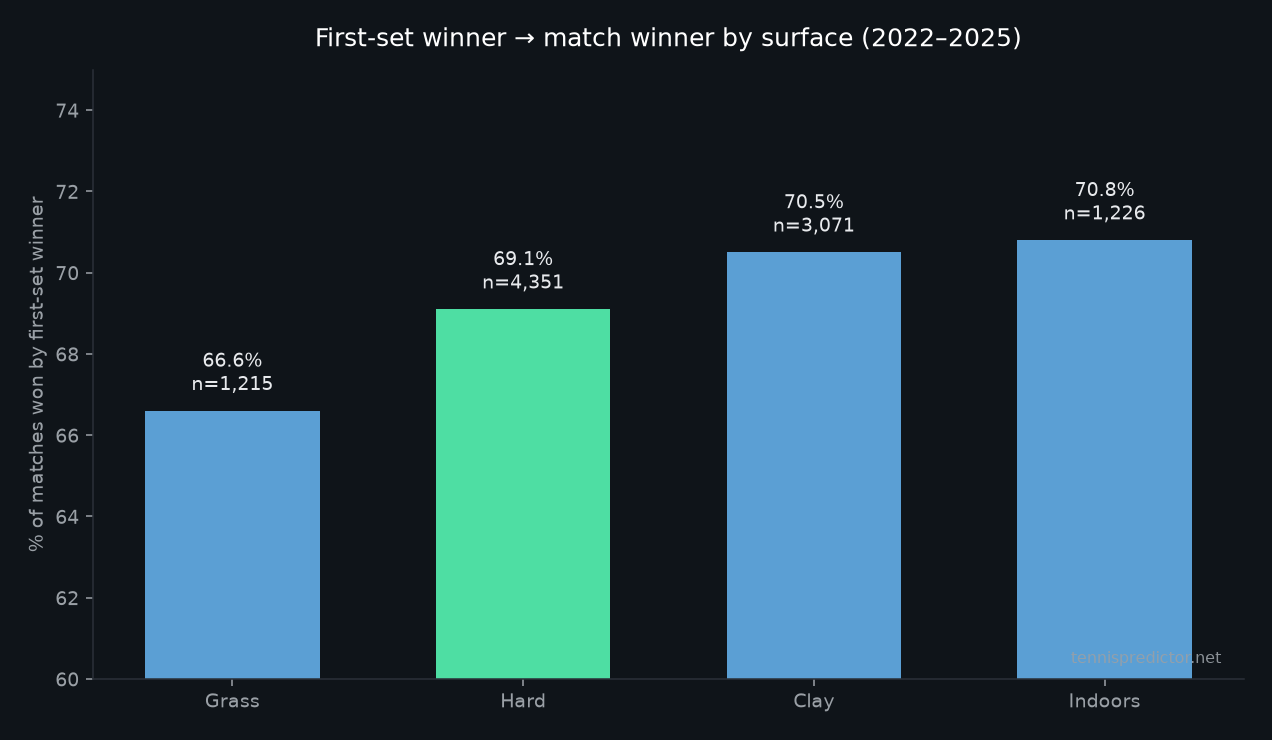 Share of matches won by the player who took set one.
| Surface | First-set winner closes | Matches scored |
|---|---|---|
| Indoors | 70.8% | 1,226 |
| Clay | 70.5% | 3,071 |
| Outdoor Hard | 69.1% | 4,351 |
| Grass | 66.6% | 1,215 |
Outdoor hard sits with clay, not with grass. Losing set one on hard is not a “slow start on a neutral surface” — it is still a roughly 31% salvage job, close to clay’s published pattern in our clay guide.
Worked betting vignette
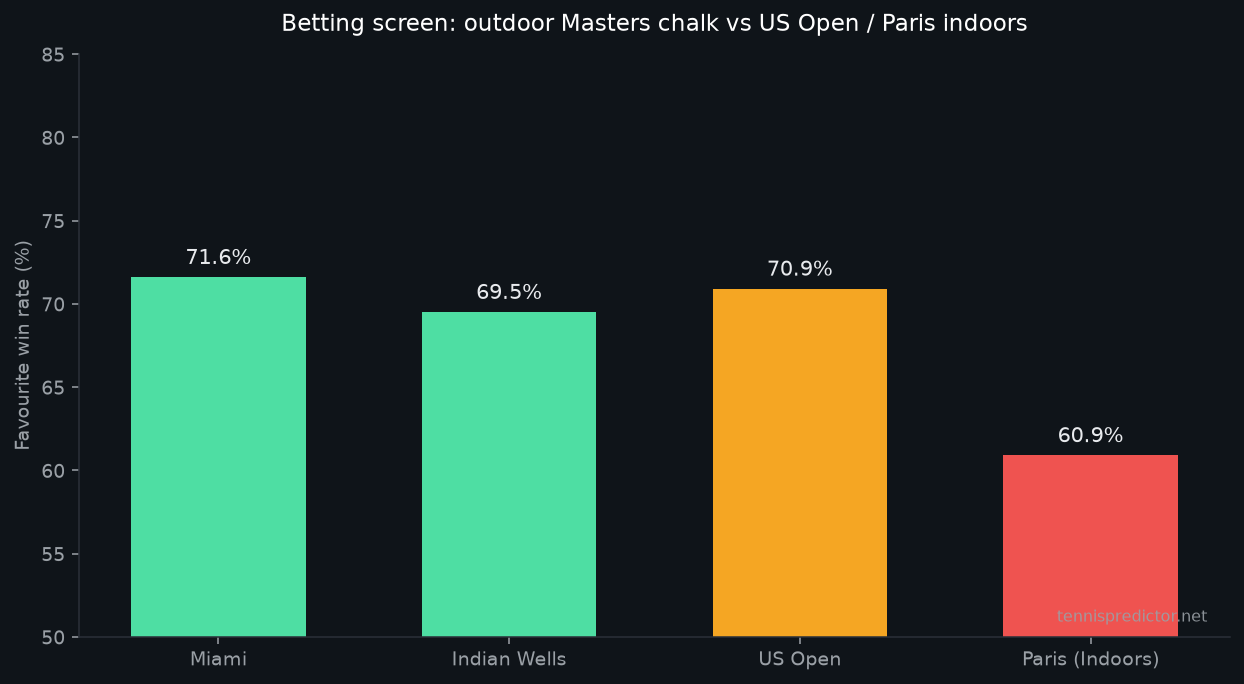 Favourite WR: Miami 71.6%, Indian Wells 69.5%, US Open 70.9%, Paris indoors 60.9%.
Suppose today’s dashboard shows a top-10 chalk in Miami and a similarly short price in Paris indoors. The hard cache says those are not the same bet: spring Masters outdoor chalk has held in the low-70s; US Open favourites convert at 70.9% (same figure as our Flushing Meadows preview); Paris indoors sits near 61%. Separately, if a clay specialist priced on ranking walks into week-one Canada/Cincy, the clay→hard table is the fade screen — not the ATP ranking alone. Predictable chalk still needs a price; the point is not to back every Miami favourite blindly.
Hard-season checklist
Before a hard swing:
- Split outdoor Hard vs Indoors in your notes — do not carry “hard form” across Paris or Vienna unchanged
- Flag clay→hard drops (Darderi, Baez, Navone-style lines) after Roland Garros
- Prefer event context: Miami/IW ≠ US Open ≠ Paris
On match day:
- Distrust slight favourites in the 1.70–2.20 band on outdoor hard
- Treat first-set deficits on hard like clay, not like a free live recovery narrative
- Re-check today’s dashboard before sizing
2026 YTD callout
Through 29 August 2026, the cache has 843 outdoor Hard matches. Odds coverage is only ~38%, so we do not publish a 2026 favourite-win headline (same trap as 2025). Use 2022–2025 for base rates; treat 2026 as a volume/context update until odds coverage recovers. For mid-season player reliability, see most predictable players 2026 YTD.
Frequently asked questions
Are outdoor hard and indoor hard the same surface for betting?
No. Our cache labels them Hard vs Indoors. Aggregate favourite WR is close (64.3% vs 63.5%), but events diverge sharply — Miami vs Paris is the clearest example.
Is hard court the most predictable ATP surface?
Not in this window. Clay’s favourite WR (65.9%) edges outdoor Hard (64.3%). Predictability is more about event and odds band than the hard label alone.
Which hard events favour backing favourites?
Miami (71.6%) leads this sample among the listed stops. The US Open (70.9%) matches our dedicated Flushing Meadows preview. Paris indoors (60.9%) is the softest of these priced boards.
Do clay specialists struggle on hard?
Many do — drops of 20–40 percentage points appear among players with ≥20 matches on each surface. Always check match counts; thin lines move fast.
How many hard matches are in the study?
4,355 outdoor Hard and 1,226 Indoors ATP matches from 2022–2025, from a 9,870-match multi-surface window.
Related articles
- ATP grass court specificity
- Clay court betting guide: Roland Garros season
- US Open 2026 betting preview
- Most predictable tennis players 2026 YTD
- The nationality factor
Data: ATP tournament cache, 2022–2025 (plus 2026 YTD volume note through 29 Aug 2026). Favourite metrics use bookmaker odds when present. Analytics only — not betting advice.
See today's match predictions with confidence scores and value signals.
View Live Predictionsarrow_forwardRelated Articles
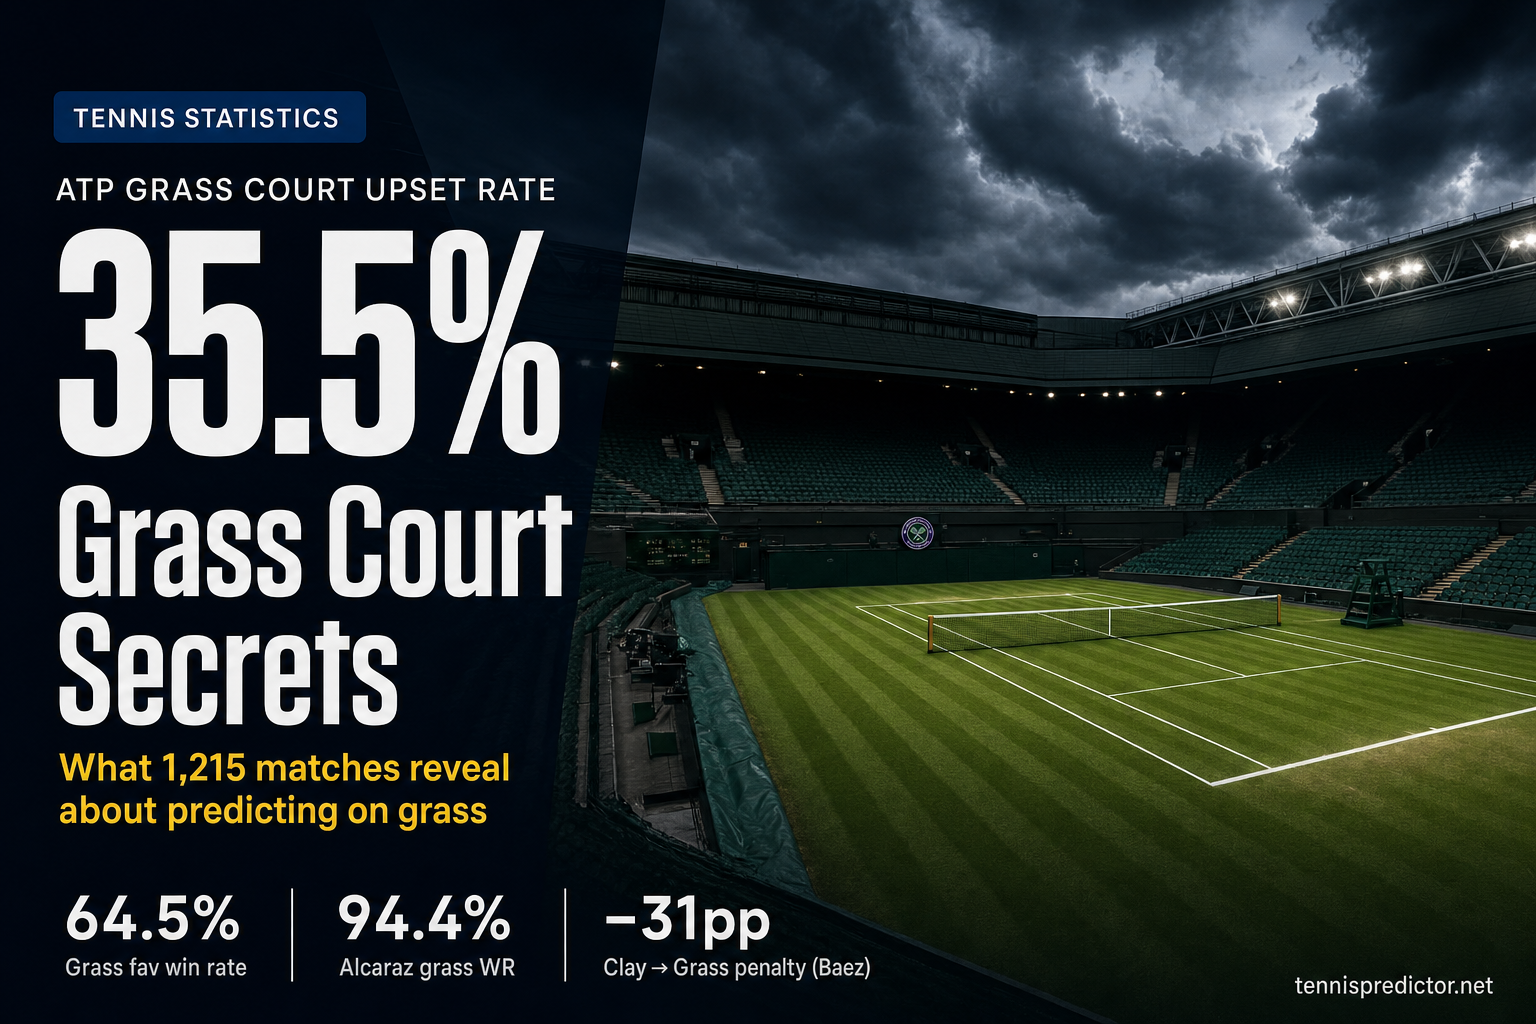
ATP grass court specificity: what 1,215 matches really tell us
Everyone repeats the same myths about grass — that it's random, that serve specialists always win, that clay court form means nothing. Our model disagrees. We dug into 1,215 ATP grass matches from 2022 to 2025 to separate the folklore from the numbers.
June 13, 2026 · 16 min read
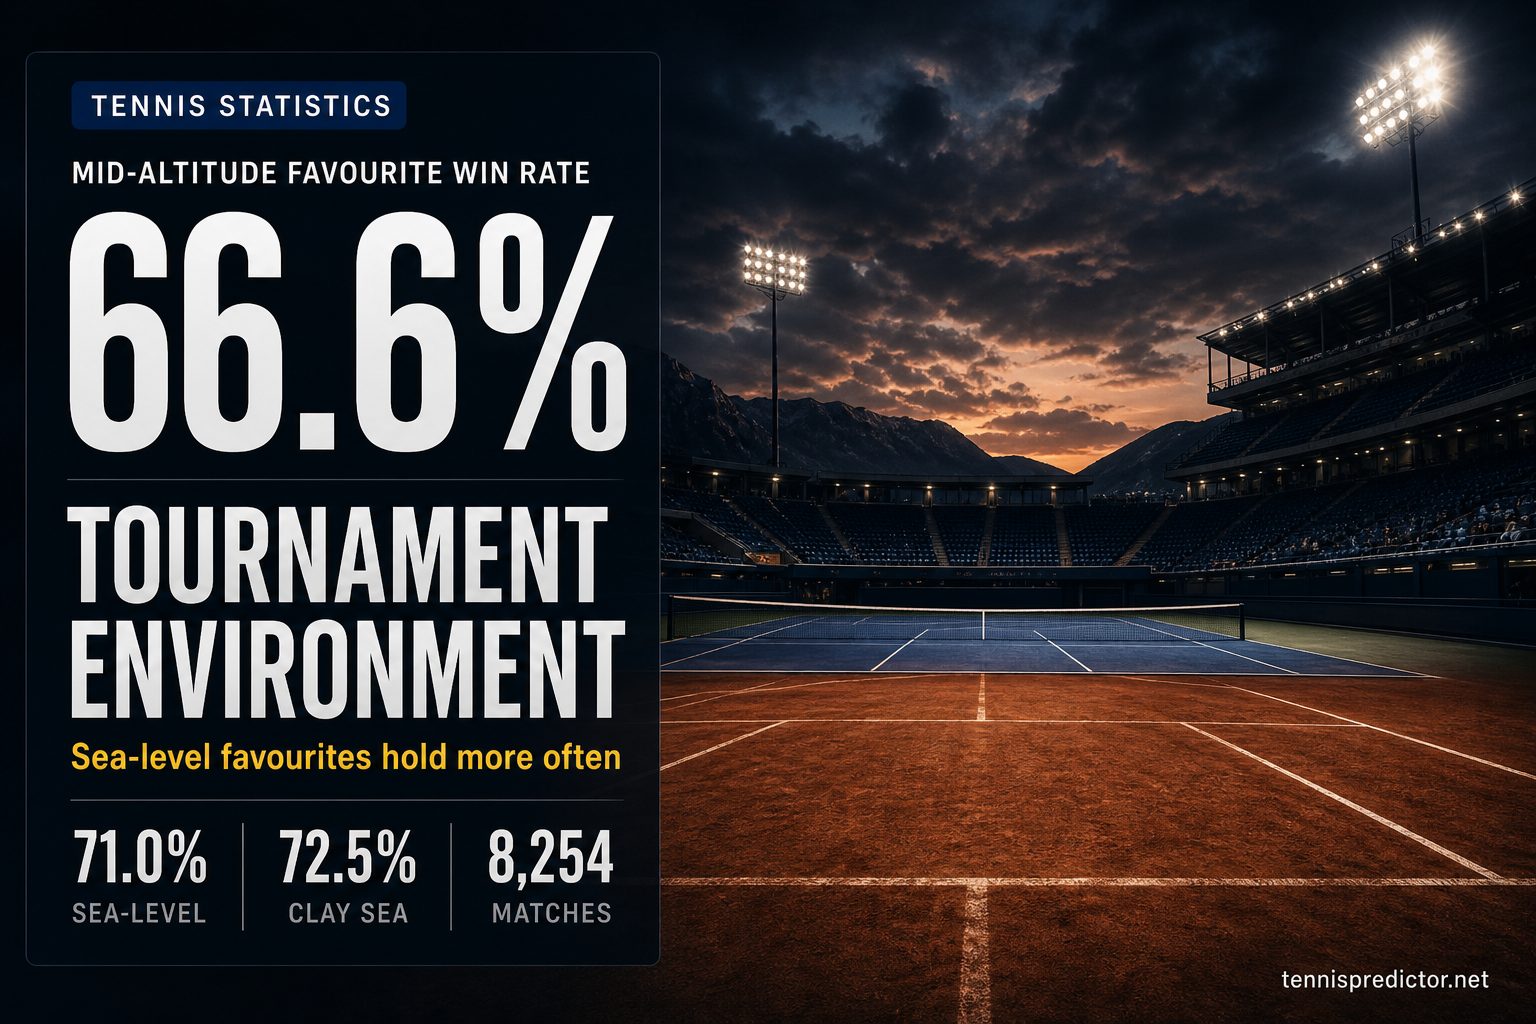
Does tournament environment change favourite win rates?
Altitude and typical venue climate are rarely priced as cleanly as surface. We joined 8,254 ATP matches with odds (2022–2025) to curated venue elevations and monthly temperature/humidity normals. Mid-altitude favourites win less often—especially on clay.
July 30, 2026 · 20 min read
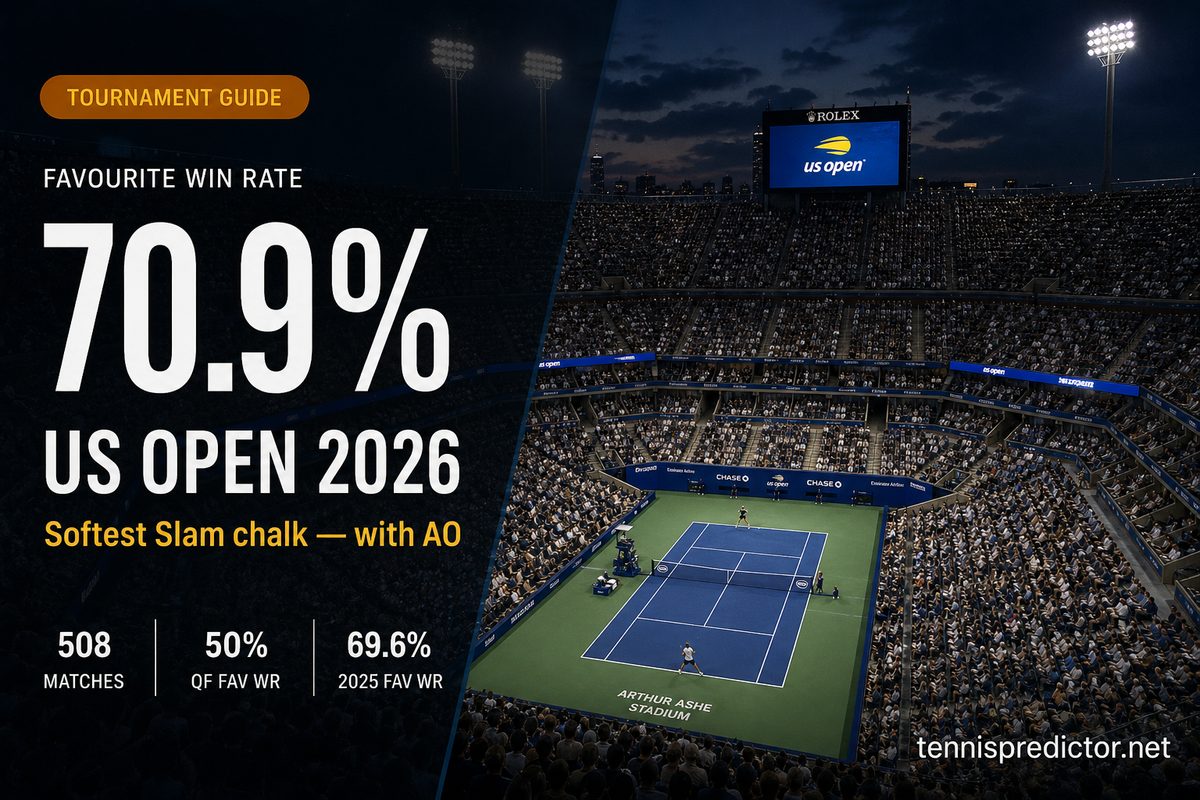
US Open 2026 betting preview: what 4 years of Flushing Meadows data reveals
This US Open 2026 betting preview uses four years of Flushing Meadows match data. Bookmaker favourites won 70.9% across 508 main-draw matches — with a soft quarter-final window, outdoor hard-court set patterns, and clear contender fingerprints for 2026.
July 18, 2026 · 15 min read
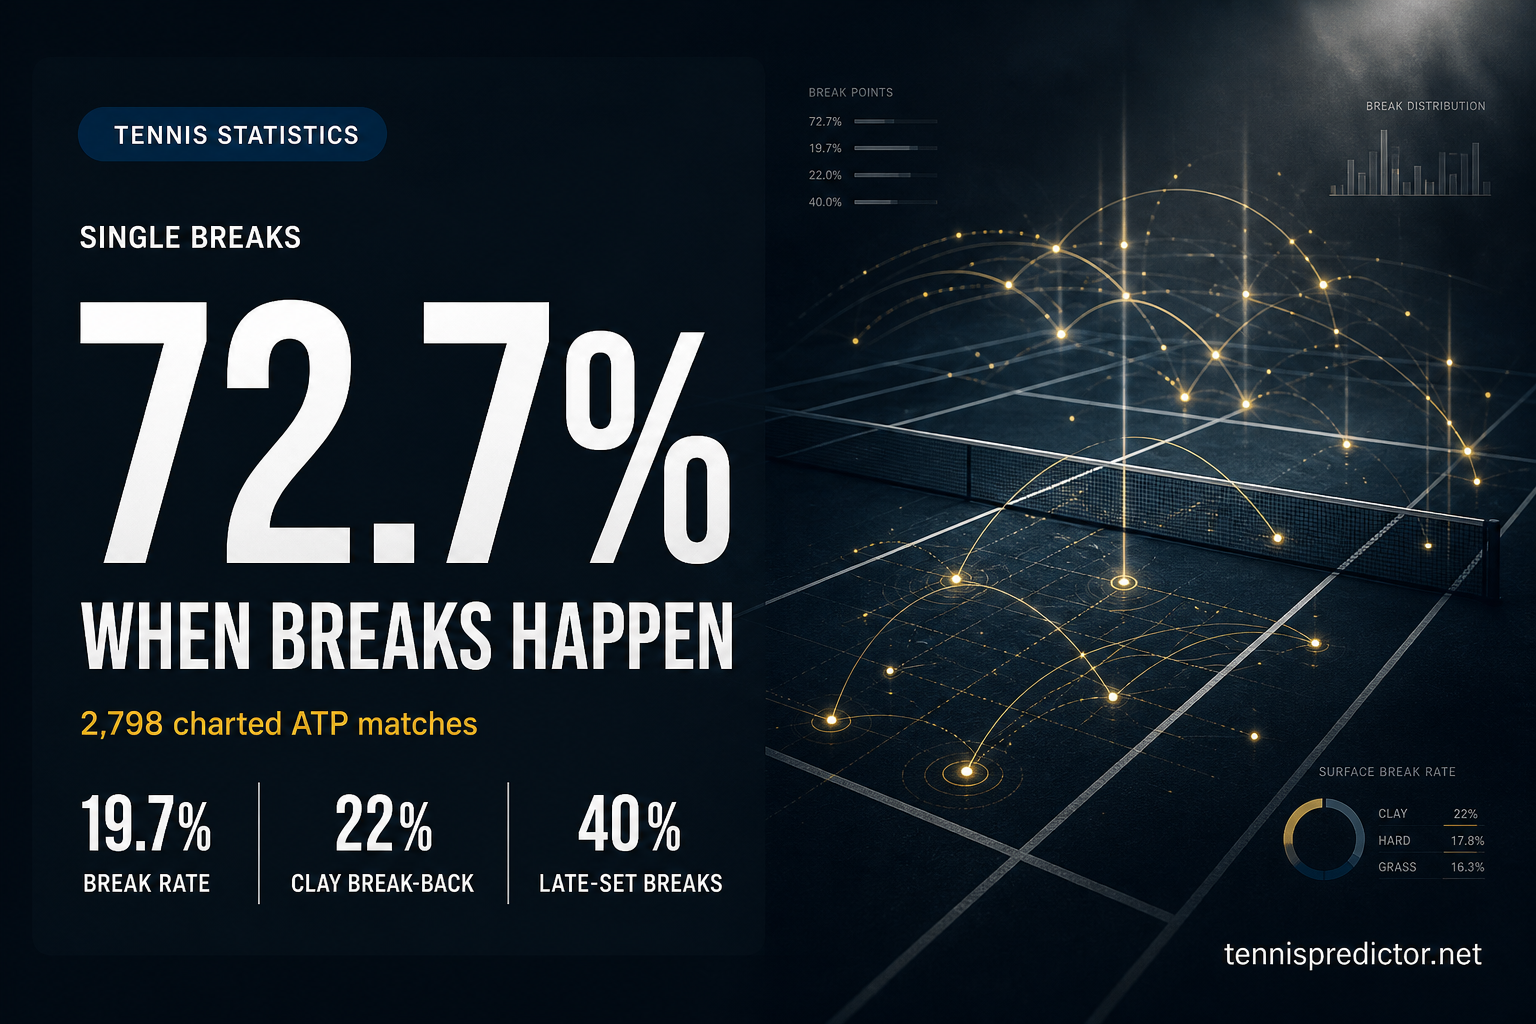
When breaks happen: ATP set patterns from 2,798 charted matches
Most ATP breaks are isolated — not part of a streak. Yet they cluster in the final third of sets, and clay courts trade breaks far more often than grass. We analysed 2,798 charted men's matches from 2022 onward to map when breaks happen, how often players break back, and what set-one patterns look like by surface.
July 15, 2026 · 18 min read